
It’s 2026. A dictator has been deposed. Talks of war with Iran. Freedom of speech is under attack again, as the UK, Canada and Australia suggest banning X. Equities and Gold are crushing new all time highs and Bitcoin is under $100K. It’s hard to believe it’s only the 12th of January given so much has happened.
Last issue‘s positioning was justified: Bitcoin trended down on the back of continued institutional selling and equities up on strong fundamentals and liquidity drivers.
We also saw strong S&P 500 performance triggering Tom Lee’s “first five days” rule, a historical bellwether for a strong performing year ahead. That is, when the S&P 500 is up over 1% in the first five days of the trading year, since 1950 the average annual return for the full year is then 16%, versus just 3% when it is less than 1% in the first five days. That’s great news for equities.
Let’s dive into Bitcoin, trading at $92,000 as of writing.
Bitcoin Investor Flows
Today Bitcoin’s biggest headwinds are poor relative performance to other major asset classes on the back of massive investor deallocation through 2025. Recently, Capriole Top Models have also been popping off amidst mounting long-term holder selling and suggest turbulence ahead.
We can visualize long-term holder distribution several ways. Below we see rapid run-ups in CDD Trend (red) and Supply Delta (orange). All prior historical instances like today coincided with volatile periods and often major price tops. Spikes in Supply Delta suggest a growing relative portion of short-term holders versus long-term holders. Spikes in CDD Trend suggest a growing number of coin days destroyed, which means the value of coin transactions made weighted by how long it has been since they last move is high (more old coins are selling).
Currently both metrics are triggering warning signs.

Capriole Top Models track long-term holder activity and have both triggered recently. Suggesting volatility ahead for Bitcoin at best, and significant downside at worst.
Strong trends in the Percent Addresses in Profit are great for Bitcoin bull markets. The more money coming into the market, the more sustained breakout trends are. This makes most prior holders “profitable” in their positions, so it’s common to see extended periods of the Percent addresses in Profit metric above 80-90% in bull markets.
However, what you do not want to see are persistent breakdowns in this metric.
When a growing number of holders are “less” profitable, by definition the price trend is weakening. The below chart has circled all the primary profitability trend breakdowns, and failed retests coming out of an extended period of high profitability, similar to what we are seeing today. They were all historically within months of the major cycle top.
We are seeing a breakdown in “Percent Addresses in Profit” today, structurally similar to four prior late cycle occurrences which all triggered within months of cycle tops.
Bitcoin Technicals
Bitcoin has major resistance at $93,500. Flipping on the daily is the first milestone to break the current bearish trend. A weekly price close above this would likely see us trend to $100,000+ on the back of a confirmed false breakdown. Until then, there persists a bearish technical bias, with deep value opportunities between Bitcoin’s Electrical Cost (BEC) and Bitcoin Production cost (BPC) marked on the following chart. Given we are at $92,000 today, that’s a relatively nearby line in the sand, which makes for good near-term opportunity and position management. While it’s bearish until we close above $93,500 the fact that BEC and BPC are relatively nearby tells you that downside is somewhat constrained today, with any calls for sub $60K being unreasonable.
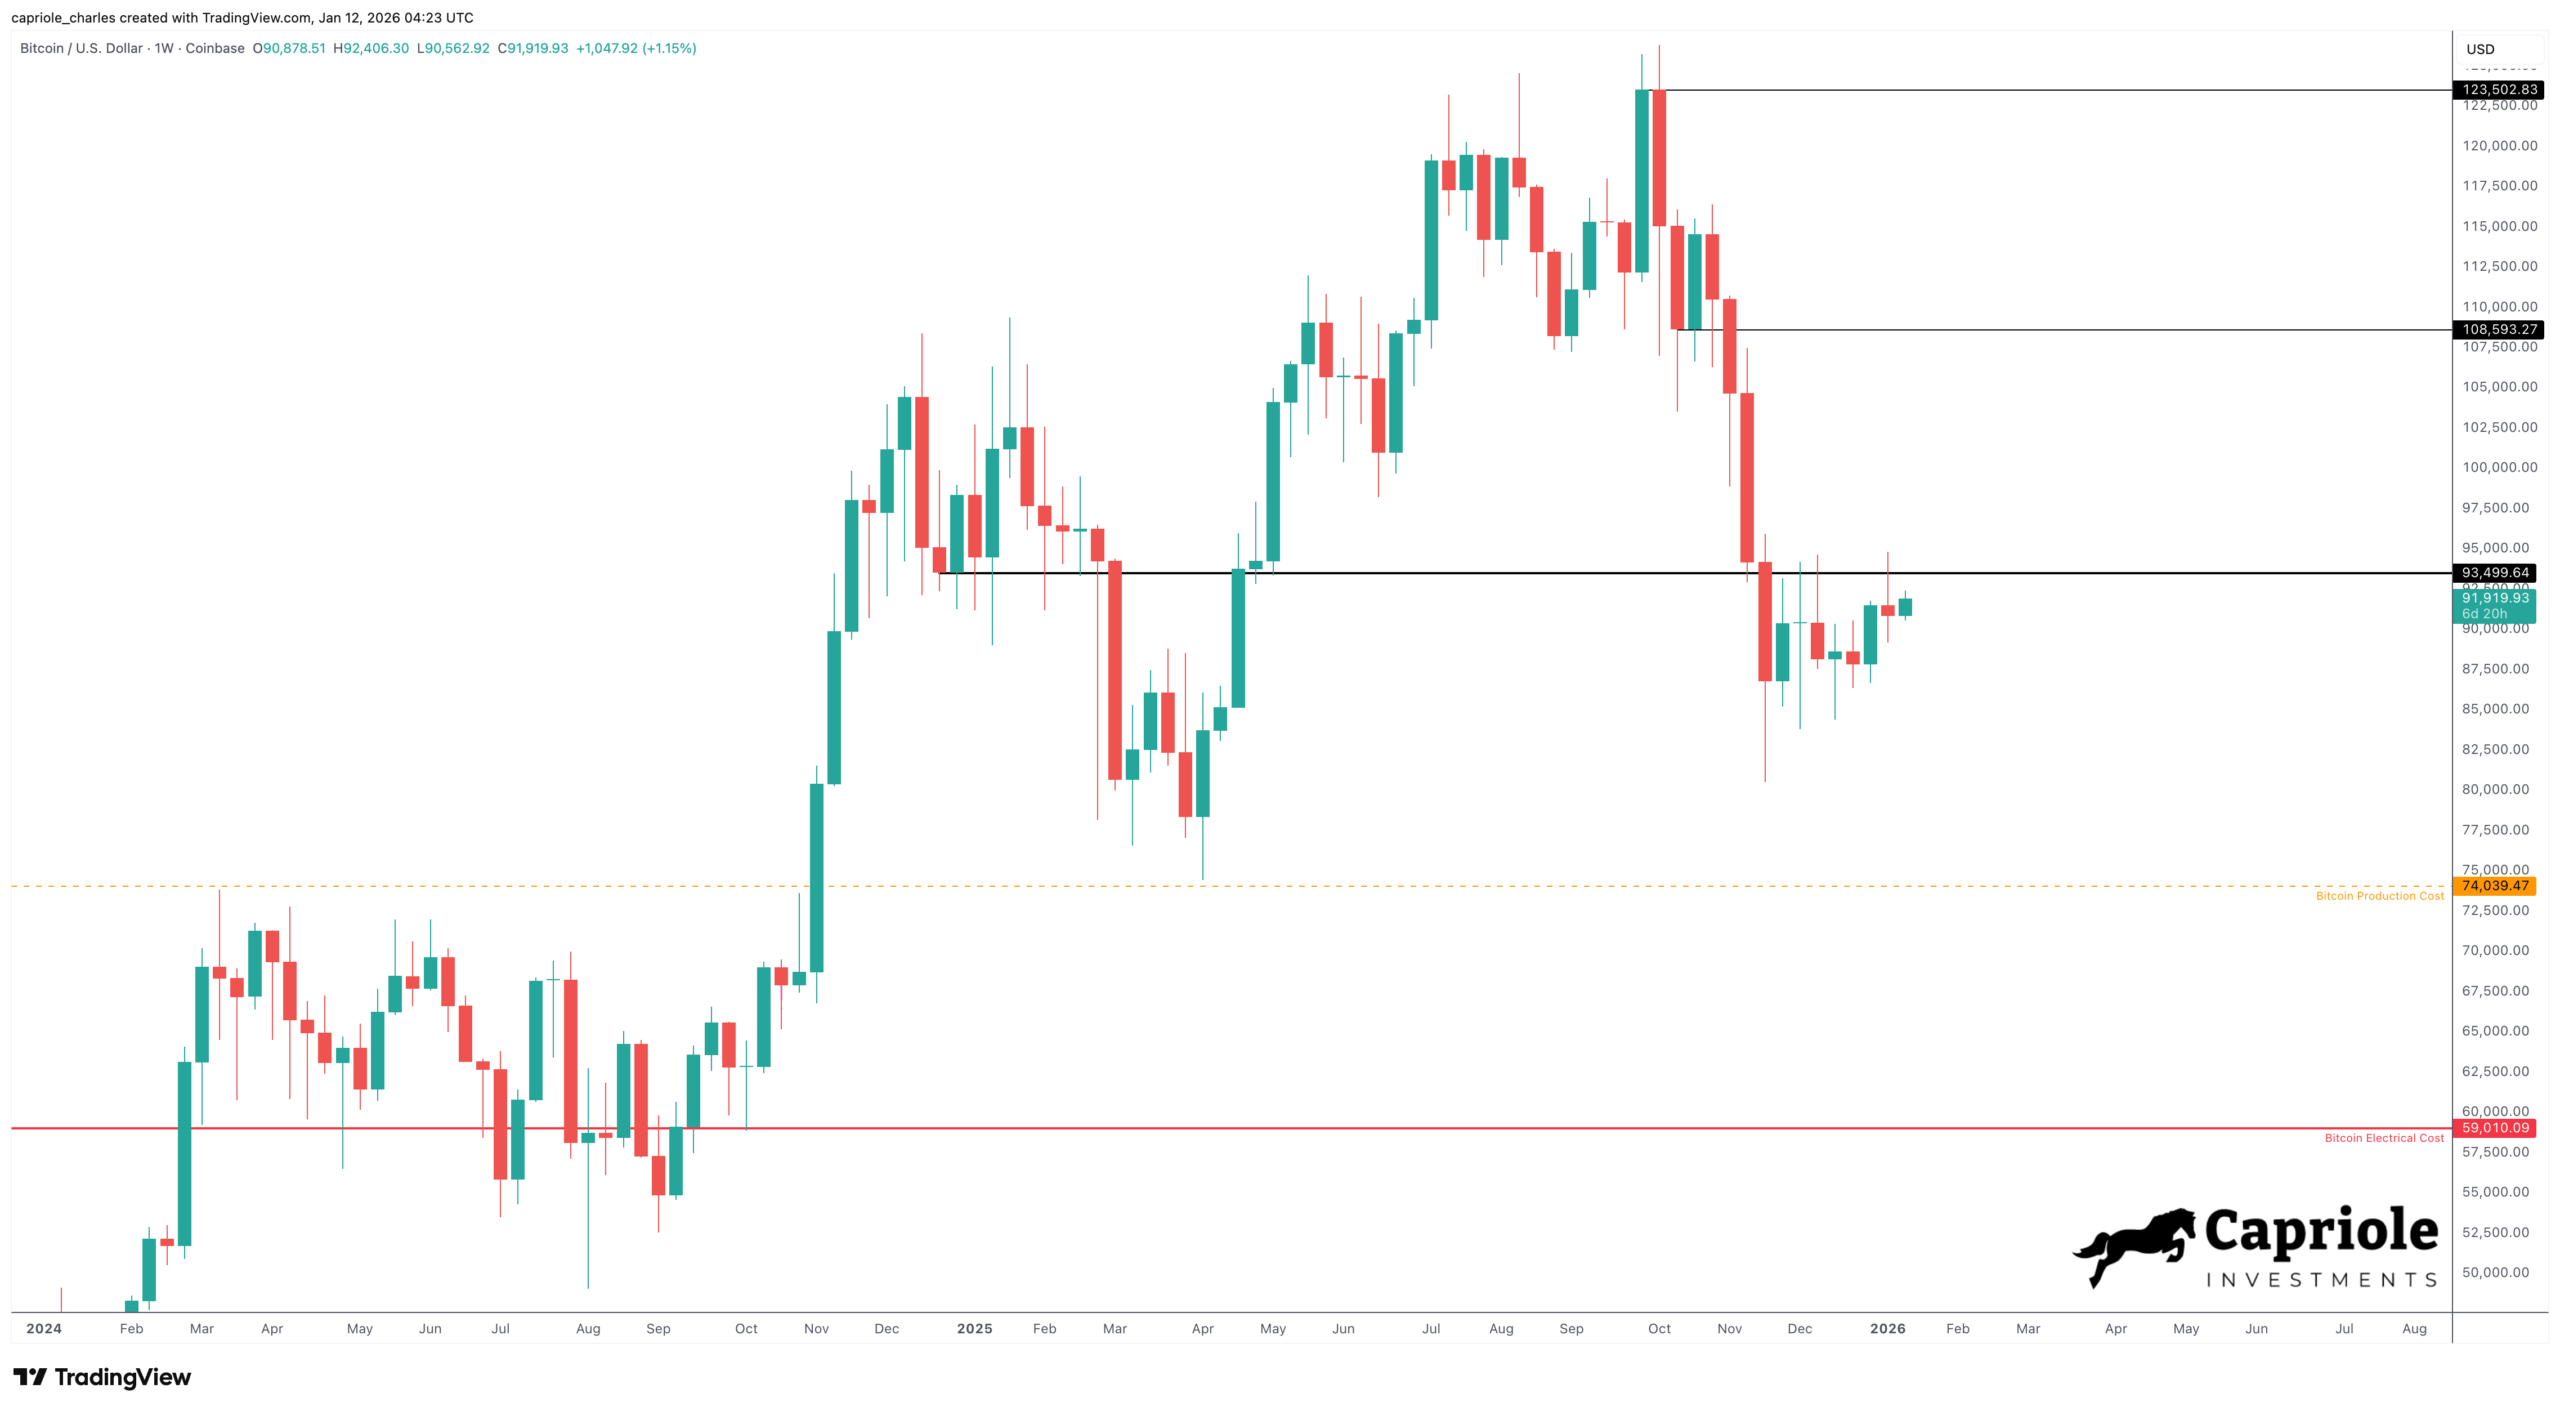
Bitcoin technicals: bearish until we close above $93.5K.
Bitcoin Fundamentals
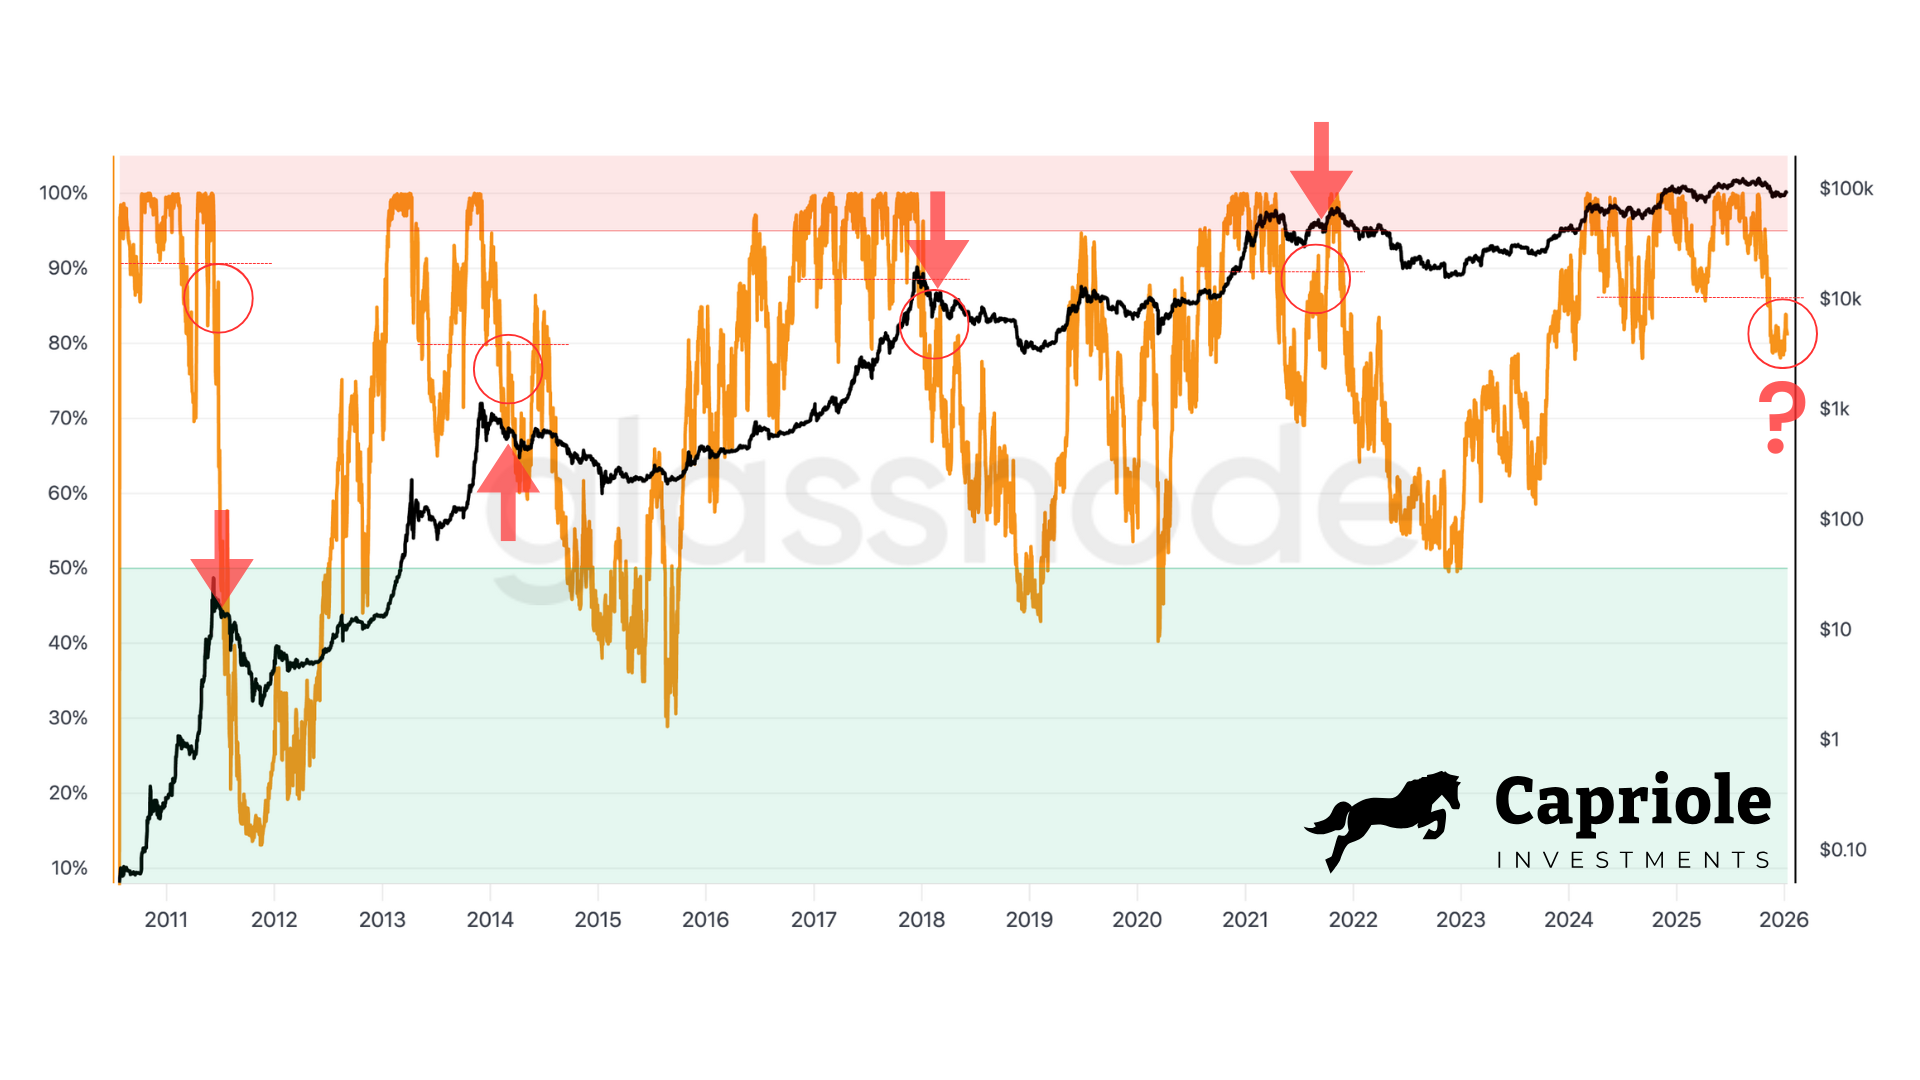
Bitcoin Investor Flow behaviour (long-term holders, OG selling, PnL metrics) are all suggesting a bearish or late cycle trend, which paint a concerning 12-18 month outlook for Bitcoin historically. However, at the same time we have a number of classic on-chain metrics suggesting we are in a value zone for Bitcoin. Take the Bitcoin Yardstick for example. Today we are once again in a value zone, comparable with all major price bottoms of the past. However, note the chart, these value zones can last a while. It’s normal to see significant price volatility within value zones. Usually they represent long-term opportunities, but are not necessarily good for timing entries.
For Bitcoin Yardstick, when we depart the value zone (suggestive of recovery) can actually be a great opportunity and market timing signal (see the right hand edge of each box below), they all saw strong risk-adjusted opportunities almost immediately in the past. You can set alerts for this kind of thing on Capriole Charts.

We are bang in the middle of historical value for Bitcoin across many on-chain metrics, like Bitcoin Yardstick here.
Dynamic Range NVT is another classic on-chain metric that values Bitcoin based on network throughput (transaction volume). It has historically identified all major bottoms, as below it is also showing we are in a value zone today. However, you can also see some ‘value’ zones that occur relatively early in bear markets on the below chart. This is because at the turning point from bull-to-bear you still have a lot of network value (transactions, throughput, energy/mining commitment, etc), but start to see a sharp shift in investor behaviour and momentum, which is at first better reflected in price. Dynamic Range NVT is the type of metric that requires a lot of confluence with other metrics and should not be interpreted alone, because it can give false signals. Nonetheless, long-term today’s prices are likely an opportunity, but this value metric is not good for market timing alone.
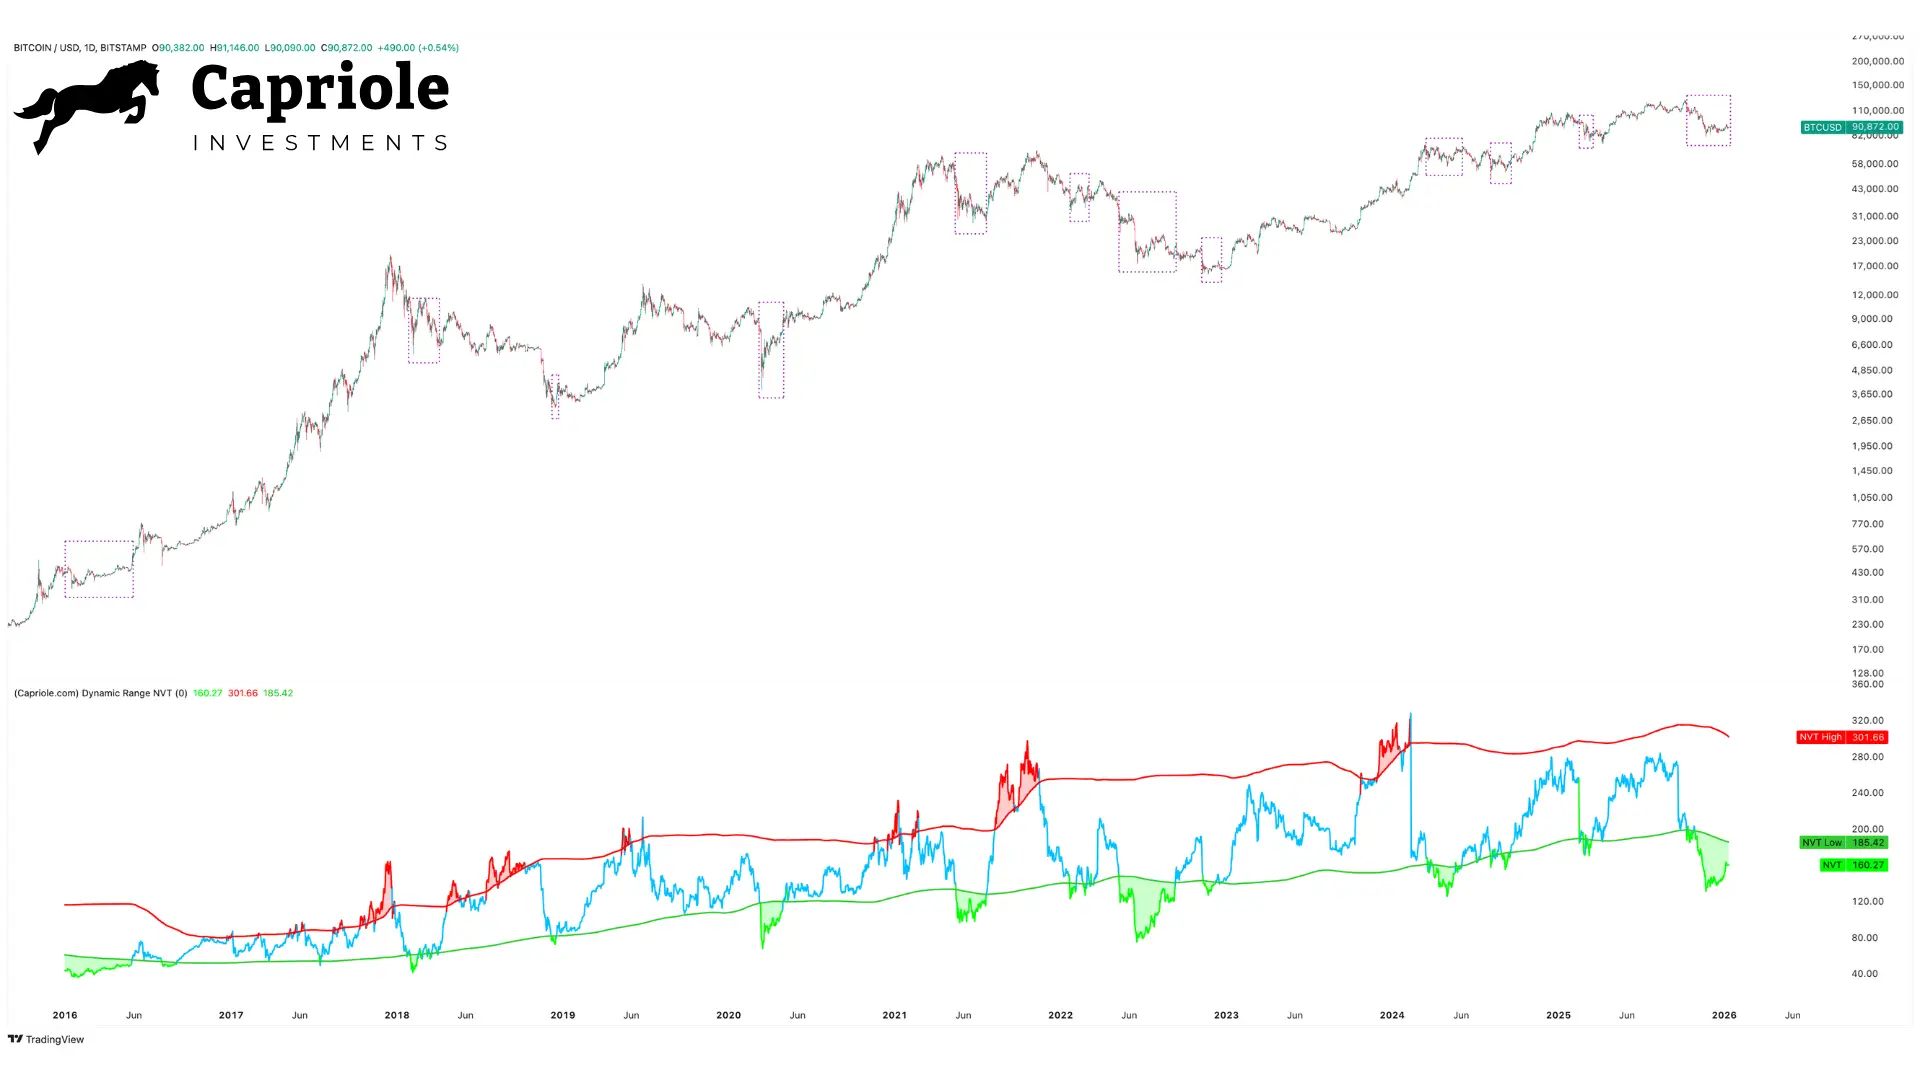
On net we have some signs of value, like in Dynamic Range NVT here. Great for the long-term holder who can weather a ton of volatility. But the investor flow behaviour suggests we may have further downside to go, or should at least expect volatility.
2026 Bitcoin Outlook
Bitcoin has all of the right catalysts today:
- The Federal Reserve is cutting rates
- Just 2 weeks ago, the Fed started QE, growing its balance sheet by $40B per month
- Jerome Powell is due to be replaced by a low-rate leaning, Trump preferred, chair
- Inflation (CPI YoY) has dropped below 2% for the first time in 5 years
- Unemployment has been ticking up, now at 4.4%
- US midterm election incoming (next 3-9 months)
- Trump calling for US credit card interest rate cap at 10%
- US to make small Bitcoin transactions tax free
- M2 global money supply growing 10% a year, as fast as mid-2020 in the peak of Covid
All of the above catalysts are major supports for liquidity and Bitcoin. Bitcoin really has no excuse not to be showing outperformance in this environment. Perhaps that is just what is about to come? It could be that Q4 2025 (and perhaps Q1 2026) is the period the OG Bitcoin cycle believers de-risk, and set the floor for a second wave higher through 2026. 2026 could be the year that Bitcoin plays catch up on Gold’s massive $10T market cap gain over the last 12 months. We are open minded to this being a credible scenario. We would in fact welcome it.
However, we need to see at least one of the following occur to make this a credible scenario and position accordingly
- Improved Price Action
- Near-term: Daily Bitcoin close above $93,500.
- Trend changing: Weekly Bitcoin close above $109,000.
- Very Deep Value
- Bitcoin trading below Production Cost, ideally near Electrical cost and even better, showing deep value across many metrics like we saw after the FTX collapse here. When deep value is the only factor you have, it needs to be extreme to justify an allocation amidst poor price action and investor flows. However, getting here typically requires much larger price discounts by definition.
- Seller Exhaustion
- Significant decline in OG Whale selling, closer to baseline ~0.02% market cap per day (it’s over 250% higher than that today at 0.07%).
- Net positive Institutional buying. Today institutions are net sellers of Bitcoin.
- A Real Quantum Proof Roadmap
- Bitcoin is the most quantum vulnerable asset in the world today. It is a honeypot to the Quantum computing industry. Now that we have entered the Quantum hack event horizon – the time required to implement an upgrade to Bitcoin is longer than the time of a non-zero quantum breach risk – we must discount the fair value of Bitcoin today accordingly. Today, we must discount the fair value of Bitcoin by 20-30%. This means that while metrics like Bitcoin Energy Value suggest a fair value for Bitcoin of $148,000 it is actually much closer to $118,000 due to this risk. A discount factor should be applied to all Bitcoin valuation metrics, until a tangible roadmap to quantum proofing Bitcoin is agreed amongst key Bitcoin Core developers and industry leaders, with a proposed working code upgrade. Quantum will continue to be a major headwind to Bitcoin until progress on upgrading is made. I remain optimistic that 2026 is the year this progress will happen, but expect continued volatility and headwinds until much more progress is made, such that it can be probabilistically priced in. You can learn more about this risk, our valuation approach and how the Capriole Fund navigates and manages this risk here.
- Today, much of the quantum risk is already priced in for Bitcoin. But risk of a quantum machine breaking Bitcoin’s cryptography is growing every day. Once we have measured traction on an implementation route, I think the risk inherent in Bitcoin related to Quantum will be substantially written off, and result in a mean reversion of price back up towards fair value.
Capriole AI
All of the above leads us to strongly agree with Capriole’s AI market view today. Capriole AI processes all of our content, newsletters, research papers, updates and metrics; including dozens of data points and statistics on each metric itself, to generate a holistic view on each market and asset every day and expected outlook over the coming 7-30 days. You can track Capriole AI live here.
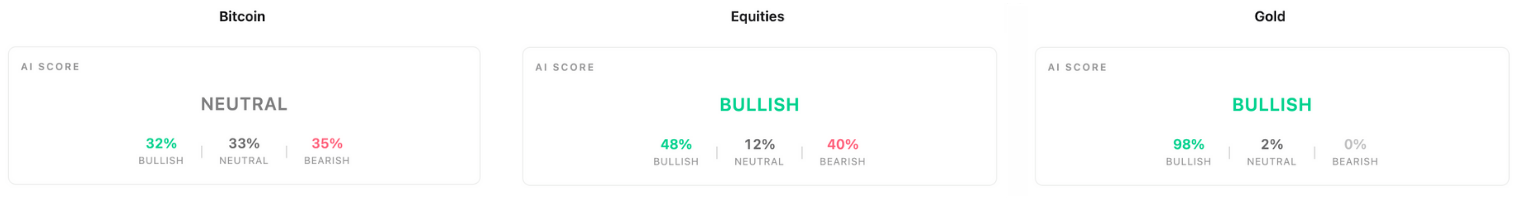
Capriole AI is neutral Bitcoin and bullish Equities with an incredibly rare and bullish score for Gold today.
Note this is the first version of our AI. It is not perfect but it is very good and improving every day. We have some significant enhancements and upgrades coming Q1 this year including time series LLM models and more. Watch this space! As our AI tech stack and strategy set at Capriole.com/Charts enhances, expect price rises accordingly to cover infrastructure and data costs, you can lock in an annual subscription with a 10% discount above.
Equities & Gold
The outlook for equities and Gold remains very strong. Both continue to press new all time highs. As they say, “don’t fight the trend”. Both exhibit strong technicals and underlying liquidity drivers (as discussed above for Bitcoin).
Gold in particular is in a very unique place. When Gold outperforms Equities, as it has the last 12-18 months, these relative periods of outperformance can last for many many years. We’ve seen this time and time again over the last 100 years. When Gold/equities is outperforming over 200 week moving average, you historically want to be very overweight Gold until that trend reverses. While it could reverse any month, it could also remain so for the next 8 years. You can track this metric live here. We also built an advanced trading strategy using this and more data called “Midas” here, backtested over the last 50 years of data, it shows less than half the drawdown of Gold and 10X the returns.
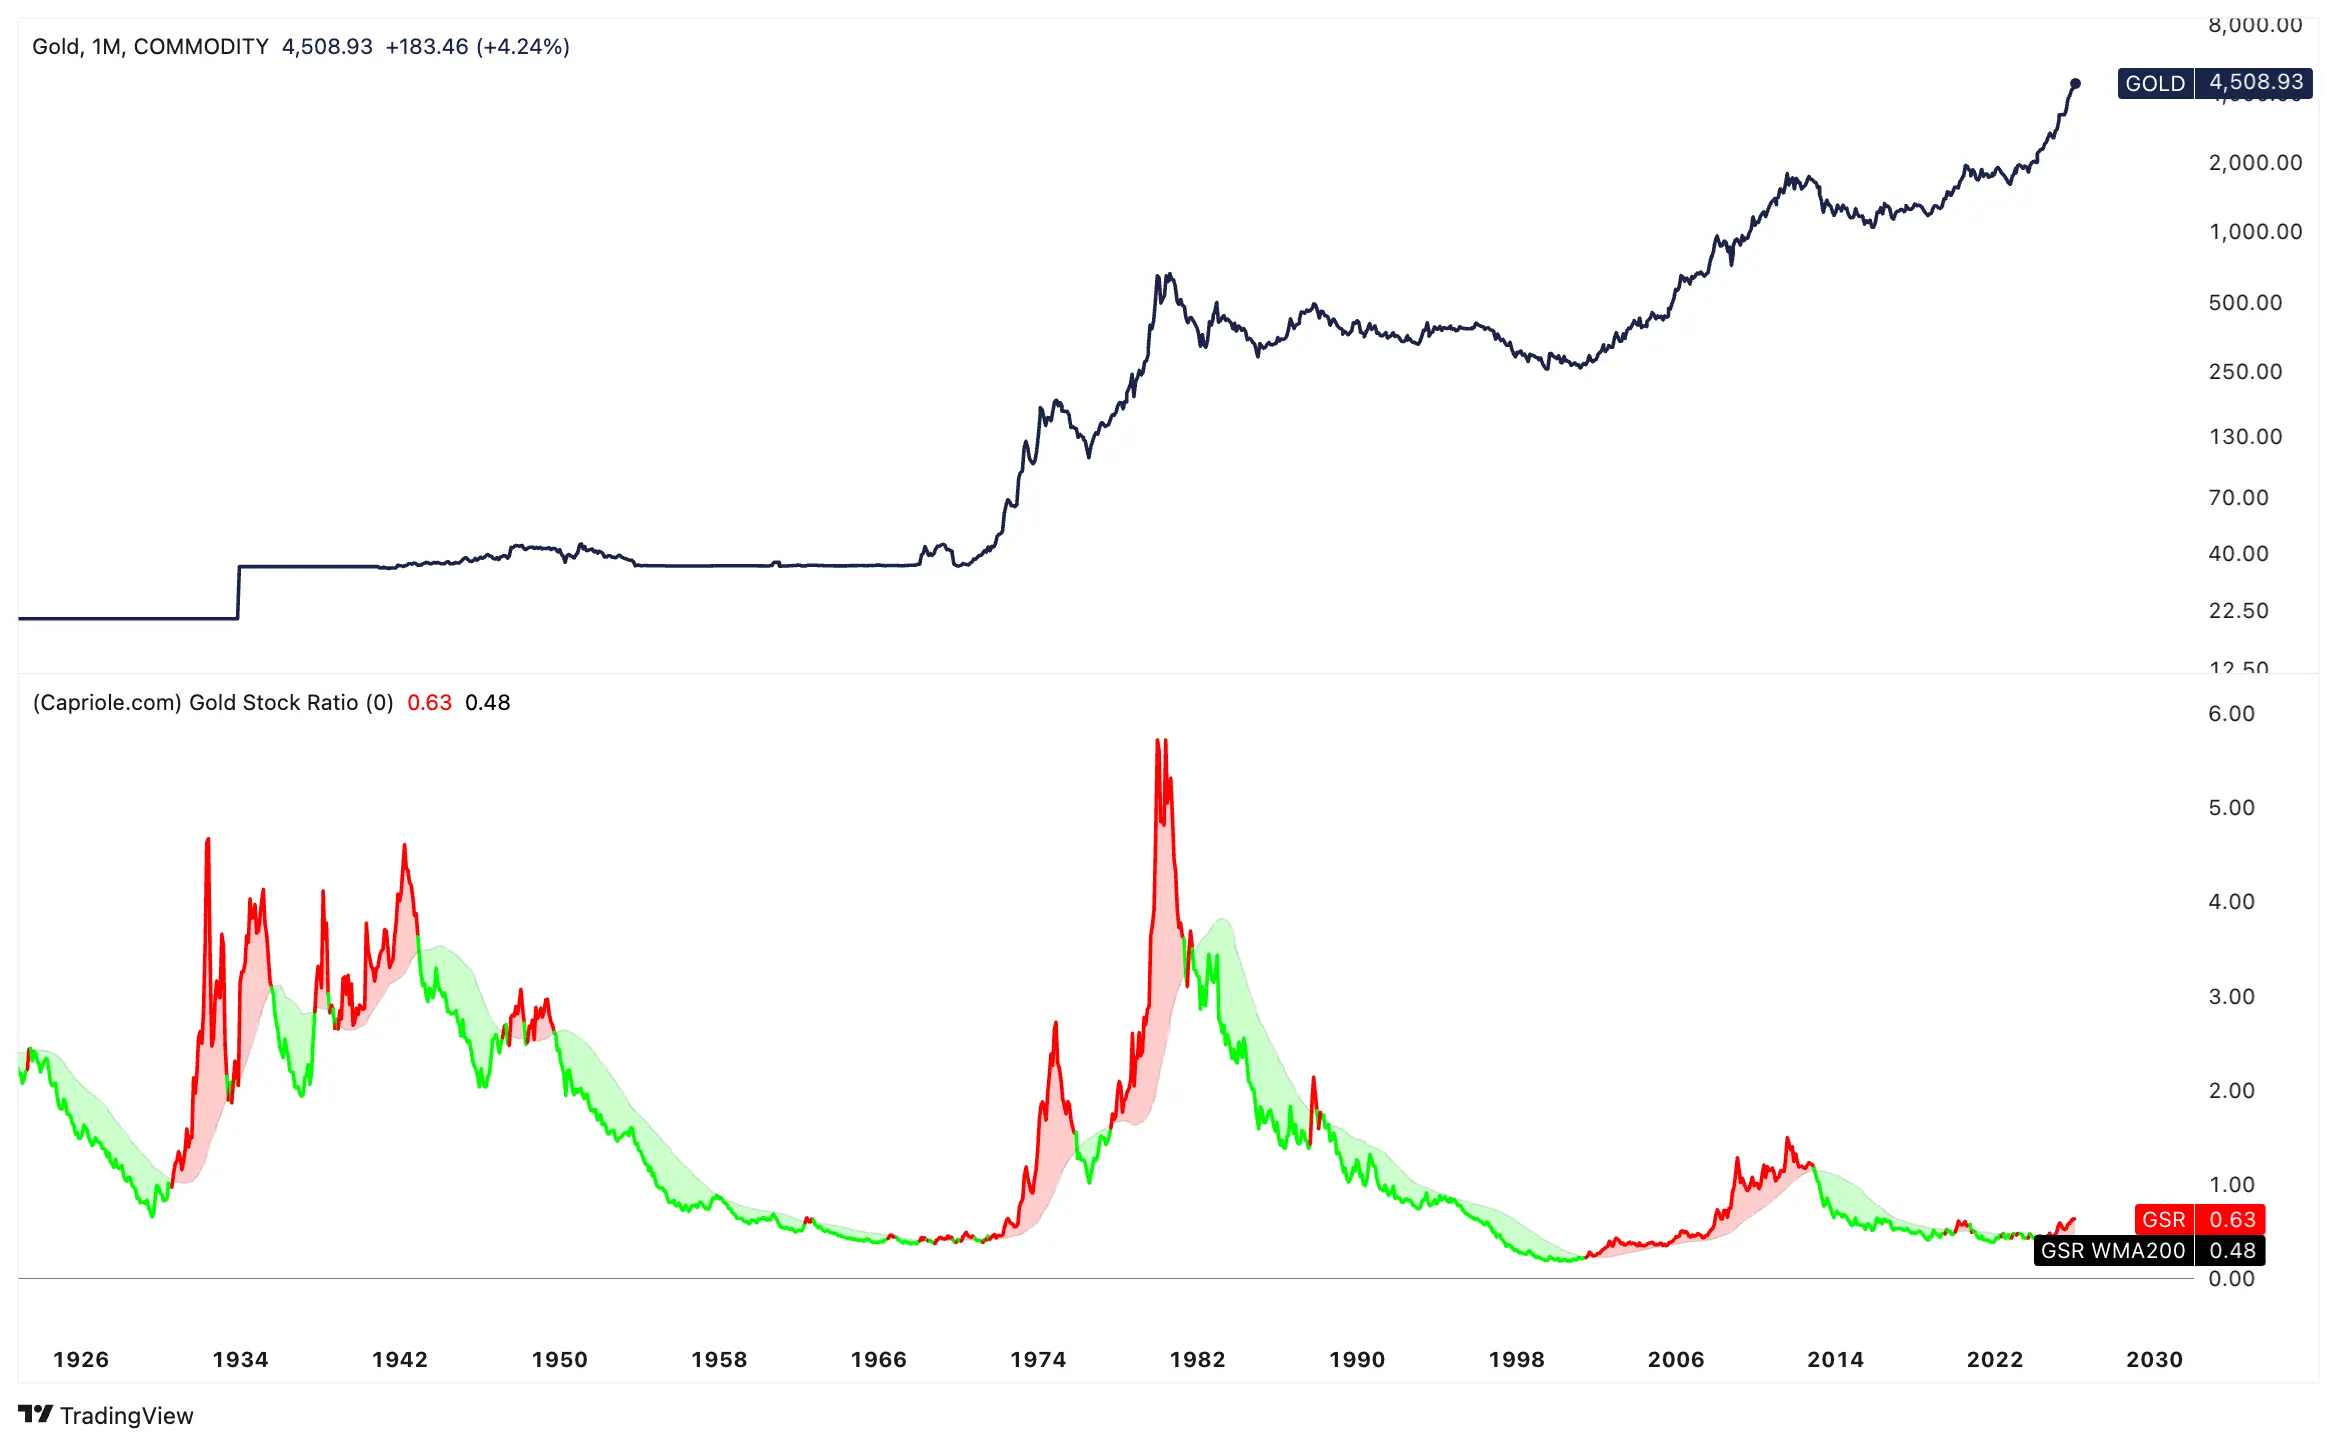
When Gold outperforms equities (red), it often lasts for between 4-10+ years. We are at 1.5 years today.
While both Equities and Gold look great today, there are factors that could derail the current rally, especially for Equities. 2026 has already started violently. The capture of Maduro, while viewed largely positively in Venezuela, has bolstered US military confidence and led to significant escalations with regards to a Greenland takeover and Iranian military action in the last 7 days alone. We are hopeful this is largely posturing and negotiation tactics which are used to persuade more passive action. The world certainly doesn’t need more military engagements which are lose-lose and give other countries reasons to engage. The fact we are even discussing this alone is a negative for markets which hate uncertainty. When it comes to an actual invasion, as in the past, they are actually usually bullish for US markets. As always we remain vigilant to changing data and conditions.
Bottom Line
We don’t think this is a Bitcoin cycle top in the traditional sense. We are open minded to a strong and positive year ahead for Bitcoin if one of the above 4 bullet points changes, that is: improved price action, deeper value, seller exhaustion or a real quantum proof roadmap. That could happen very soon, or not at all in 2026. We do think the mid-term outlook is volatility and chop until one of these points changes. Because of this, Bitcoin is unlikely to be the fastest horse in 2026. With significantly better opportunities out there that the Capriole Fund is dynamically positioned for, including Quantum Computing. However, the picture can change rapidly and it is important to dynamically position for the opportunities at hand as the data evolves. We do think that there will be incredible opportunities for Bitcoin again in the future and we remain agile and ready to spring at them when they appear.
Some sound Druckenmiller advice rings true for Bitcoin here as it enters the value zone with weak technicals:
“I never use valuation to time the market. I use liquidity considerations and technical analysis for timing. Valuation only tells me how far the market can go once a catalyst enters the picture to change the market direction.”
The trend for equities, Gold and Quantum is much more positive. We will write more about these and various other market opportunities in the future.

Charles Edwards
Recent Media
- Global Blockchain Show, Abu Dhabi: “The Quantum Threat” mainstage keynote (youtube)
Upcoming Conferences
Charles will be speaking at the following conferences this year
- Hong Kong: Consensus (10-12 February)
- Las Vegas: Bitcoin2026 Conference (26-30 April)
- NY: TBD (30 April – 1 May)
- Miami: Consensus (5-7 May)