Everything you need to know about yield curves

An analysis of 150-years of yield curve inversions and why they are a great forecasting tool.

In this article we will cover:

  • What a yield curve is
  • Why they have been great predicters of recessions
  • Why they have been even better predicters of stock market losses
  • Why we may have seen the bottom in the S&P500 in 2022
  • Why the US yield curve probably won’t matter very soon

What on earth is a yield curve?

Yield curve inversions have preceded every recession since 1956. You should understand them. The information in a yield curve is invaluable to the long-term investor.

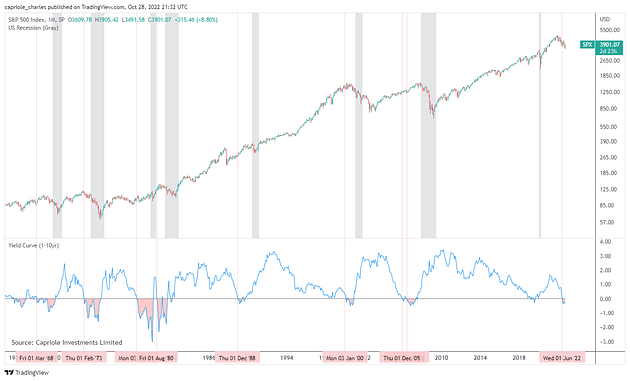
A yield curve is a plot of the difference between interest rates on government bonds with varying maturities (expiration dates).

For example, the 1–10 year US Treasury yield curve is calculated as the interest rate on the 10-year bond minus the interest rate on the 1-year bond.

Simple enough.

60 years of the 1–10 US Treasury yield curve vs S&P 500. The Red lines are yield curve inversions and the gray lines are official US recessions. Source: Capriole Investments (free indicator on TradingView)

Reading the tea leaves

Yield Curves normally “slope upwards” (common terminology for being greater than zero on the above chart). This means interest rates on long-term bonds are greater than interest rates on short-term bonds. This makes intuitive sense. Most people expect to earn higher interest if they are locking capital up in an investment for a longer period of time.

When the yield curve inverts, the 1-year rates are more than the 10-year rates which suggests something is wrong. At the late end of the business cycle, risk asset valuations (e.g. P/E multiples) rise substantially and the future expected returns on risk assets decays. Risk assets therefore become riskier and long-term bonds become relatively more attractive. Bond buying demand raises bond prices, and in turn reduces their yield (the interest rates earnt until maturity). At this point, there is general concern about the health of the economy, and investors expect short-term rates will have to come down to support investment in risk assets and general economic growth. This is exactly where we are in 2022.

A leading indicator of recession

The 1–10 yield curve has inverted before every recession since 1955, with a recession following on average 23 months later (15 months if you exclude the outliers in the 1980s).

However, an inversion doesn’t mean that markets immediately go down. As shown below on the 2–10 yield curve, double digit returns are not uncommon in the 6–12 months following a 2–10 inversion event.

2–10 US Treasury yield curve inversions usually see equities rally for up to a year, followed by a larger move down. Source: Capriole Investments

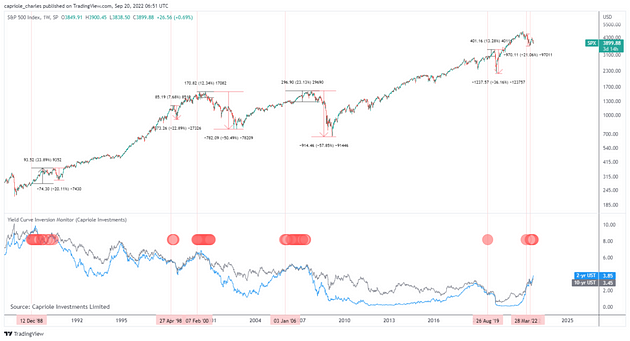
This is exactly why it’s important to understand the long-term statistics behind whichever yield curve you choose to use. The 1–10 and 2–10 are both great. The following stats should help.

What are the implications of a yield curve inversion?

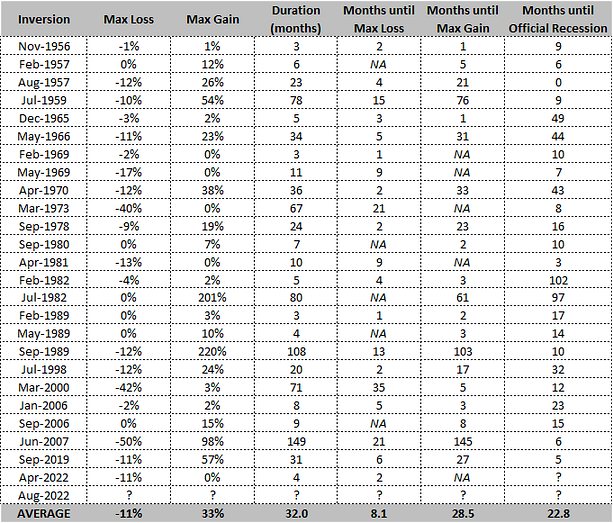
We analyzed all 1–10 yield curve inversions for the last century.

Of these 25 inversions, we looked at the the maximum loss (downdraw) and maximum gain (return) of the S&P 500 from each yield curve inversion, to its next yield curve inversion. All data was assessed on a monthly basis. The stats are summarized in the below table.

Yield curve inversions are a good forecaster for negative S&P 500 returns. The maximum loss occurs on average 8 months later, a recession occurs on average 23 months later and the maximum gain follows at month 28.

1–10 year US Treasury yield curve inversion statistics. Source: Capriole Investments

What about the really long-term?

If we go back further than a century, the usefulness of the yield curve in predicting recessions and stock returns becomes a lot more ambiguous.

150 years of the 1–10 US Treasury yield curve. Source: Long-Term-Trends

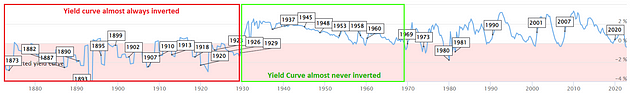
Out of the last 150 years, the 1–10 yield curve was effectively always inverted for the first 60 years from 1870 through 1930. In the following 40 years the opposite occurred and the yield curve almost never inverted.

What might explain this? There are a few factors to consider, including the consistent devaluation of the US Dollar, which culminated in the end of the Gold Standard in 1971.

The bigger factor is the reserve status of the US Dollar (USD). Since the 1920s, the USD has broadly been considered the reserve currency of the world. This just means it is held in large quantities globally and is the standard currency in most major international trade.

500-years of global empires and reserve asset statuses. The most powerful empire historically holds reserve currency status. Source: Ray Dalio

The timing of the US empires rise to dominance, and the USD reserve currency status, bares an interesting relationship with the US yield curve. Once the USD achieved reserve status, it held perceived long-term value. From that point, the yield curve spent most of its time above zero.

Once the US Dollar achieved reserve currency status, the yield curve was mostly positive, with inversions being the outliers.

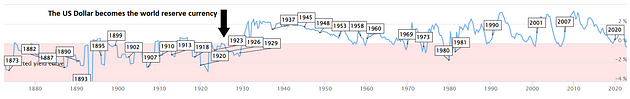
Before the USD achieved reserve status, the yield curve was mostly inverted. This is likely a reflection of the market having less faith in the USD and the economic situation in the US prior to the 1920s and pricing this into bonds.

While this long distant, historic data may not seem relevant today consider that:

  1. yield curve inversions signal roughly every three years and therefore have very limited data points to assess. This makes more historical data relevant to consider.
  2. empires, and reserve currency status, typically only lasts 80–100 years. The timing and data suggests that the US is at high risk of losing both these statuses today (you can read more about that in Dalio’s book).

With each subsequent yield curve inversion from here onwards, and provided that US global dominance continues to decline, we should be open minded to the fact that yield curve inversions may become more persistent and may not be as useful for forecasting as they once were.

Yield curves hold less information on weaker currencies and declining empires. Further, the USD is not just at risk from competing global empires like China and India, but also from alternative hard currencies; like Bitcoin.

Summary

When Yield curves invert, it makes sense to be on high-alert. It may be wise to reduce risk asset allocations, or at least manage risk more closely. Remember that a holistic strategy should consider multiple datapoints, not just bond data. Whatever your individual system is, yield curve data adds a valid confluence point to consider.

As of writing, the maximum loss on the S&P 500 is -15.8% since the 1–10 yield curve inversion in August 2022, with a peak-to-trough downdraw of -27%. This loss is more than the 100-year average (-11%). This suggests we may have seen the bottom in stocks for this inversion cycle already, leaving us with a positive skew in risk-reward outcomes for the next 2 years from here. Nonetheless, given only 3 months have elapsed since the inversion we should be openminded to a variety of outcomes over the next year.

Finally, be on the look out for emerging powers and competition to the US Dollar over the coming decade. Declining USD relevance would suggest lessened value in monitoring US yield curves going forward.

Disclaimer on Backtests

Any Backtest performance returns presented represent hypothetical returns and are meant to simulate how a strategy would have performed during the period shown had the strategy been implemented during that time. Backtested/simulated performance returns are hypothetical and do not reflect trading in actual accounts. Backtest returns are provided for informational purposes only to indicate historical performance had the strategy been implemented over the relevant time period. Backtested performance results have inherent limitations as to their relevance and use. One of the limitations of hypothetical performance results is that they are generally prepared with the benefit of hindsight. In addition, hypothetical trading does not involve financial risk, and no hypothetical trading record can completely account for the impact of financial risk in actual trading, such as the ability to withstand losses or to adhere to a particular trading program in spite of trading losses, all of which can also adversely affect actual trading results. There are numerous other factors related to the markets in general and to the implementation of any specific trading program which cannot be fully accounted for in the preparation of hypothetical performance results, all of which can adversely affect actual trading results. Any and all of these factors mean that no representation is being made that strategies presented here will achieve performance similar to that shown, and in any case, past performance is no guarantee of future performance.

The Capriole Fund

The Capriole Fund has one goal: outperform Bitcoin.

We are open to professional investors, but the fund has limited spaces.

Share the Post:

Leave a Reply

Your email address will not be published. Required fields are marked *

Disclaimer

The information contained here is provided to you solely for informational purposes only. Opinions and projections included are provided as of the date of publication, may prove to be inaccurate, and are subject to change without notice. This information does not constitute an offering. Prospective investors should not treat these materials as advice regarding legal, tax, or investment matters. No recommendations are made to invest in Capriole Investments Limited nor any other investment. An offering may be made only by delivery of a confidential offering memorandum to appropriate investors. Past performance is no guarantee of future results. Investing in digital assets in general involves risk. Digital asset risks include, but are not limited to, exchange risk, legal risk, hacking risk, market risk, liquidity risk, trading risk and default risk. As with any investment, investing in digital assets could result in loss of investment. Additional digital asset risks are outlined at www.capriole.com/legal. Decisions or actions based on the information provided are at the reader’s own account and risk.

Related Posts

Update #49

A dive on the forth Bitcoin Halving, Runes, Onchain valuations and macroeconomic...

Charles Edwards

Update #48

Welcome to Bitcoin price discovery, it's been a long time coming. With...

Charles Edwards

Update #47

The era of deep value is over. Bitcoin is fairly valued for...

Charles Edwards

Update #46

With the big Fidelity news, Bitcoin is finally being acknowledged in traditional...

Charles Edwards

Update #45

The brand names of these two behemoths in the traditional asset space...

Charles Edwards

Update #44

Today's Bitcoin ETF launch was the most successful launch in history and...

Charles Edwards

Update #43

ETF fever is coming to a head with approvals expected within the...

Charles Edwards

Update #42

Two major and positive events just unfolded in the Bitcoin space. According...

Charles Edwards

Update #41

Bitcoin is heating up, in both opportunity and across derivatives markets. And...

Charles Edwards

Issue #40

A new major trend has formed. We now have the biggest asset...

Charles Edwards

Issue #39

We have historically rare risk-asset signals appearing, amidst a period of Bitcoin's...

Charles Edwards

Issue #38

The last week has seen the biggest improvements across Bitcoin technicals and...

Charles Edwards

Issue #37

Bitcoin is pricing as a better-and-better inflation hedge. It is rapidly skewing...

Charles Edwards

Issue #36

The Fed is Building a War Chest. A macroeconomic deep dive to...

Charles Edwards

Issue #35

We are seeing some promising and rare structures form on Bitcoin which...

Charles Edwards

Issue #34

All else equal, Bitcoin is like a beach ball submerged underwater. Nonetheless,...

Charles Edwards

Issue #33

Last update technicals and fundamentals told us to be cautious with Bitcoin....

Charles Edwards

The Three Factor Model

90% of the S&P500 returns over the last half century can be...

Charles Edwards

Issue #32

Welcome to Capriole’s micro update #1. Where we consolidate the most important...

Charles Edwards

Issue #31

At $29K, Bitcoin’s on-chain fundamentals are not too hot and not too...

Charles Edwards

Issue #30

The failures of the Federal Reserve in managing the value of money...

Charles Edwards

Issue #29

This newsletter explores a taboo topic. The idea of the impossible, a...

Charles Edwards

Issue #28

Bitcoin’s deep value is slipping away and in its place a new...

Charles Edwards

Issue #27

We believe the 2020s will be the decade of hard money, much...

Charles Edwards

Why markets are not as overvalued as you might think.

Charles Edwards

Issue #26

The crypto world was shaken to the core in November as top...

Charles Edwards

Bitcoin Miner Sell Pressure

Charles Edwards

The Bitcoin Yardstick

Charles Edwards

Issue #25

We crack open the rarest of Bitcoin value metric readings you can...

Charles Edwards

Everything you need to know about yield curves

Charles Edwards

Issue #24

This month we deep dive into the macro and make the case...

Charles Edwards

SLRV Ribbons

Charles Edwards

Issue #23

Fear struck the market again with a blunt Fed speech. The broader...

Charles Edwards

Issue #22

This issue we deep dive into the many Bitcoin and macro metrics...

Charles Edwards

Issue #21

Today, we now find ourselves in a special juncture in the crypto...

Charles Edwards

The Digital Asset Thesis

Charles Edwards

The Capriole Macro Index

Charles Edwards

Issue #20

The S&P500 and Bitcoin showcased a strong recovery recently and today both...

Charles Edwards

Issue #19

Traditional markets have been taking a beating. Our February Newsletter and analysis...

Charles Edwards

Issue #18

The first quarter of 2022 is coming to a close. War in...

Ryan McCoy

Issue #17

For the past few months, Bitcoin has been driven by macro events...

Yassine Zrigui

Issue #16

Last month was mostly dominated by macro news much like December, namely...

Mick Herfkens

Capriole’s 2022 Market Outlook

A year ago, we published our “Christmas Special” newsletter. We wrote the...

Charles Edwards

Issue #15

If you have been around the cryptospace long enough, you have probably...

Ryan McCoy

Issue #14

Bitcoin started the month of November strong with a new all time...

Mick Herfkens

Issue #13

Bitcoin is up over 30% to date in October, reaching as high...

Charles Edwards

A Simple Metric to Identify Bitcoin Tops

Charles Edwards

Issue #12

Last issue, at $47K we noted some concerning metrics, but noted the...

Charles Edwards

Issue #11

Last issue we noted the improving fundamentals for Bitcoin following...

Charles Edwards

Issue #10

Last issue we reviewed the China’s crypto exodus and argued why we...

Charles Edwards

Issue #9

These are unprecedented times. The Bitcoin network has just experienced the biggest...

Charles Edwards

Issue #8

Bitcoin is trading at more than 40% below the all-time high for...

Jan Uytenhout

Issue #7

Every month we write a short update on the market. We try...

Charles Edwards

Issue #6

Every month we write a short update on the market. Last issue,...

Jan Uytenhout

Issue #5

Every month we write a short update on the market. We try...

Charles Edwards

Issue #4

Every month we write a short update on the market. We try...

Jan Uytenhout

Issue #3

Every month we write a short update on the market. We try...

Charles Edwards

Issue #2

We try to release our newsletters when we see key opportunities. Today...

Jan Uytenhout

What is Money?

Charles Edwards

Issue #1

This newsletter provides our airplane view of the Bitcoin market. It summarises...

Charles Edwards

The Energy Standard

Charles Edwards

Bitcoin Energy-Value Equivalence

Charles Edwards

Bitcoin’s Production Cost

Charles Edwards

Hash Ribbons & Bitcoin Bottoms

Charles Edwards

Metcalfe’s Law Says Bitcoin is Overvalued

Charles Edwards

Bitcoin Valuation using Dynamic Range NVT Signal

Charles Edwards

The Next Resession

Charles Edwards

Bitcoin Bottom Fishing with Miner Capitulation

Charles Edwards