

A Real-Time Recession Indicator to warn you when the next recession is coming and why it might be less than 2 years away.
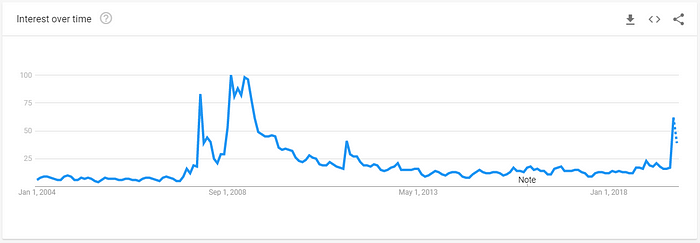
Recession is coming. That’s what all the talk seems to be about in business news lately. In fact, google searches for “recession” spiked to their highest level since the 2008/2009 financial crisis in August this year. Interestingly, Google searches had a similar spike immediately before the brunt of the 2008 financial crisis hit. Had Google Trends been followed, it would have been a great time to exit long positions in risky assets, before the S&P 500 halved in value over the following 12 months. Could the August 2019 interest in recessions be another leading indicator? Maybe. Is it reliable? No.
So how do we know if a recession is on the horizon? In September 2019, is a meltdown imminent? Should you sell your stocks? This article seeks to answer some of these questions and provides a real-time recession watch indicator — check it (here) at any time to see what the risk is of a coming bust.
What is a recession?
A common rule of thumb in the financial world for defining a recession is:
“Two consecutive quarters of decline in real GDP.”
But unfortunately, it’s not that straightforward. The National Bureau of Economic Research (NBER), the US body that officially determines when a recession starts and ends, defines a recession as:
“A significant decline in activity spread across the economy, lasting more than a few months, visible in industrial production, employment, real income, and wholesale-retail sales. A recession begins just after the economy reaches a peak of activity and ends as the economy reaches its trough.”
So what do we make of that?
Well, the average S&P 500 draw-down (the percentage loss from peak-to-trough) for all seven recessions in the last 50 years was -38%.
This is precisely the loss of value that all investors want to avoid.
However, the NBER cannot be relied on to give advance warning of recessions. Over the last 50 years, the official starting date of each recession was on average 135 days after the S&P 500 had already peaked and started to collapse. According to the Morgan Stanley 2019 “Recession Playbook”, the NBER announcements would have actually been better “buy” signals:
“On average, since 1980, by the time a recession is officially confirmed, the slowdown is already roughly 70% passed … US equities tend to reclaim losses after the NBER declares a recession has begun.”
In summary, there is no clear-cut definition of a recession. They do have substantial declines in economic activity, are often reported late and -40% stock market losses can be expected.
What causes a recession
For an overview on economic cycles and the causes of recessions, Ray Dalio’s writings, and 30-minute YouTube video “How the economic machine works”, are excellent.
The 60 second summary is as follows:
The business cycle, and correspondingly the peaks-and-troughs in the stock market, are intrinsically linked to the credit cycle:
- The Boom
When there is plenty of “cash” in the system (credit is easy to get, interest rates are low, or money is being printed), businesses can be created and expanded. Jobs are easy to fund and abundant. High employment and cheap credit results in greater consumer spending and growing company profits. Times are good!
- The Bust
However, when cash availability tightens (credit is harder to get, interest rates are high, or the overall debt burdens just become too much), banks lend less and business investment reduces. Unemployment rises and consumer spending decreases. This results in reduced manufacturing, sales, corporate profits and therefore asset valuations. The market cycle peak is in. Enter the nasty “R” word.
It’s a self-fulfilling cycle. Once a recession is in, interest rates are cut and money is printed (“quantitative easing”), resulting in easier cash and we re-enter the boom phase.

Timing a Recession
Over the last 50 years, Recessions have occurred every six years on average. Today it has been 10.3 years since the last recession ended.
We are currently in the longest recession free period in over 150 years.
Interestingly, the economy is stabilizing with time. The average time between recessions is consistently expanding, while the S&P500 drops (so far) remain fairly consistent.
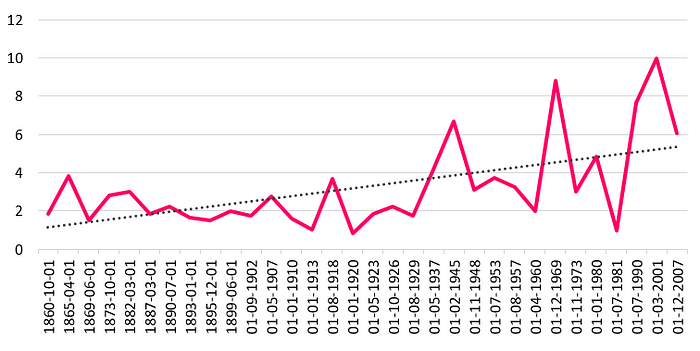
So the time between recessions is expanding. But in a credit driven world, we know the next recession is somewhere around the corner.
How do we beat the NBER, and run for safe assets near stock market peaks?
The Ingredients of a Recession
We have already identified the key ingredients of market tops above. By observing where negative economic metrics occur within the same period, we can bake a nasty cake. These economic metrics often precede recessions when they present themselves as follows:
1. Cash availability in the current cycle is peaking
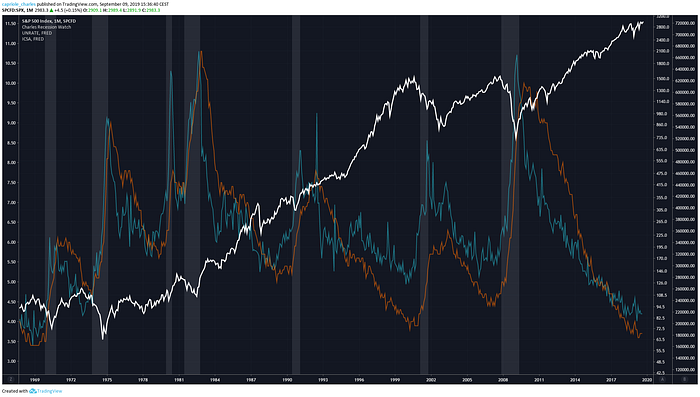
If you have looked at the business news this year, you have probably heard of Yield Curves. When they ‘invert’ long-term bonds have a lower interest rate than short-term bonds. In other words, the bond market is pricing in a significant drop in future interest rates (which might be caused by the US Fed fighting off a recession in the future).
[Yellow: Yield Curve Inversion, Grey: NBER Recession Periods]
In the last 50 years, every time the US treasury yield curve inverted a recession followed within 3 years. On average the S&P500 gained 19.1% following the inversion and peaked 13 months later. In other words, as far as investors are concerned, the recession began roughly one year later.
However, once the market peaks, it then drops 37.6% on average, wiping out all those gains and more.
Assuming you can time the market peak perfectly, there is a lot of money to be had. However, be warned, the downside risk is a lot greater than the upside opportunity.
If you are a long-term “buy-and-hold” investor, with the yield curve having just inverted in August 2019, be prepared to ride a 3- to 5-year roller coaster of highs and lows. At the end, when you step off the ride, you can expect to have roughly the same equity value that you do today.
2. The Unemployment Rate has bottomed, and is starting to rise
When businesses need to cut costs, often the first to go are employees. At the late end of a business cycle unemployment is often low. But when unemployment starts to tick up, the “boom” phase is typically ending. As explained by Morgan Stanley:
“Once job growth goes negative and the unemployment rate rises, a recession is hard to avoid… The US consumer is roughly 70% of the economy, and the US cannot be in a recession without its participation.”
A number of metrics can be used to track changes in employment (including Non-Farm Payrolls), but this research finds the Unemployment Rate and Unemployment Initial Claims to be the best leading indicators of past recessions.
In September 2019, the Unemployment Rate of 3.7% may have already bottomed, but it is too early to be sure.
It is worth noting that, in the last 70 years, the Unemployment Rate has only been this low during two periods (prior to the 1953 and 1970 recessions). In both cases the S&P500 peaked 2 years later, and recession occurred within 3 years.
But the ensuing rally was significant.
From 3.7% unemployment, the S&P500 increased 24% and 29% respectively, before the recession hit.
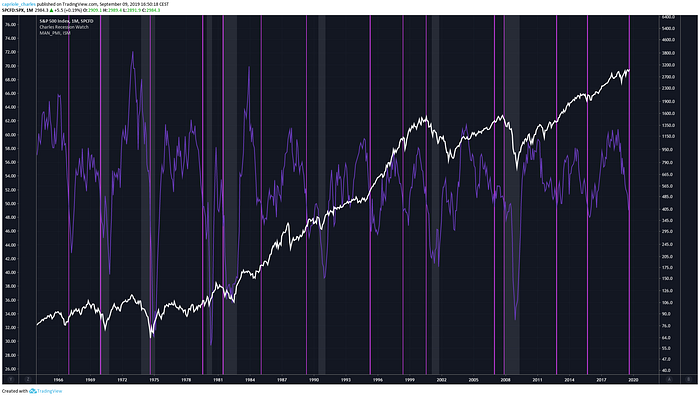
3. Manufacturing purchasing falls
The ISM Manufacturing PMI survey helps flag when business is starting to look sour. When manufacturing purchasing managers are buying fewer raw materials to fulfil orders, this metric drops and can therefore provide some early insights into consumer behaviour. A value dropping below 50 often precedes recessions, though this metric can misfire and conversely precede strong market rallies.
In the last 50 years, 50% of the time this indicator flagged, a recession followed within 18 months, and it just fired in August 2019.
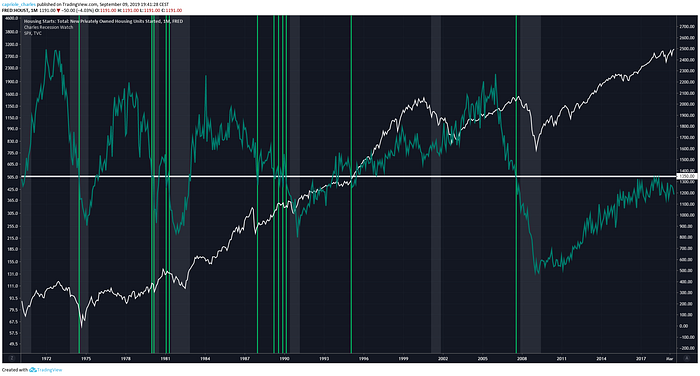
4. Housing Starts peak and are falling
Historically a fall below 1.35M housing starts per month has been a leading indicator for recession. Housing start drops preceded the 1980, 1981, 1990 and 2008 recessions.
Nonetheless, because the last recession centered on mortgages, housing starts have remained subdued. Over the last 10 years housing starts have not yet broken back above 1.35M per month and therefore are less likely to identify the next recession.
5. Corporate profits peak and are falling
It makes since that Corporate Profits start to fall in recessions. However, Corporate Profits have mixed results as a recession indicator. The metric can lag due to the quarterly intervals in which they are reported (the other metrics here are reported monthly or daily). In the last 70 years, approximately 40% of Corporate Profits drop offs have preceded recessions by a year or less.
Interestingly as of September 2019, Corporate Profits have been basically flat for the last seven years. Given the low interest environment over the same period, the inability for businesses to grow profits over that stretch is concerning.
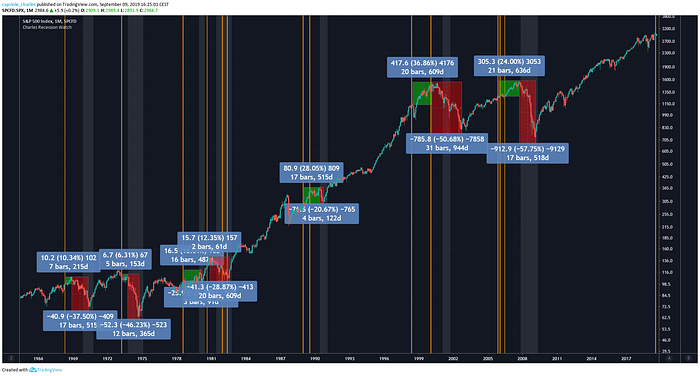
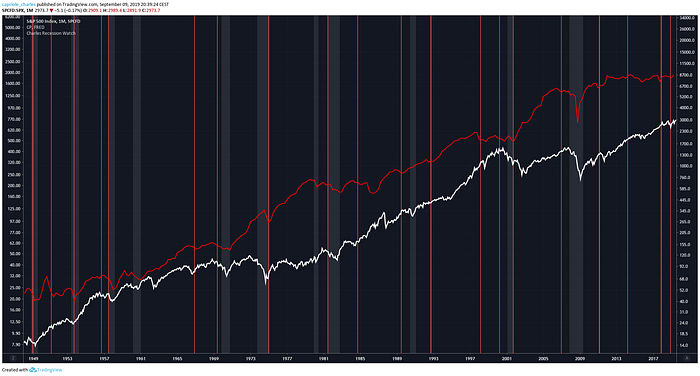
6. Stock prices have peaked and are falling
As far as the investor is concerned, the cycle ends when the markets peak. US recessions almost always follows a peak in the S&P500. A simple and reliable way to measure a S&P500 peak is using moving averages. When the 50-day moving average drops below the 200-day moving average a local peak is in.
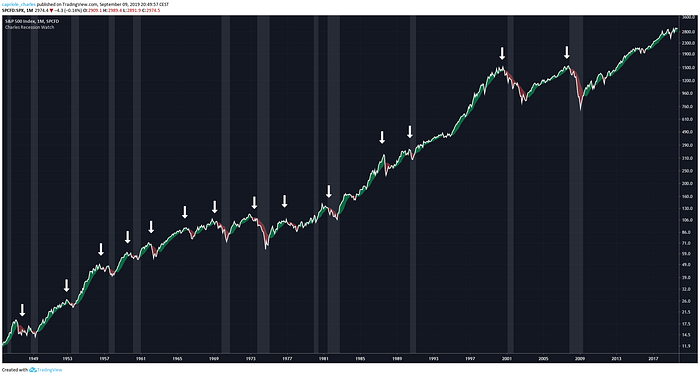
[Grey: NBER Recession Periods]
[Red: 50 MA < 200 MA = bear/recession flag, Green: 50MA > 200MA = bull flag]
Google Trends and Other Interesting Correlations
Unfortunately, with only one recession data point, we cannot draw any useful conclusions from Google Trends. In fact, there are many other interesting correlations to historical recessions, some more useful than others. Correlations were recently made with Copper (here), however Copper was not found to be meaningful leading indicators to recessions in this research.
It is likely that a number of other metrics will prove themselves in predicting recessions into the future, yet the predictive power of yield curve inversion and rising unemployment from a bottom will likely continue to age like a good bottle of red.
The Recession Watch Indicator
Well the above information is great, but when is the next recession?
It’s impossible to know for sure, new economic data comes out every day which can change the picture drastically. However, when multiple of the above metrics flag a potential recession at similar times (say within a year), the probability is undoubtedly higher.
The “Recession Watch” indicator (available here) tracks exactly that.
It combines all of the metrics in this article to provide a real-time indication of recession risk. The indicator gives a picture of when risk is increasing, and therefore when you might want to start de-risking your portfolio.
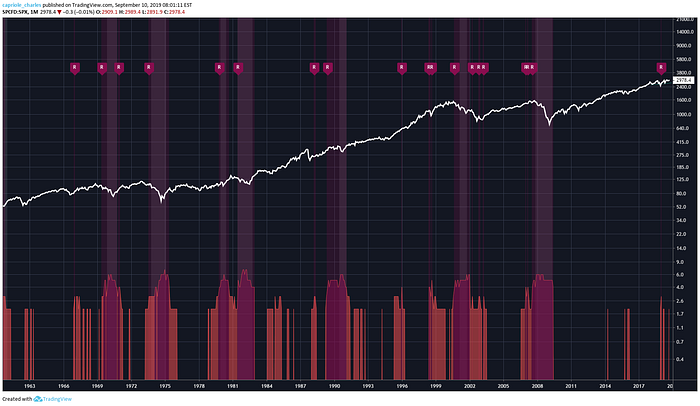
[Purple Bands: High Risk Recession Zones, Grey: Actual NBER Recession Periods]
The Indicator tracks a score from 0 to 7 for each of the above metrics (two for employment). All of the last seven recessions were preceded by a risk score of 3 or higher (the data prior to 1965 was inconsistent and could not be considered).
Based on the indicator, the current recession risk score is 2 out of 7.
The two metrics currently flagging are:
- Yield Curve inversion (August 2019)
- Cross down in Manufacturing Purchasing Survey (August 2019)
Based on the indicator’s monthly hit rate at successfully predicting recessions over the last 50 years, a score of 2 suggests there is a 18% chance of a recession in the next 12 months.
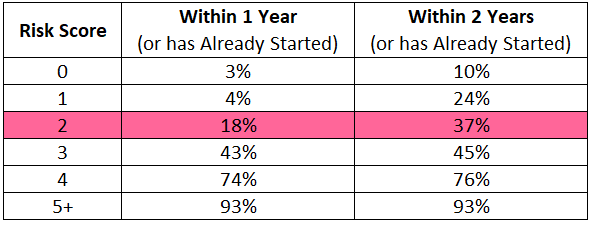
If the recession risk score jumps to 3 tomorrow, the probability of a recession in the next 12 months increases to a near coin toss. Should the risk score drop to 1 tomorrow, the probability of recession will drop substantially with it, to 4%.
Note that a score of 3 is not necessarily a cause for panic. After all, there are substantial rewards to be had in the lead up to recessions (averaging 19% following yield curve inversion, and 26.5% following 3.7% unemployment). For the brave, staying invested until the score jumps to 4+, or until the S&P500 drops below the 200-day MA, will yield the best returns.
Conclusion
Based on the Recession Watch Indicator:
The probability of recession is 18% over the next 12 months and 37% over the next 24 months.
Additionally, if the next recession is anything like those of the prior 50 years, stock markets will likely peak sometime within the next 2 years because:
- The yield curve has inverted. Recessions followed inversion in all prior cases within 3 years and the market peaked on average 1 year later.
- Unemployment is at 3.7%. The last two times it was this low, recession occurred within 3 years and the S&P500 peaked 2 years later.
- Manufacturing PMI just dropped below 50. In the last 50 years, 50% of the time this happened, a recession followed within 1.5 years.
However, none of this is certain. We can only observe the data as it becomes available. Remember, the above prediction of when a recession might occur does not really matter. All that matters is that today, the economic leading indicators are not screaming “recession”. Only when three or more of them are flagging danger should investors be wary.
The next critical warning sign to watch for will probably be rising unemployment. Or, you could simply check out the Recession Watch Indicator for free here. While this indicator won’t capture every macroeconomic element nor likely every future recession, it should provide more real-time clarity on the risk of incoming financial stress, allowing you to plan accordingly.
Disclaimer on Backtests
Any Backtest performance returns presented represent hypothetical returns and are meant to simulate how a strategy would have performed during the period shown had the strategy been implemented during that time. Backtested/simulated performance returns are hypothetical and do not reflect trading in actual accounts. Backtest returns are provided for informational purposes only to indicate historical performance had the strategy been implemented over the relevant time period. Backtested performance results have inherent limitations as to their relevance and use. One of the limitations of hypothetical performance results is that they are generally prepared with the benefit of hindsight. In addition, hypothetical trading does not involve financial risk, and no hypothetical trading record can completely account for the impact of financial risk in actual trading, such as the ability to withstand losses or to adhere to a particular trading program in spite of trading losses, all of which can also adversely affect actual trading results. There are numerous other factors related to the markets in general and to the implementation of any specific trading program which cannot be fully accounted for in the preparation of hypothetical performance results, all of which can adversely affect actual trading results. Any and all of these factors mean that no representation is being made that strategies presented here will achieve performance similar to that shown, and in any case, past performance is no guarantee of future performance.