

A snapshot of the Guardian risk report (image updated, 30 May 2025)
Article originally published at Capriole.com/Guardian in January 2024.
➡️ Track Guardian risk report and metrics in real-time at Capriole.com/Charts
Why monitor exchange risk
Capriole’s Guardian Risk Manager tracks on-chain exchange risk by monitoring exchange reserves, inflows, outflows, trading volume and open interest in real-time. This article summarizes the Guardian risk management system that has allowed the Capriole Fund to avoid all exchange and platform risk events since our inception. In the last 4 years our industry has seen numerous platform collapse including FTX, Luna, BlockFi, Genesis, Celsius, Voyager and many more. The Capriole Fund has not lost a single dollar from custodian risk; despite actively trading across many desks, including FTX.
If you trade or invest in Bitcoin and other cryptocurrencies, there is no way around avoiding exchanges. The most active, liquid and cost-effective markets are the top tier crypto exchanges, including some of the well known names above. These exchanges are the gateways to crypto investing. This asset class’ short history is littered with exchange hacks, collapses and frauds. Including the infamous MtGox hack in 2014 (which accounted for 70% of the world’s trading at the time) and the multi-billon-dollar FTX fraud in 2022 (which affected millions of users).
A number of creative solutions exist today to try and mitigate counterparty exchange risk; including:
- Using decentralized exchanges and self-custodying your assets
- OTC desks, and
- other ‘off-exchange’ custodians that allow trading on exchange without a direct deposit.
Each have their pros and cons. However, when the finer details are examined, the vast majority of the alternatives do not offer the protection you think you may be getting and often come with the sacrifice of liquidity and expense.
Numerous decentralized exchanges have failed from exploits, as have the wallets that interact with those exchanges. As recently as December 2023, arguably the industry’s most trusted cold storage wallet, Ledger, was subject to a supply chain hack. OTC desks offer a variety of solutions, but all of them are trading on the above exchanges under the hood, transferring and obscuring risk. Off-exchange custodians can be viable solutions for entities (they require a hefty financial investment); but many of these also introduce concerning risks including:
- Reliance on multiple 3rd parties for settling positions who have keys to, and can move, your assets
- Dubious legal contracts which in the fine print rehypothecate your assets, should major risk events occur
- Sketchy organization structures, and
- high costs of trading.
There is a good case to keep most of your assets off-exchange, ideally in secure cold storage and even better, with a multi-signature wallet. Using some combination of the above solutions may be a the best fit for you. But crypto exchanges are not going anywhere, and there is no doubt you will be interacting with them if you invest in digital assets.
So how can we actively manage risk when we are trading on exchanges?
Well it turns out on-chain data offers a powerful solution; the ability to see and scientifically dissect transactions via on-chain analytics is one of the greatest benefits of this asset class and it can help you protect your capital from bad actors and hacking risk. The Capriole Fund is the living breathing proof of that.
Interpretation
Let’s breakdown some of the key metrics above, what they mean, and how they are used to avoid major risk events and trading altogether on undesirable venues. We will focus heavily on the data in the months prior to the FTX collapse on 8 November 2022 as a case study.
No singular metric is a silver bullet. Capriole focuses on a suite of metrics all with graduated risk thresholds which collate to generate the net exchange “Risk Status” traffic light above. We also have automated alerts, notifications and robot generated phone calls to our management team when thresholds are breached in real-time, 24/7/365.
Reserves 7 Day Drawdown
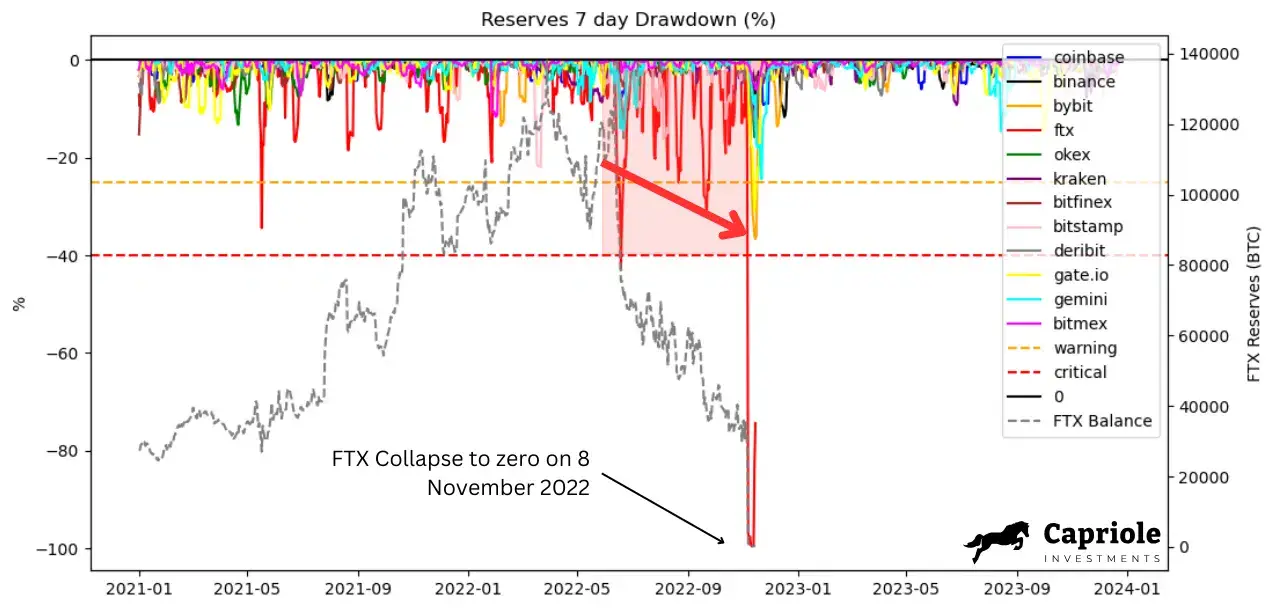
The Reserves 7 day Drawdown metric shows us how an exchange’s reserves (client capital on their platform) has declined over the last 7 days. This metric naturally ebbs-and-flows as customers deposit and withdraw capital from a platform. As you can see in the above chart, small declines from withdrawals are common (the top 0-10% region) and all of the Tier one exchanges (except FTX, the red line) see their Reserves 7 day Drawdown return to zero typically within a matter of weeks.
FTX has had the most challenges with their reserves from day one. This became particularly apparent from June 2022 when their total Bitcoin reserves collapsed from 120,000 to 0 over the following 5 months (gray dashed line above). As the world would find out a few months later, this was because FTX was taking billions of dollars of their user’s assets, selling and using them to fund their various VC investments, the purchase of the Miami Heat arena, Democratic party donations and their flailing trading firm Alameda Research.
We can see on the above chart that there were many weeks (over half a dozen) where FTX’s reserves declined by over 20% and up to and over 40% in the months prior to their collapse on 8 November 2022. All of this became very visible on-chain from mid-2022.
Reserves 30 Day Drawdown
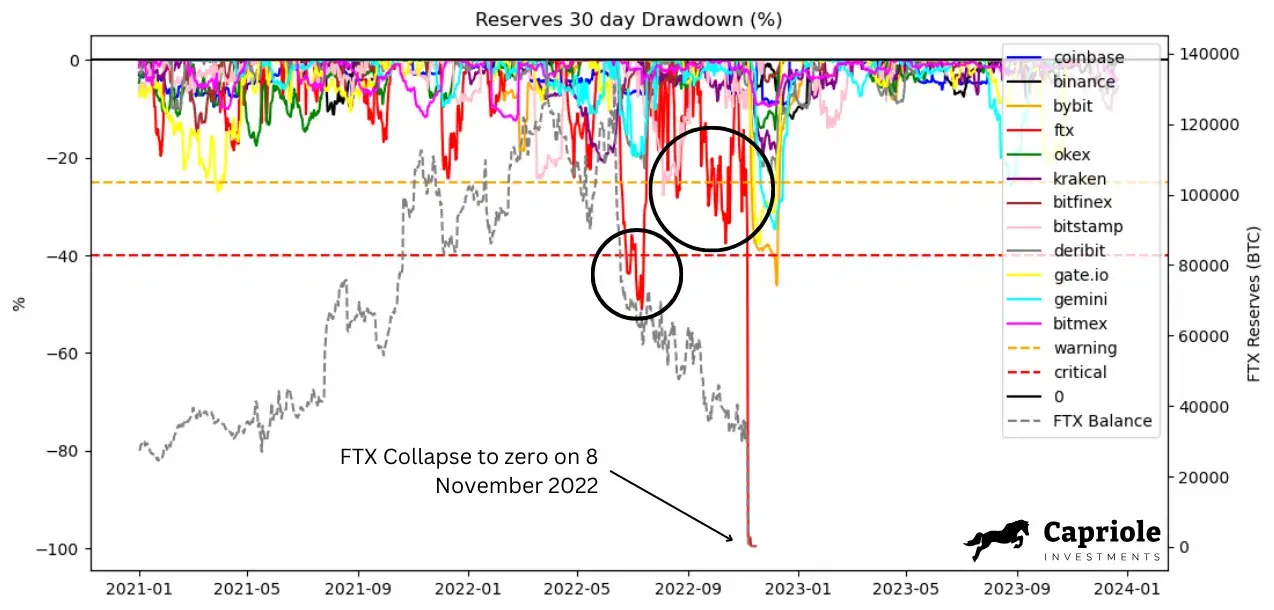
Similar to the prior metric, using a longer window one month rolling change in reserves can help to filter out some potential noise and also highlights more prolonged and systemic risks. The issues at FTX are more pronounced on the Reserves 30 Day Drawdown chart above, and we also see some other major exchanges enter periods of elevated risk, including Bybit in December 2022.
In the months of June and October 2022, we can see very concerning levels of risk at FTX which should have prompted close examination, well in advance of the eventual collapse on 8 November 2022.
Volume-Reserve Ratio (VRR) Score
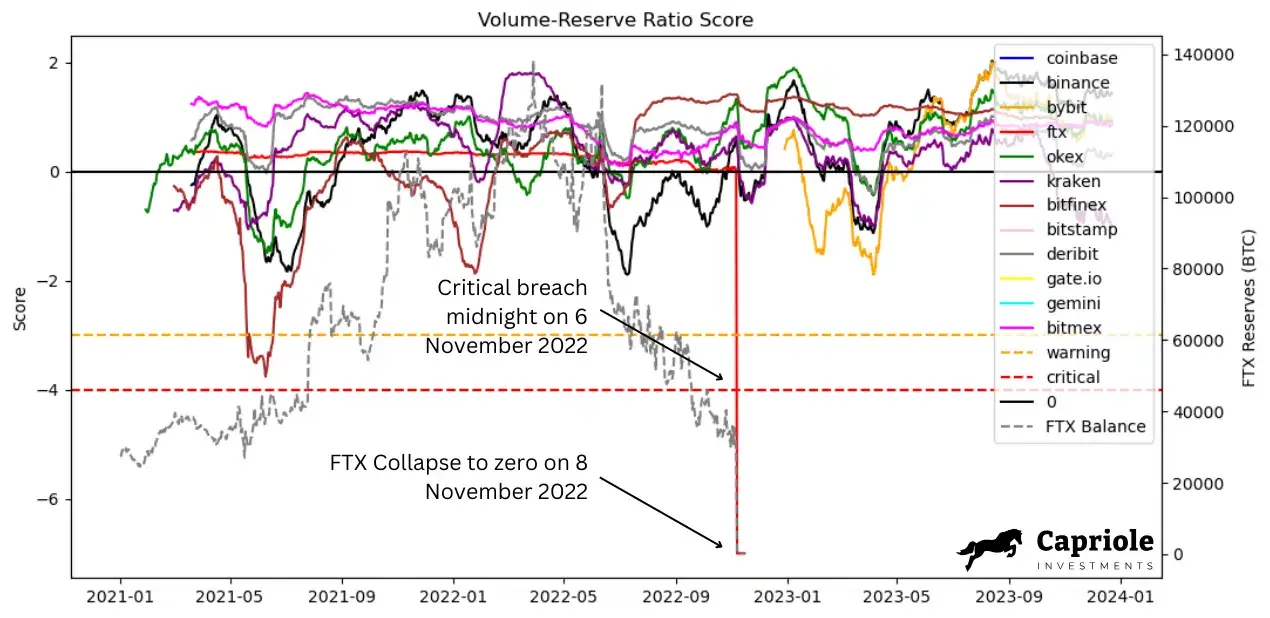
This metric takes the ratio of exchange volume to reserves, to provide a more relative measure of risk for that platform. These ratios vary widely as every platform offers different products, some with no leverage trading, some with a lot. So we normalize this metric to create the VRR Score shown above. Anything below -3 (3 standard deviations from the mean) generates a warning, and anything below -4 is a critical reading.
On this metric, BitFinex and FTX both have periods of elevated risk. With FTX hitting a critical ratio at midnight on 6 November 2022; approximately 48 hours before the exchange’s withdrawals stopped.
OI-Reserve Ratio (ORR) Score
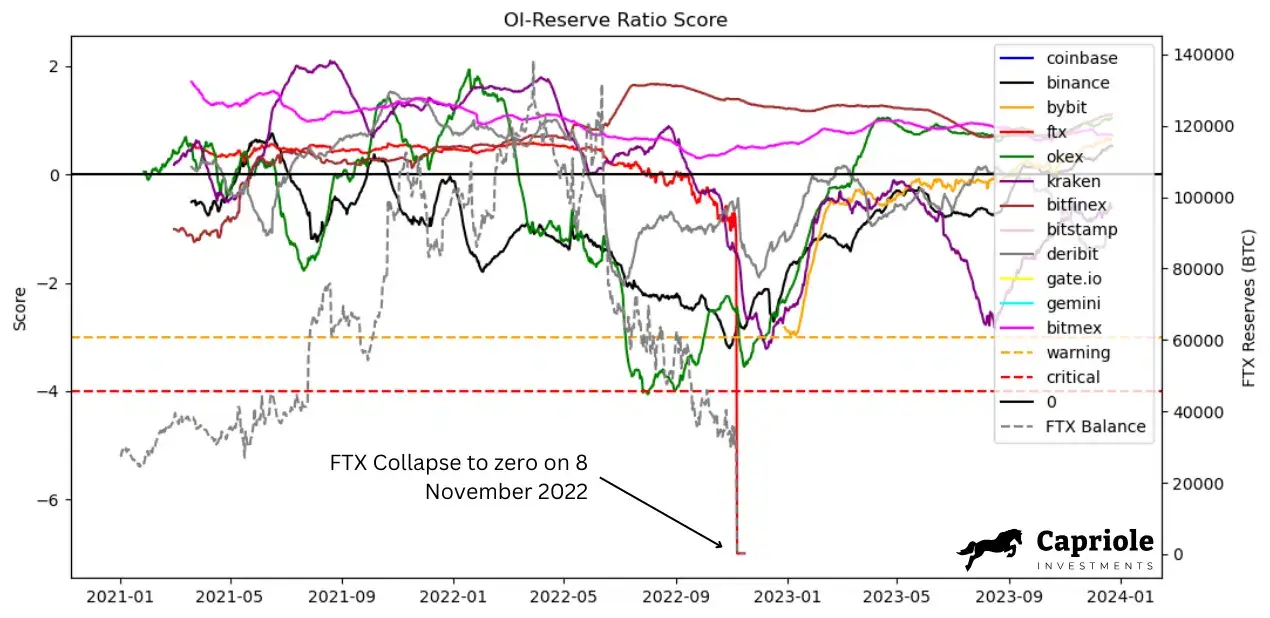
For derivatives exchanges, the Open Interest Reserve Ratio Score can be a more useful gauge of net open positions and obligations, than volume in the prior VRR chart.
In this chart we can see FTX, Binance, Bybit and OKEX have all had significant drops in the past. We can also see significant drops in the two months following the FTX collapse. When the FTX collapse became public knowledge on 8 November 2022, fear spread all over social media and prompted users to pull assets from exchanges broadly. This concern was largely abated by March 2023.
Risk Status
We track a variety of thresholds for each metric above, and they fed into the net exchange Risk Status traffic light score shown in the above table.
The “Risk Status” can be interpreted as follows:
- Normal Risk (Green): no action required.
- Warning Risk (Orange): caused by metrics exceeding normal thresholds warranting close monitoring and assessment of your asset custody.
- Critical Risk (Red): caused by metrics exceeding their critical thresholds, which warrants urgent investigation and securing of assets.
Putting it all together
The above charts and metrics are an example of the data we monitor at Capriole Investments. On-chain data offers a unique and highly insightful way to manage risk within the crypto ecosystem which does not exist in any other industry. We have found this data to be invaluable for risk management, investment strategy management, valuation and outperformance.
Exchange on-chain analytics requires detailed labelling of exchange wallet addresses. A lot of clever work has been done in this space to get the balances as accurate as possible, but missed addresses are possible. We do not have access to the underlying security practices of each exchange, nor can we see their net financial positions and obligations, so hacking and bankruptcy risk is still theoretically possible.
Nonetheless, if all of the above metrics are healthy that risk is drastically lower in the near-term.
Things move fast. At Capriole, we monitor all of these metrics around the clock in real-time, with system generated alerts and automated phone calls to our management team should risk breach concerning thresholds.
Guardian is just scratching the surface of Capriole’s risk management processes and procedures.