

The Fed Pivot
This month we deep dive into the macro and make the case for the Fed Pivot being just around the corner. We explain why equities are not overvalued, why peak fear is priced in and what all of this means for Bitcoin and crypto.
Welcome to issue 24. This issue marks two years of us writing the Capriole Newsletter – time flys! Each month we summarize the biggest crypto headlines and distill data and insights into what we believe are the most important factors for Bitcoin and crypto. 1000s of professional investors, funds and institutions subscribe to our newsletter.
We hope you have been enjoying it and we would love to receive your feedback. If there’s an area of the market you would like to see covered, let us know!
Big Red Flags
Risk markets are painting a clear message; continue on this path and something will break.
We have serious warning signs across macro markets, including:
- US Treasury Yield curves deeply inverted, a leading indicator for prior recessions
- New housing starts down
- Market valuations still highly elevated
- Maximum employment
- Eurobond curves heavily inverted, a sign of economic stress
- The 38 OECD countries have double digit inflation
- Distributive price action on major stock markets
Let’s dissect these first four items:
(1) Inverted Yield Curves
The “yield curve” plots the return on all US Treasury bonds. It typically slopes upward as the payout to an investor increases with the duration – most people expect to earn higher interest if they are locking capital up for longer.
When the yield curve inverts, notably when the 2-year treasury returns more than the 10-year treasury it suggests something is wrong. There is general concern about the longer-term health of the economy, and investors expect rates (the 10-year) will have to come down in the future to support investment in risk assets and general economic growth.
The 2/10 year Treasury yield curve has inverted 28 times since 1900. In 22 of these instances, recession followed between 6 months to 3 years later.
However, an inversion doesn’t mean that markets immediately go down. Over the last 70 years, the S&P 500 returned double digits on average for the 12 month period following an inversion. As far as equity investors were concerned, the recession began roughly a year later.
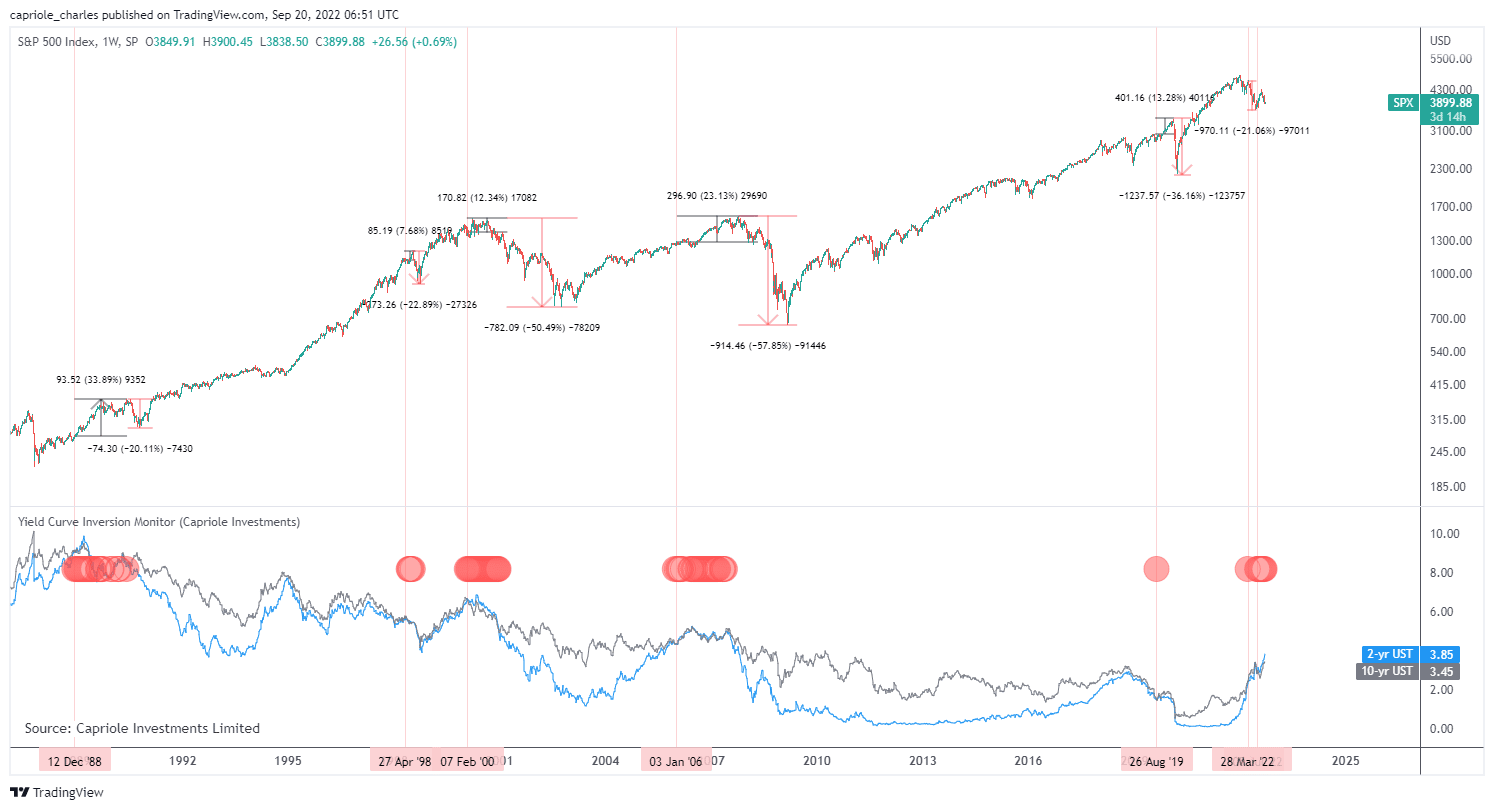
Yield curve inversions usually see equities rally for up to a year, followed by a larger move down. Source: Capriole Investments / TradingView
In March this year, the 2/10 year inverted once again. However, somewhat unusually, equities were already in a corrective move down. This suggests that we should be open minded about both positive and negative outcomes in equities through to mid-2023 based on this data point alone.
Nonetheless, if the bottom is in for equities, the current maximum downdraw of -21% from the March inversion would be unusually small based on historic yield curve inversion performance.
(2) New Housing Starts Falling
One of the first places that rate rise pressure appears is new housing starts. Higher rates means expensive mortgage bills. Since April, we have seen the number of monthly new housing starts drop by -20%. It has since recovered somewhat to -13% today. Declines in new housing starts often precede broader economic downturns.
But we are not in the real danger zone yet. To register as a strong recessionary warning signal, housing starts would need to drop further from here. Historically, declines under $1.35M preceded recession.
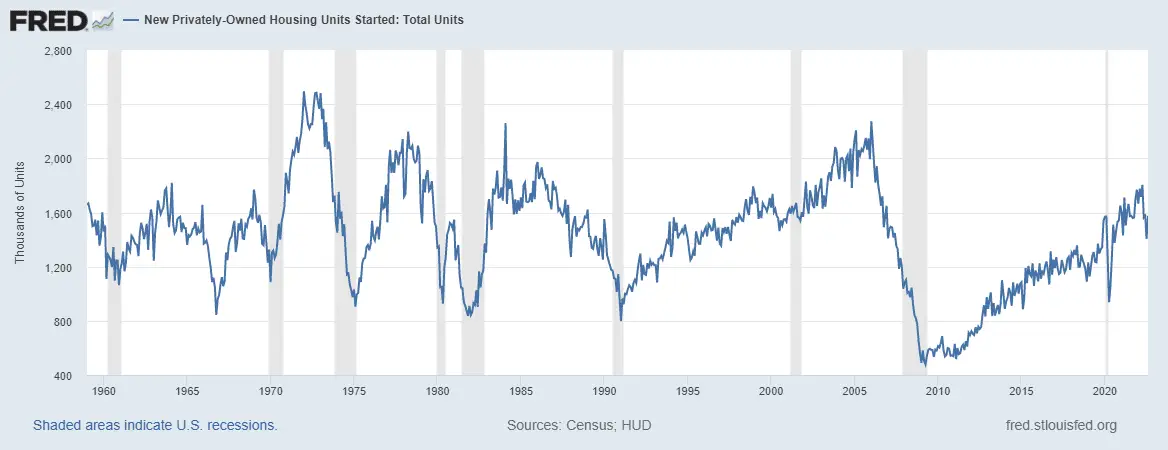
Families are tightening the belt on new housing investments. Source: FRED
(3) Shiller PE says equities are very overvalued
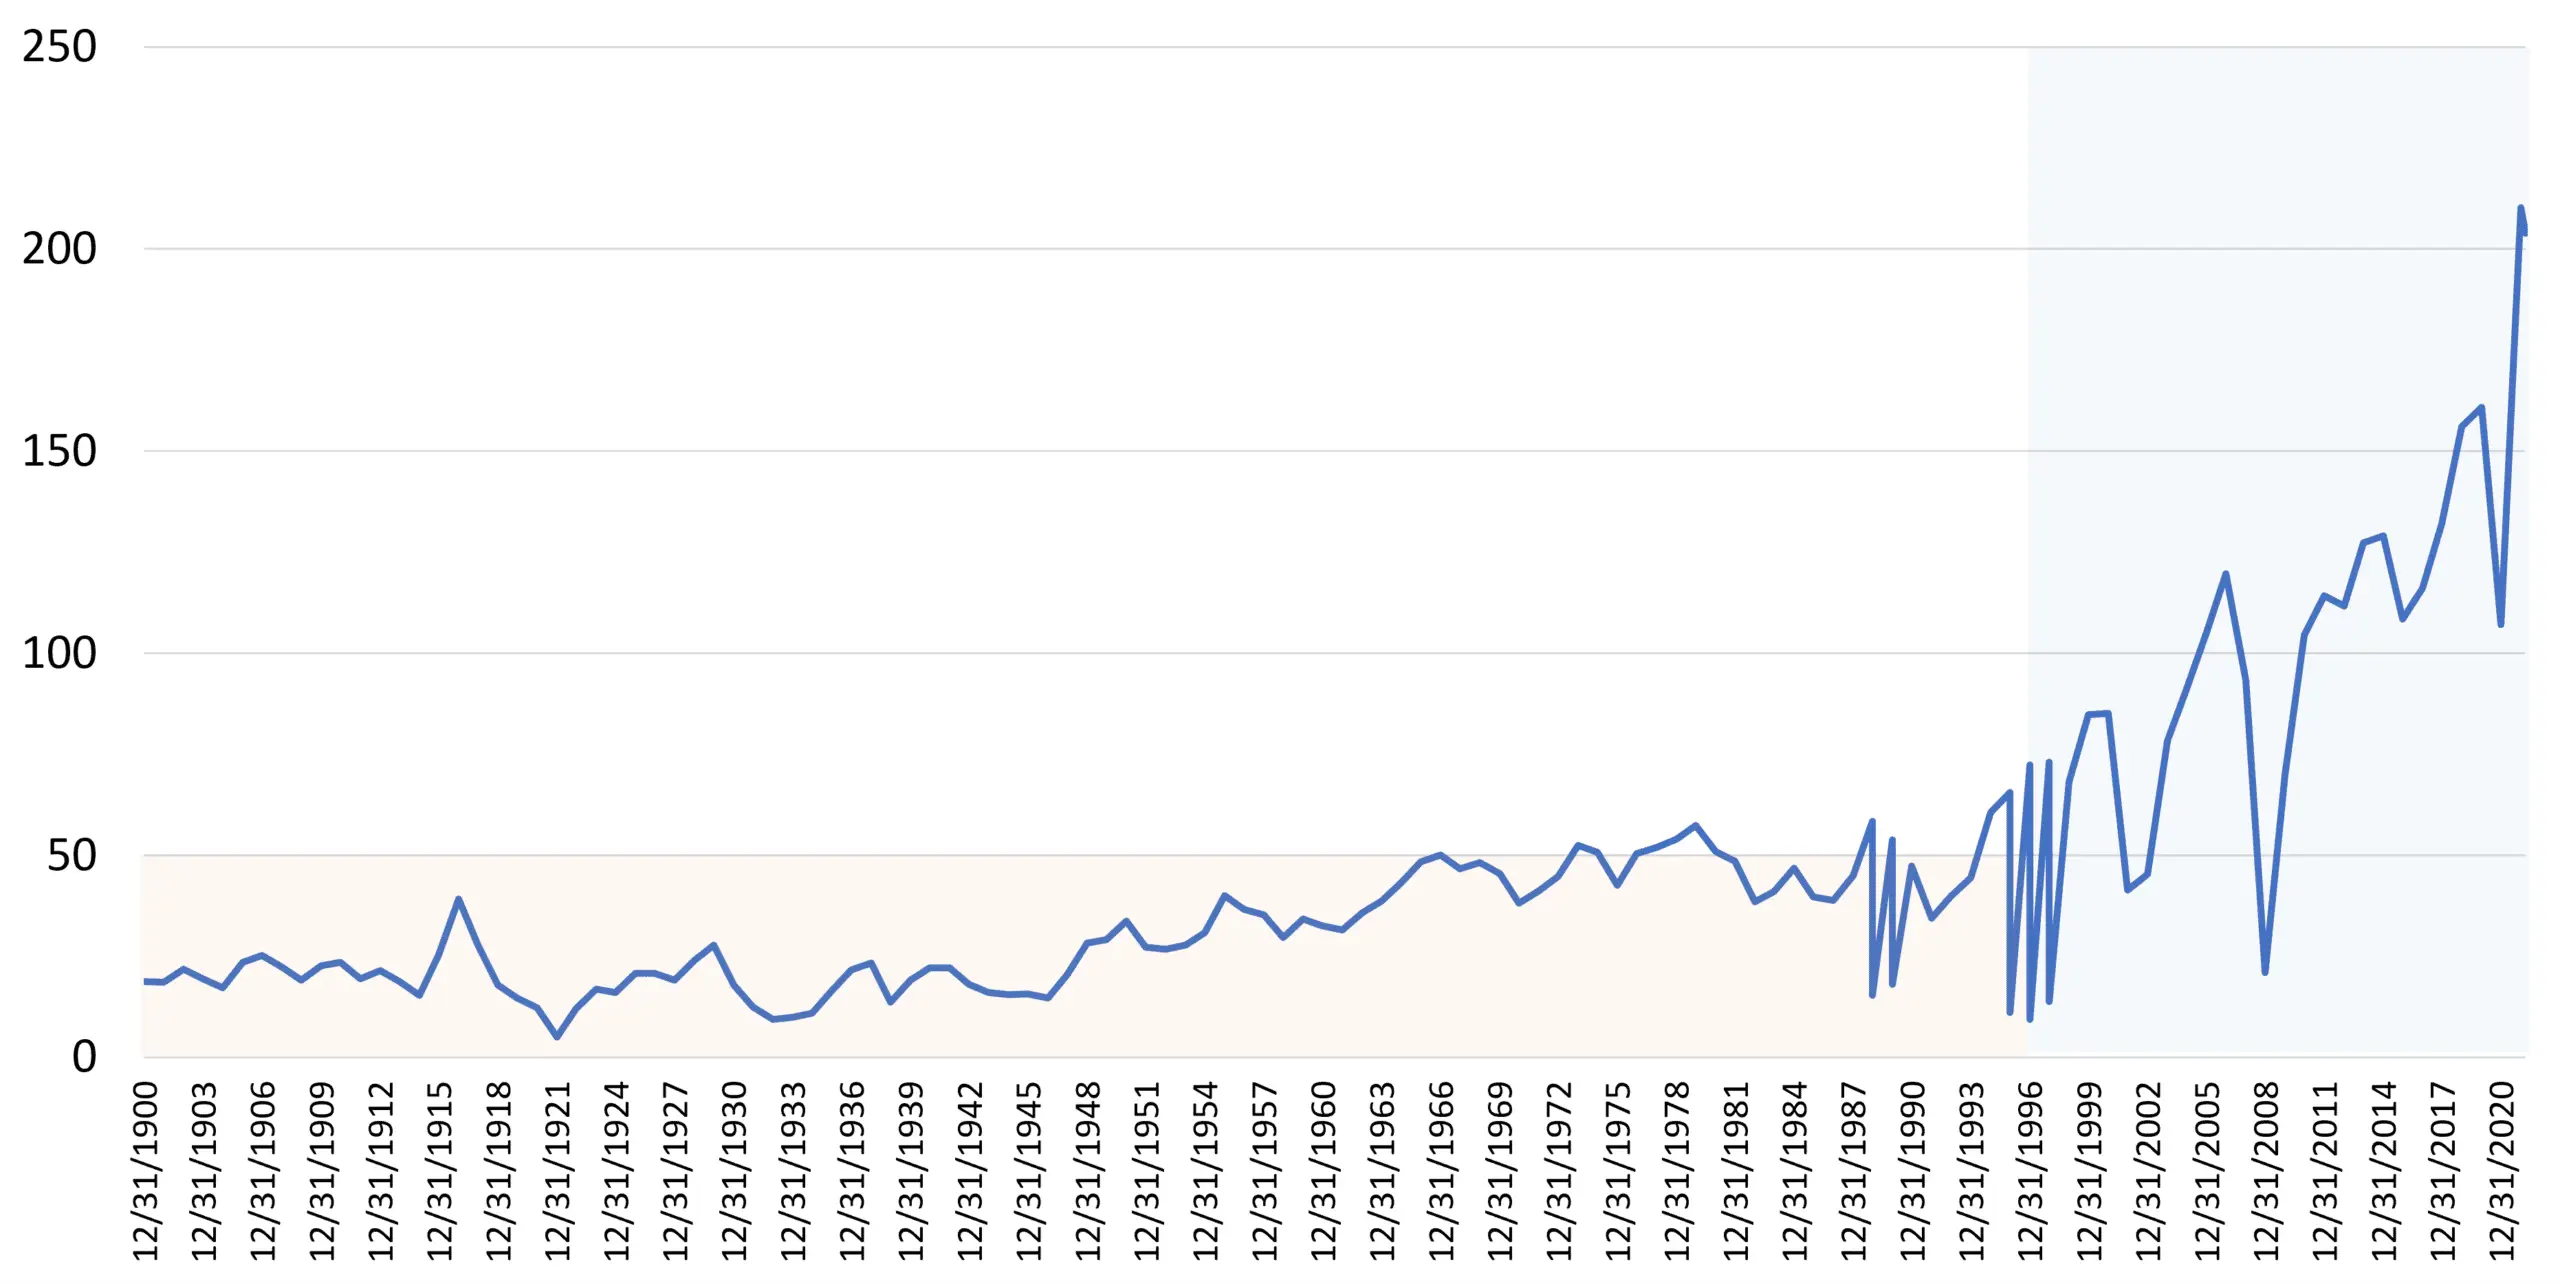
The Shiller PE (or CAPE Ratio) is a market price-earnings ratio often used as a yardstick to assess relative over- and under-valuation of equities. It uses inflation-adjusted earnings from the previous 10 years.
With a value of 29 today, the Shiller PE is still measuring higher than the peak of 1929 and 2008. A simplistic view of this measure would suggest that a 50% drop in the Shiller PE would not be out of the ordinary from here.
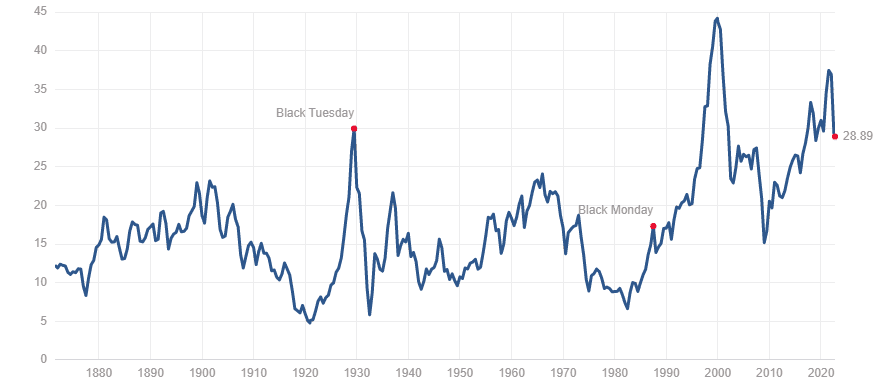
Shiller PE looks to have topped, but it’s still higher than 1929 and 2008. Source: Multpl
But it’s not that simple.
Since 1995, for the last 27 years, the average Shiller PE has been 27.8. But for the 100 years prior, the average Shiller PE was 14.6.
There are only two ways to explain this doubling in valuations for the last three decades. Either the markets have been growing in an ever inflating bubble, or there has been a drastic economic change over this period. The reality lies somewhere in the middle.
The last 50-years has not only been incredibly peaceful, but we saw globalization and technology take a giant leap forward. We had the invention of modern day computers and the internet; the latter of which went exponential in the mid-90s.
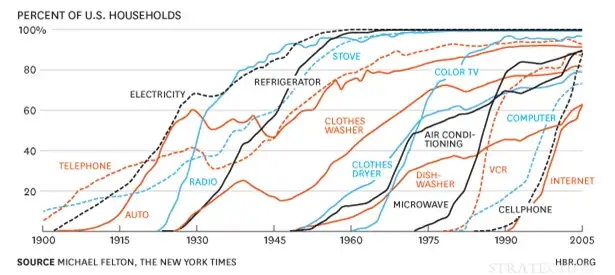
Technology adoption S-curves. The Internet and telecommunications went exponential in the 1990s. Source: Michael Felton, the New York Times
A logical argument can be made that technology (the internet especially) has created new exponential network effects that result in higher earnings of businesses (think Amazon, Google, Microsoft, Facebook) and people (solopreneurs, podcasters, dropshippers and more). This is a result of the exponential benefits associated with network growth, also known as Metcalf’s law.
Under such a massive technological revolution, business earnings have also been moving on this S-curve. One could argue that the trailing 10 years of earnings that the Shiller PE uses is too lagging of a metric and is not representative of current and future profits that modern businesses generate.
And there is quantifiable evidence for this.
Since 1995, real earnings per share increased over 400%. It took almost 100 years to achieve that same growth rate in earnings before the mid-90s. This generation has indeed seen S&P500 earnings grow 300% faster annually compared to the prior century.
This completely explains the higher Shiller PE scores over the last three decades. Shiller PE uses data which is on average 5 years old, but earnings have been growing at an astounding 15% p.a., versus just 4% p.a. for the prior century. Compounding 15% p.a. over 5 years results in a 100% increase.
S&P500 Inflation adjusted earnings grew about 4X faster in the last decade. Source: Capriole Investments
In other words, the denominator of Shiller PE (earnings) is using a value half of what businesses were actually earning through most of the last three decades. Because of this lag, Shiller PE values are effectively double what they should be if earnings were not lagged. The market is not nearly as overvalued as the Shiller PE would suggest.
If asset prices and current earnings stayed exactly the same for the next decade, the Shiller PE would fall by about half, as the divisor (10 year average earnings) slowly increases each year and plays catch up to reality. When you think about it that way, equities don’t sound so overvalued after all.
(4) Maximum employment
The US unemployment rate is at 50 year lows showing an incredibly healthy labor market. Nonetheless, bottoms in unemployment often precede recessions, as once growth in unemployment kicks in it’s hard to stop. In the current cycle we have just one month of data (August) with a slightly higher unemployment rate. This doesn’t yet tell us much, we will need to see several occurrences of increased unemployment – or a significant large jump – for this metric to signal imminent recessionary risk. But it’s not there today.
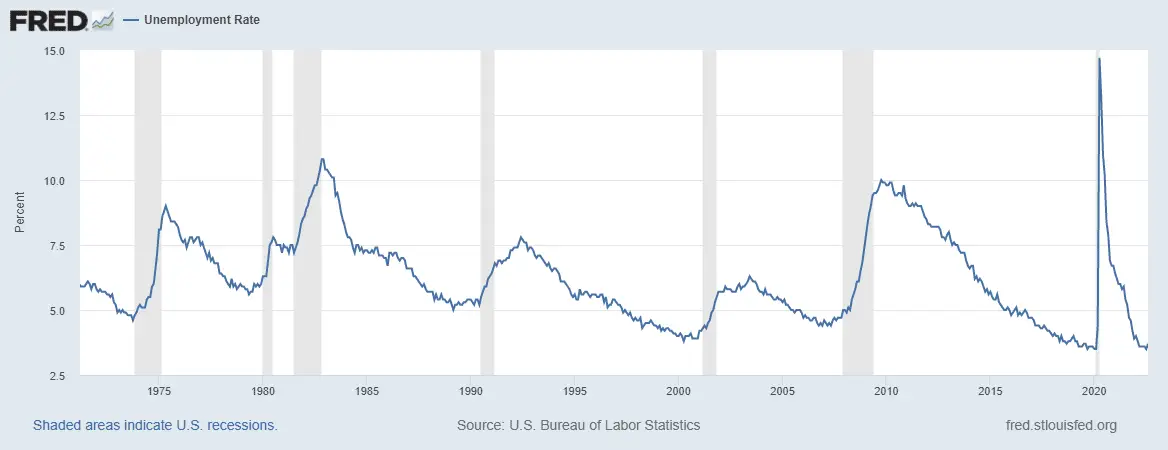
Labor markets are incredibly strong, but the makings of a bottom which precedes recession may be forming. Source: FRED
The real risk: growth
The real risk today is diminished growth into the next decade. If the Fed continues, and then sustains, aggressive rates it becomes more and more difficult for businesses to make new investments and grow earnings. Especially with the level of debt in the system. But we would need years of time spent in such an environment to assess this impact.
The other risk to growth stems from the recent grassroot movements of de-globalisation. Globalization and relative global peace supported incredible economic growth since WW2. Recent years have seen increasing polarization, tariffs, sanctions and of course Russia’s invasion. Should this trend worsen, we can expect a future with a correspondingly lower economic growth rate. Again too early to tell. Potential escalation in these areas should be monitored by investors.
Sentiment in the Gutter
Various measures of market sentiment all tell a similar story. Hyper pessimism is priced into the market. When fear subsumes, turnarounds often occur. Perhaps the most compelling sentiment measure is institutional option buying. When lots of “put” options are bought (downside protection hedges which allows institutions to sell at a fixed price in the future) versus “call” options (which allows buying at fixed prices) it suggests higher pessimism in the market. The market is effectively a net buyer of downside insurance.
The put/call ratio is expected to fluctuate in the normal course of business, but it is most interesting at its extremes. In early September, institutional traders bought $8.1B put options. They bought less than $1B in calls. That’s 3X more hedged than 2008.
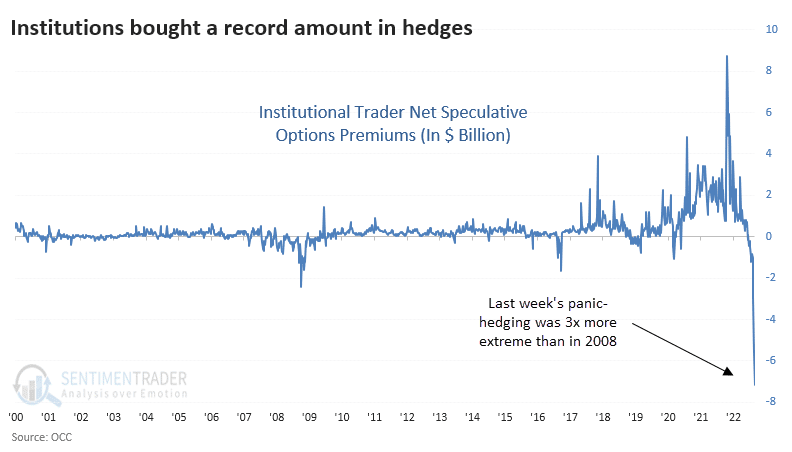
Options put/call ratio at 8X. Institutions are 3X more hedged than 2008. Source: Sentimentrader
Other sentiment metrics tell a similar story. It wouldn’t be surprising to see some form of market relief in the coming months, if for no other reason than bearish sentiment normalization.
Slow Down. No Rush.
The Fed doesn’t have to pivot. We are not in a recession yet. This may be surprising if you are on Twitter or reading the news, but most of the signs that the US looks at to define a recession have not yet triggered meaningful levels of concern.
The Fed’s key economic data is not yet forcing a need to slow or change policy. More on Twitter
Until major concerns of recession show up, until it hurts where it counts – employment – there is no reason to expect an urgent change in Fed policy here. So it is business as usual until we have evidence that inflation is under control. The Fed is looking for multiple months of readings confirming inflation is under control. So where are we at now?
The good news: inflation has peaked
There are several signs that suggest inflation may have reached its peak. PPI Finished goods peaked in April and its year-over-year rate of change is now down -30%. This alone is reasonable grounds to slow the rate of interest rate rises in the coming months, provided the current levels of inflation hold or reduce.
Once markets are convinced inflation is broken, the large tail risk of pandemic and inflation will have been removed from the market, supporting a repricing of risk assets upwards.
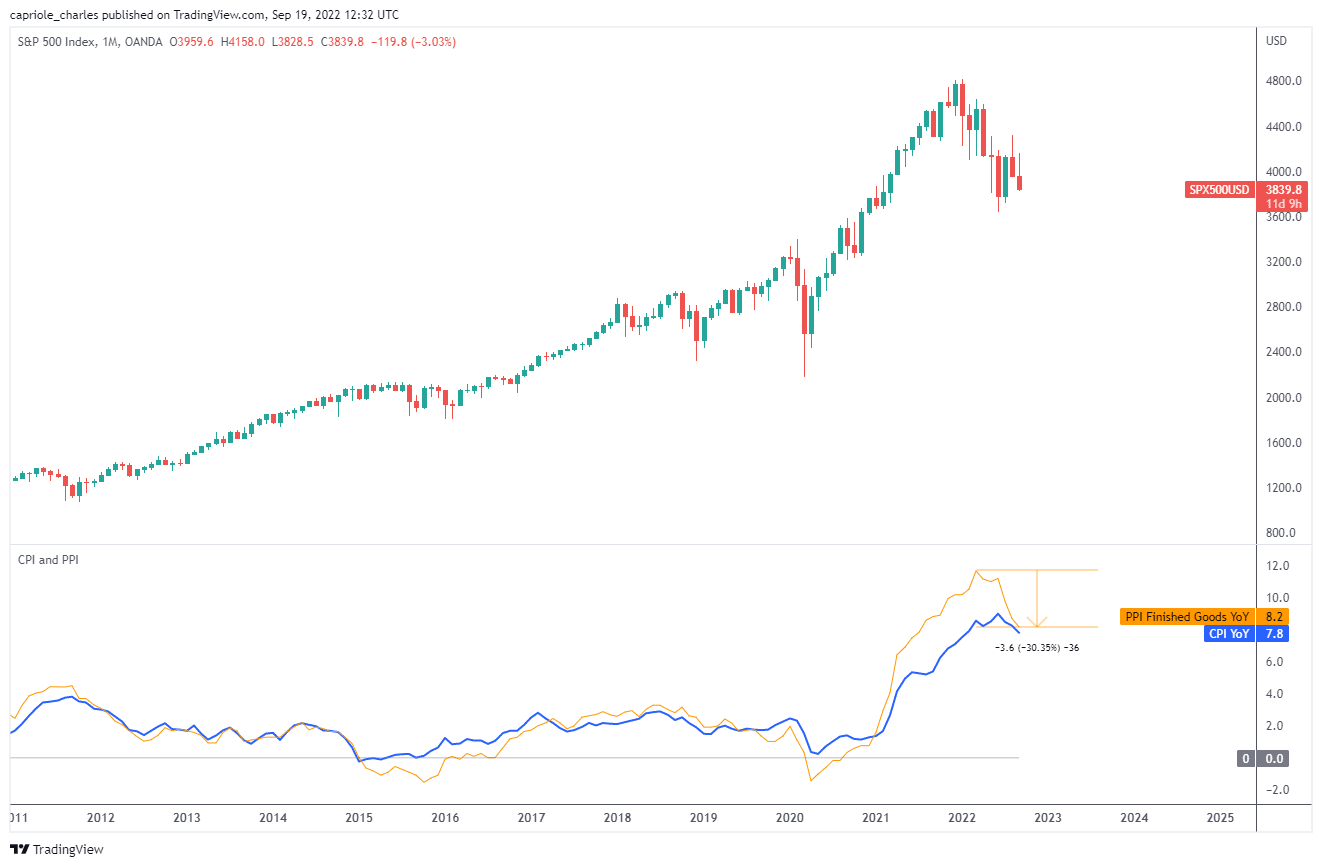
PPI and CPI show signs to have topped between March and June. Source: TradingView
Tomorrow, the Fed is expected (80% probability) to raise rates by 75bps. What does that mean if the Fed actually raises rates 75bps? The remaining 20% probability of 100bps plus rate rises is eliminated, which should resolve in a short-term risk market rally as unrealistic aggression is priced out. Given current policy is now showing tangible evidence that it is effectively bringing inflation down, it seems unlikely that the Fed would raise rates by 100bps.
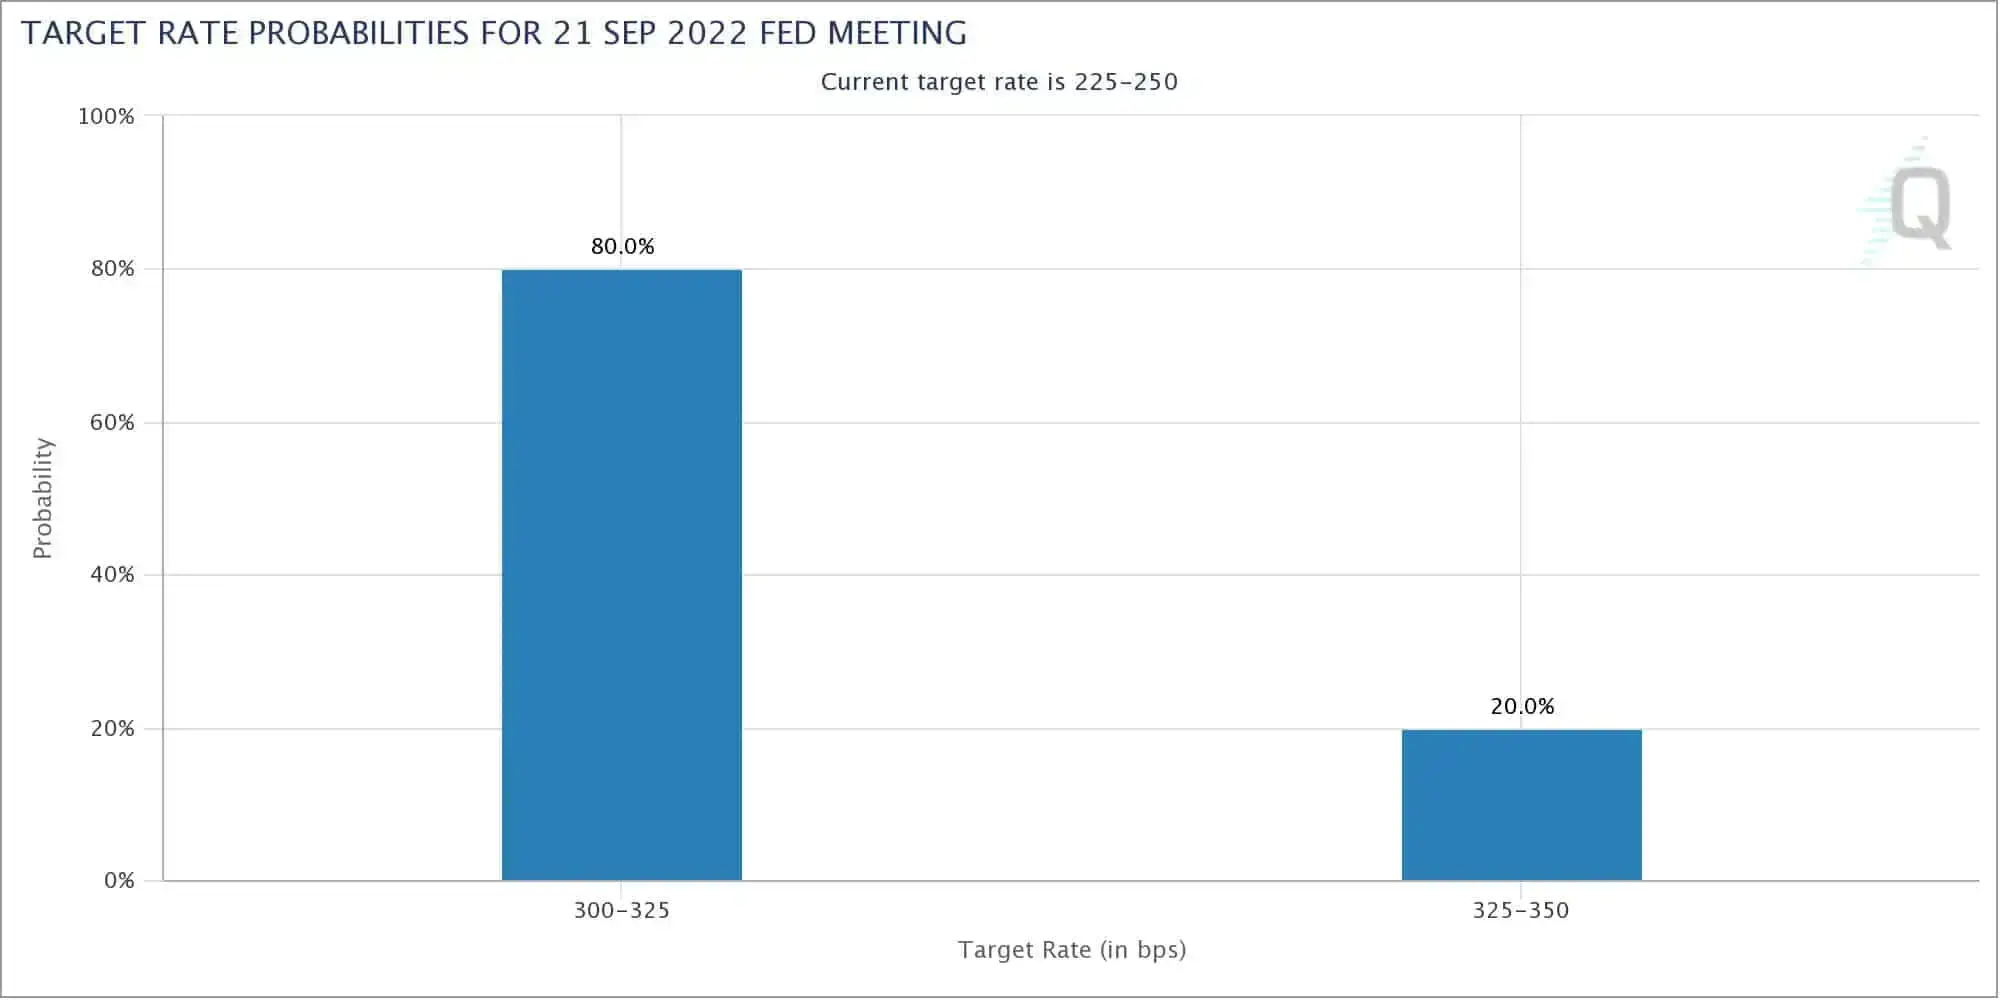
The market is pricing an 80% chance of a 75 bps rate rise tomorrow. Source: CME
The Pivot
From here the incentives are stacked towards a softening of Fed policy the more time goes by. Inflation has topped, key data is spelling financial market stress (bonds), we are seeing early signs of a top in spending (housing) and a bottom in unemployment is forming. Provided all of these trends remain as is, or continue in their current direction, pressure mounts on the Fed to change course.
Consider also that many of these macroeconomic metrics are lagging (we just got August housing data today). Recessions are usually called late and mark risk-asset buy signals historically. The impact of Fed policy is also lagging.
We haven’t yet really felt the impact of these rate rises. It will take 6-12 months plus for rates in the 3-5% region to be felt across businesses and economies. There will be sustained impacts. Higher rates of return on cash means less incentive for alternative investments in any form. As MacroAlf notes:
“The 5 largest economies in the world are experiencing the fastest slowdown in credit creation in over 20 years. History suggests that earnings and economic activity will follow.”
This is yet another reason to expect the current worsening of economic data to continue, laying yet more incentive on the Fed to pivot.
For all of these reasons, we expect the Fed to discuss pushing the pause button sometime in Q4 2022 / Q1 2023. This will likely be signified by smaller rate rises followed by pausing. That is the pivot. That is the signal the market is waiting for.
The market is a forward looking discounting machine. The most important thing for risk asset pricing is the turns in political regimes. It is all about changes in rates-of-change. We saw this in Q4 2021 when the Fed signaled rate rises would begin in the future, and all risk assets began to collapse immediately.
The next pivot should trigger a risk asset rally, through which high beta assets like Bitcoin and Ethereum should perform the best if tight correlations remain.
But that doesn’t mean we are out of the woods. Inflation has a habit of rearing its head multiple times after it first pops up over a period of several years. It may well be something markets have to battle on-and-off for the coming 5 to 10 years, particularly if global trends of de-globalization deteriorate.
Bitcoin Fundamentals
The Bitcoin Macro Index, Capriole’s autonomous fundamentals-only trading strategy which uses machine learning to assess and learn on over 35+ Bitcoin on-chain and equity market metrics, remains in a deep value region in September.
Bitcoin fundamentals are holding ground in a region of value. Source: Capriole Investments
The Macro Index Oscillator. Source: Capriole Investments
The Headlines
The most important news in Bitcoin and crypto markets this month:
The Good
- Nasdaq is preparing to launch an institutional crypto custody service. More.
- Ethereum transitioned to Proof-of-Stake with the completion of the “Merge”. More.
- Charles Schwab, Citadel and Fidelity start crypto exchange EDX markets. More.
- UK venture firm Northzone eyes web3 startups with new €1B fund. More.
- MicroStrategy files offering of up to $500M, in part to buy additional Bitcoin. More.
- Bitcoin’s hash rate hits a new all time high. More.
The Bad and the Ugly
- Wintermute investment firm loses $160M, a third of their assets, in DeFi hack. More.
- South Korea requests Interpol red notice for Luna founder, Do Kwon. More.
- The SEC chair says Ethereum’s upgrade could now trigger securities laws. More.
- Multi-billion-dollar asset manager Stone Ridge liquidates Bitcoin strategy fund. More.
- Poolin, one of the largest Bitcoin mining pools, suspends withdrawals. More.
The Bottom-Line
This issue we’ve focused on the macro environment and why we believe the picture for risk assets is better than it may seem. Most metrics for a recession have not yet met the necessary thresholds. A lot of metrics are painting a picture of increasing risk for recession, but recessions have historically marked positive turning points for risk assets. Without new, unknown events, most of the damage in the current macro environment has already been priced in.
Equities are not as overpriced as you may think. The internet brought an era of 300% higher average annual earnings growth over the last three decades, which is skewing lagging valuation metrics like Shiller PE and presenting an erroneous picture. Bitcoin also continues to trade in a historically deep value region.
We are seeing convincing evidence for a near-term top in inflation, and increasing risk of significant damage to financial markets, employment, consumer spending and economic investments if an aggressive tightening course is maintained. The longer these conditions hold, the more reasons the Fed has to “pivot” – to slow or stop interest rate rises. We expect this will occur in Q4 2022 or Q1 2023. Provided global trade and geopolitical tensions do not worsen, this pivot will remove market tail risk and provide significant relief for risk assets – Bitcoin included.
New in the Media
- Charles spoke with Bitcoin Archive, covering Bitcoin, the current Hash Ribbon signal, institutional accumulation and more.
- Charles spoke with CoinTelegraph, covering Bitcoin, Ethereum’s Merge, macro markets, on-chain analysis, risk management and more.
- Keep your eyes peeled for our Charles’ interview with Mark Moss on Market Disruptors, out later this week!
New Alpha
- We published a new open-source indicator and article for an on-chain strategy which outperforms Bitcoin. This is a simple strategy which proves the value in fundamental analysis in managing crypto investments.
Content We Love
- Sven Henrick also believes the Fed policy pivot is closer than anyone thinks
- Alf on why EUR devaluation looks set to continue and the ECB balance sheet won’t be coming down anytime soon, and why the TLTRO multi-trillion dollar program is pegging bank rates much lower than ECB rate rises would have you think.