

Crypto’s Sucker Punch
Crypto markets took a punch to the gut in May with Terra Luna’s $60B wealth destruction event.
The Luna destruction is an unfortunate turn of events for several reasons.
The collapse represents the largest destruction of wealth of a single entity in crypto history. Just weeks prior to the collapse, Capriole exited its position in Luna due to deteriorating health metrics we were monitoring, including the depleting Luna/UST reserve ratio. While we averted this crisis, many did not. Large amounts of retail investors were crushed by this event. Several funds have collapsed and are in the process of winding down including Invictus Capital and Hashed. Other funds have taken massive losses, including Delphi Digital and Galaxy Digital. We have only seen the tip of the LUNA-collapse-iceberg. The fallout news will likely continue to flow over the coming weeks and months.
Luna’s death spiral will be studied deeply and form the subject of numerous PHDs for the next decade. It will also serve as a regulator case study on the need for further regulation within crypto. While more regulation is needed, the nature of this event will no doubt speed up aggressive and potentially poorly constructed regulation around stablecoins and securities laws which could hinder the industry, and the accessibility of crypto to the everyday investor. The LUNA collapse will not stop the inevitable march forward of crypto innovation and adoption, but it was an unnecessary event which will be a drag on the industry for some time.
The positive: it is always darkest before the dawn. All crypto markets have been crushed. Nonetheless, Bitcoin is trading above $30K today despite the May crisis and despite Luna’s forced selling of billions of dollars of Bitcoin from their treasury. Large negative events like this are also not uncommon in crypto bear markets. Prior cycles have seen many major exchanges get hacked (like Mt Gox), last cycle we had the multi-billion-dollar Plustoken scam and today we have the $60B Luna implosion. Crypto related catastrophes are getting fewer by the year as the industry matures. Finally, the pricing damage in the wake of these unfortunate events has historically created the best investment opportunities in crypto history. The coming months may well represent great long-term value in hindsight.
May Highlights
Here’s this month’s main highlights:
The Good
- Binance receives French and Italian regulatory approval
- Andreessen Horowitz raises $4.5B crypto fund
- Standard Crypto raises $500M fund
- Flow launches $725M blockchain development fund
- LGT, the world’s largest family-owned private bank, to offer crypto
- Stripe partners with OpenNode to allow instant fiat-to-Bitcoin conversions
- Meta files five trademark applications for ‘Meta Pay’ teasing crypto payment platform
- Despite the ban, China’s Bitcoin mining still accounts for 20% of global hash power
- Yellen says the stablecoin market is still too small to pose systemic risk
- Bitcoin ETFs began trading in Australia
- Thailand exempts crypto transfers from VAT until end of 2023
- Binance signed an agreement to develop crypto adoption in Kazakhstan
The Bad
- UST’s de-peg causes a bank run and death spiral of both LUNA and UST, destroying nearly $60B of wealth in days
- Fear in the wake of the UST aftermath causes a temporary de-peg in the USDT stablecoin
- CPI hits 8.3% p.a. but shows some signs of slowing later in the month
- Argentina’s Central Bank bars banks from offering crypto services
The Rest
- Russia is considering allowing cryptocurrency to be used for international payments
- FTX exchange expands into stock trading, furthering crypto’s integration into traditional markets
The Markets
The Luna collapse withstanding, Macro markets remain in the driving seat for crypto. Rising rates and new highs in inflation saw fresh lows in stock markets in early May. The macro drag and the Luna collapse saw Bitcoin down -33% in the first 12 days of the month. Later in May, the S&P500 and Bitcoin showcased a strong recovery and today both markets find themselves at major resistance levels, both fundamentally and technically.
Let’s see if this is just a bear-market bounce, or if markets are starting to put in a genuine bottom.
S&P500 technicals saw a strong bounce last week, but today we find ourselves at weekly/monthly resistance. Clearing 4200 on a closing basis would be promising.
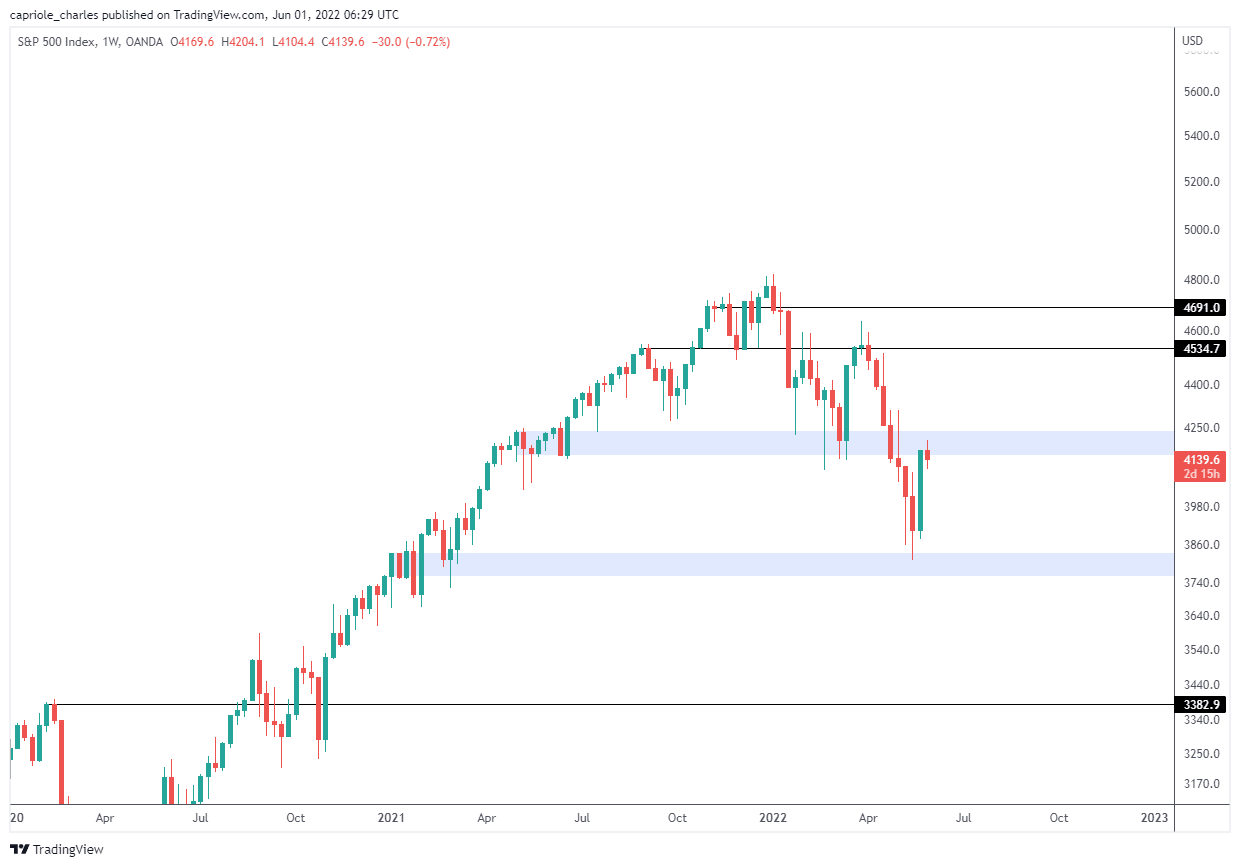
The S&P500 is currently testing Weekly/Monthly resistance at 4200 after staging a strong bounce on 3800 support. Source: TradingView
Unsurprisingly, the equally weighted S&P500 also staged a strong bounce but is now trading into the biggest resistance zone on the chart, shown here by the Volume Profile indicator.
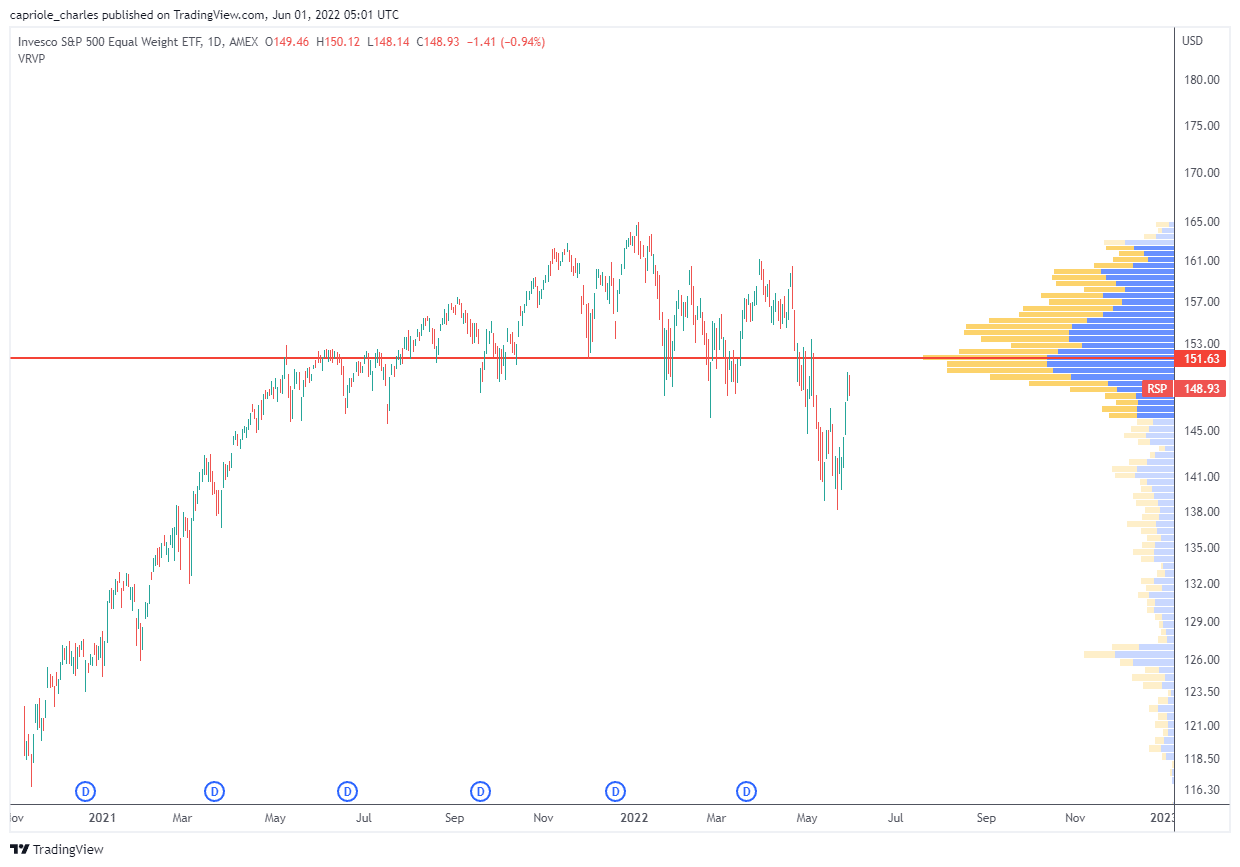
The equally weighted S&P500 is trading into the biggest resistance zone on the chart. Source: TradingView
On the positive side, several risk market fundamentals are showing signs of a potential bottom formation, including treasury rates, junk bonds and consumer discretionaries.
Broadly, higher rates means lower risk-asset prices. The 10-year treasuries have had an incredible run ever since the Fed started its tightening campaign in November 2021, reaching as high as 3.2% in early May. However, over the last six weeks the 10-year has started to lose steam and is showing potential topping signs. This drop in momentum coincided with last week’s strong stock market rally. Today the 10-year sits at 2.84%. We want to see 3% hold as resistance and the 10-year decline from here in order to give convincing evidence in the strength to the current stock market rally. For that to happen, we will likely need to see either further Fed tone softening, or continued evidence that inflation is under control – neither of which are expected to happen overnight.
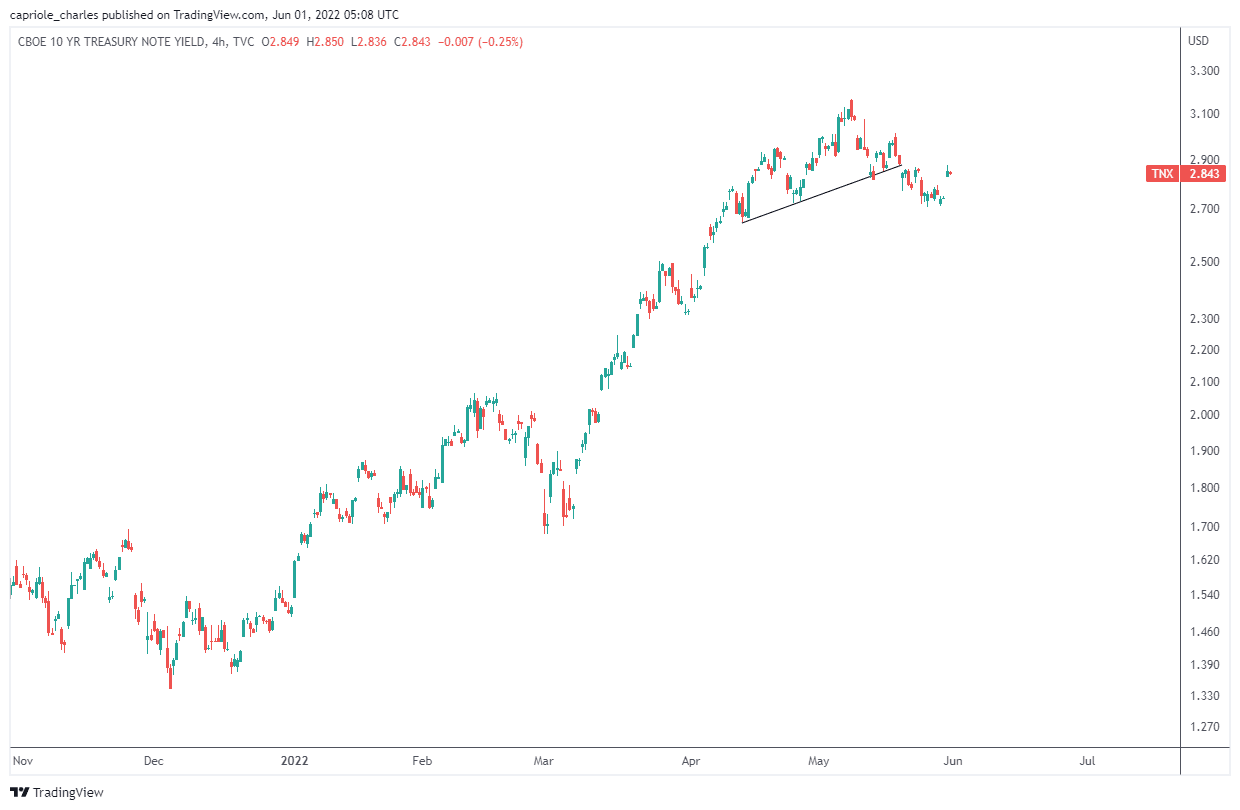
Potential topping in the 10 year treasuries shown by this Head & Shoulders pattern. Should rates rise above 3% in the near-term, that would likely represent the end of the current risk market rally. Source: TradingView
Junk bonds have also shown their biggest rally in the last couple years. Like the 10-year’s decline, this shows an increased appetite for risk and is a positive turn of events.
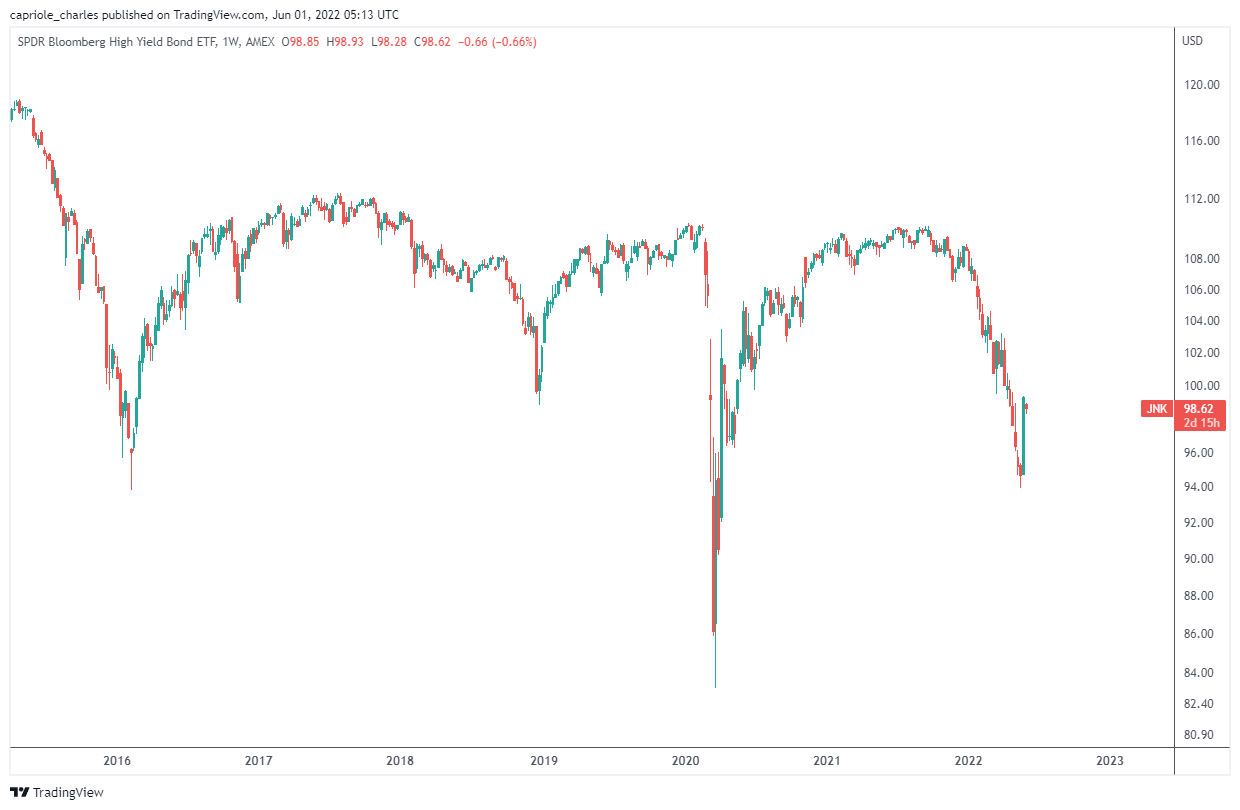
Junk bonds have put up their biggest rally in years. Source: TradingView
Discretionary vs Staples is printing a double bottom on the daily timeframe.
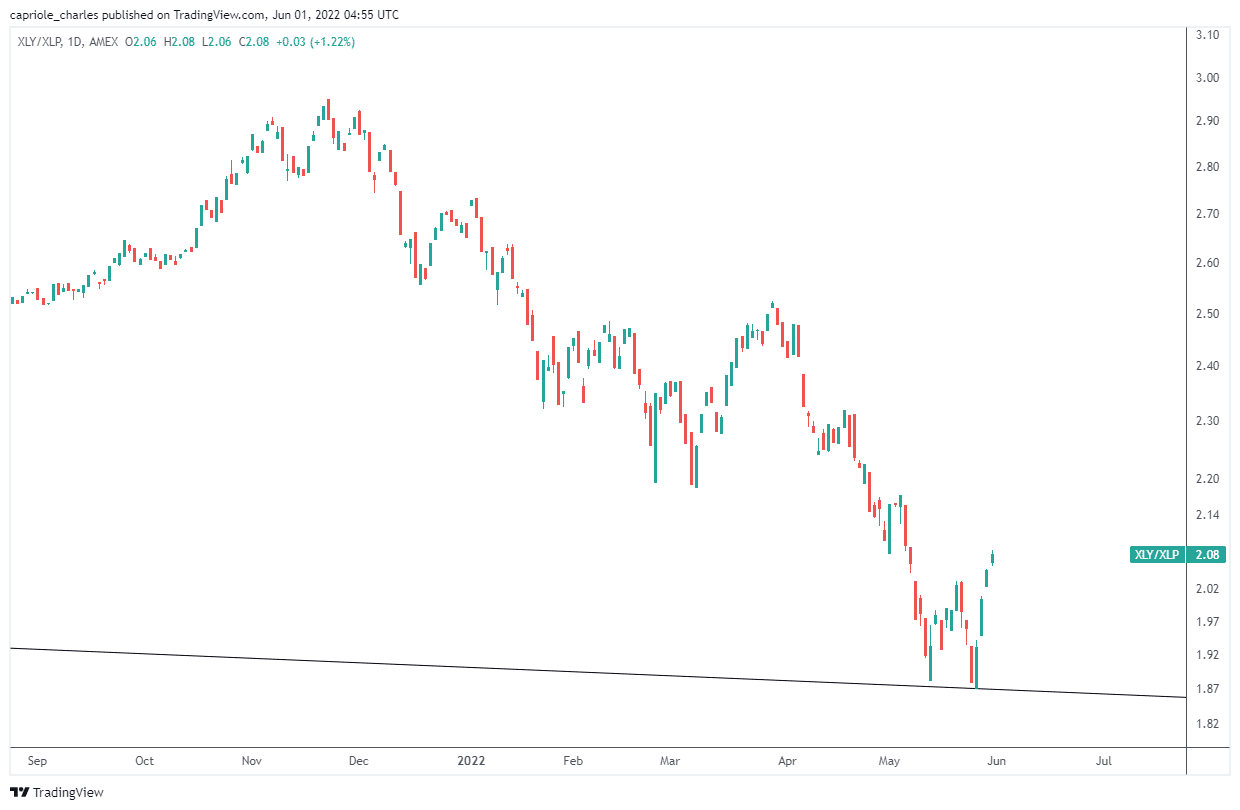
Discretionaries vs Staples (XLY:XLP) Source: TradingView
Less exciting is the continued strength of Energy versus Tech. No doubt this trend has received strong reinforcement with the EU’s ban on Russian oil imports yesterday. For a convincing recovery, we would like to see Tech take the lead as the sector which has typically represented growth.
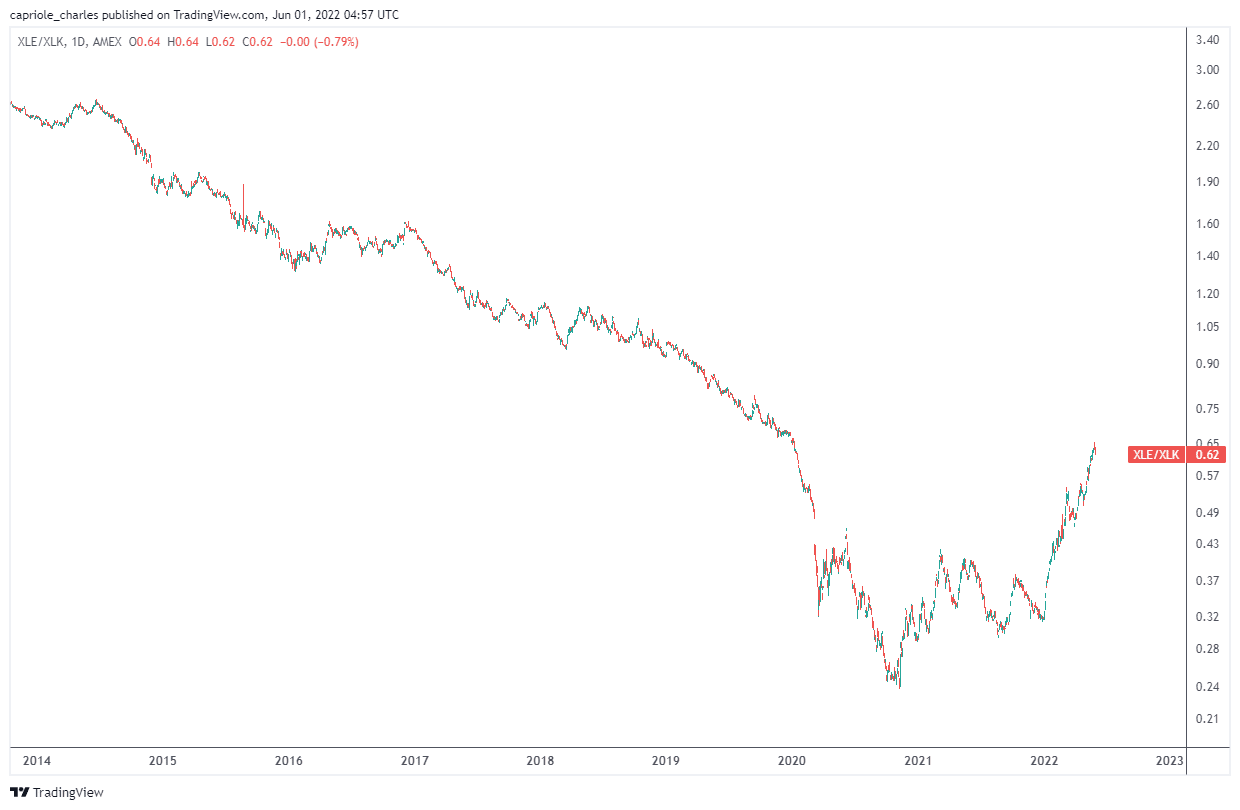
Energy vs Tech (XLE:XLK). Source: TradingView
Markets have been incredibly oversold for many weeks. Bitcoin has just completed nine down weeks in a row, an all-time bearish record. Fear and Greed and the AAII Sentiment survey have also been printing bearish extremes for weeks, readings which traditionally occur at major macroeconomic lows. The question is – is this recent move simply a bear market rally, or the formation of a major bottom?
The short answer is it’s too early to tell. Over the last 4 weeks the above metrics have broadly been trending in the right direction, but many of them are also heading into major resistance levels today. If we are in a bear market rally, many of these macroeconomic metrics are at a point now where we would expect things to start to turn down from here. The next few weeks will be critical to determine if this rally has steam, or was simply a flash in the pan.
The Fundamentals
This month we will turn attention to Capriole’s inhouse Macro Index model. Capriole is a quantitative asset manager. While we gain a lot of insight and learnings from visual charts and individual metrics, at the end of the day our assets are managed by automated algorithms which take a “weight of the evidence” approach. No single metric drives our investment thesis. So let’s take a quick look at our Macro Index strategy and see what it is saying about the fundamentals of the Bitcoin market today.
The Capriole Macro Index
The Capriole Macro Index is an algorithm which uses machine learning models to weight and assess an array of fundamental data metrics which we have found give a strong indication of Bitcoin’s relative value throughout cycles. The model only looks at on-chain and macro-market data. Price data and technical analysis is not considered as an input at all.
We hand selected over 35 of the most powerful Bitcoin on-chain and macroeconomic data metrics. This data is fed into the Capriole Macro Index machine learning model. The inputs include a lot of the familiar names such as Hash Ribbons, Supply Delta, Puell Multiple, Realized Profit and Loss, Supply Shock, Whale and Fish growth as well as other macro indicators like AAII sentiment and much more.
Following processing of the metrics, the machine learning model outputs importance weights for each data feed. These weights are systematically re-calibrated on a recuring basis to give more weight to metrics that have provided more explanatory power of Bitcoin’s history and less weight to those that have provided less insight. The Capriole Macro Index score is then simply the sum product of the weighted-metric scores. Finally, the output is run through a Hodrick-Prescott (HP) filter to remove noise.
This results in our final “Macro Index” score.
From the Capriole Macro Index score, we define four Bitcoin regimes based on the index level and slope, namely “recovery”, “expansion”, “slowdown” and “contraction”.
When plotting the Capriole Macro Index score against its regimes, a “clock-like” structure can be seen which highlights the cyclical nature of Bitcoin through time over the last decade.
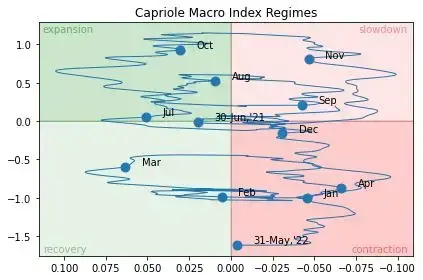
The Macro Index Clock shows the cyclical nature of Bitcoin’s expansion and contraction cycles. Source: Capriole Investments
We run a long-term autonomous trading strategy on the Capriole Macro Index. This strategy takes long-only positions in Bitcoin. In slowdowns and contractions, cash is held, but short-positions are not taken. Our tests suggest the Capriole Macro Index strategy performs well against Bitcoin buy-and-hold.
Yes. On-chain analysis can work in crypto investing.
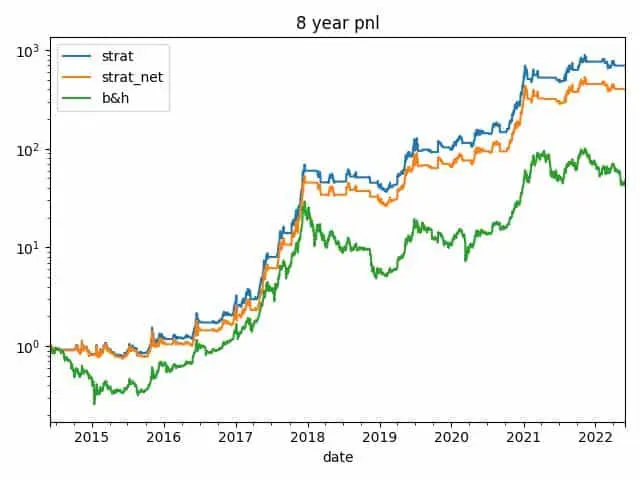
Backtest results of the Capriole Macro Index show significant outperformance against Bitcoin buy-and-hold over time. Source: Capriole Investments
So how does the Capriole Macro Index look? The below chart shows the Index plot for the last 10 years. As you can see the current score is in contraction (red) and quite low (-1.62). This suggests we are in a long-term deep value region relative to Bitcoin’s history. However, all prior cycles did go lower before bottoming. That’s not to say that the Capriole Macro Index must go lower this cycle, but it’s worth considering that we historically have.
While we are still in “contraction” today, the rate of fundamental decline has been slowing recently. We may well be very close to entering macro “recovery”. When that happens, the Capriole Macro Index strategy will take a long-position in Bitcoin.
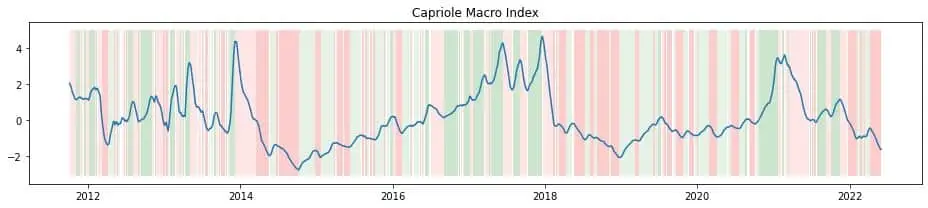
The Capriole Macro Index for Bitcoin is still in “Contraction” today, but the rate of decline has dropped. Historically we are in a value region. Source: Capriole Investments
The Capriole Macro Index is just one of our in-house autonomous investment strategies. Hopefully the above provides some insight into how we consider fundamental data and the “weight of the evidence” in taking positions. Regardless of how you manage your investments, it’s not a bad idea to look at a spectrum of data and achieve “confluence” before making a decision.
The Technicals
While it’s great to see some green on the chart this week, we are still only three days into the week. A lot can happen in the next four.
Like the traditional finance market moves above, this could be the start of a bottom, but equally we are now trading into major resistance at $31.5K (weekly) and from there we have more resistance at $35K (monthly).
We want to see both of these price points taken out on a weekly close to see a convincing technical move. Until then, the Bitcoin technicals remain bearish.
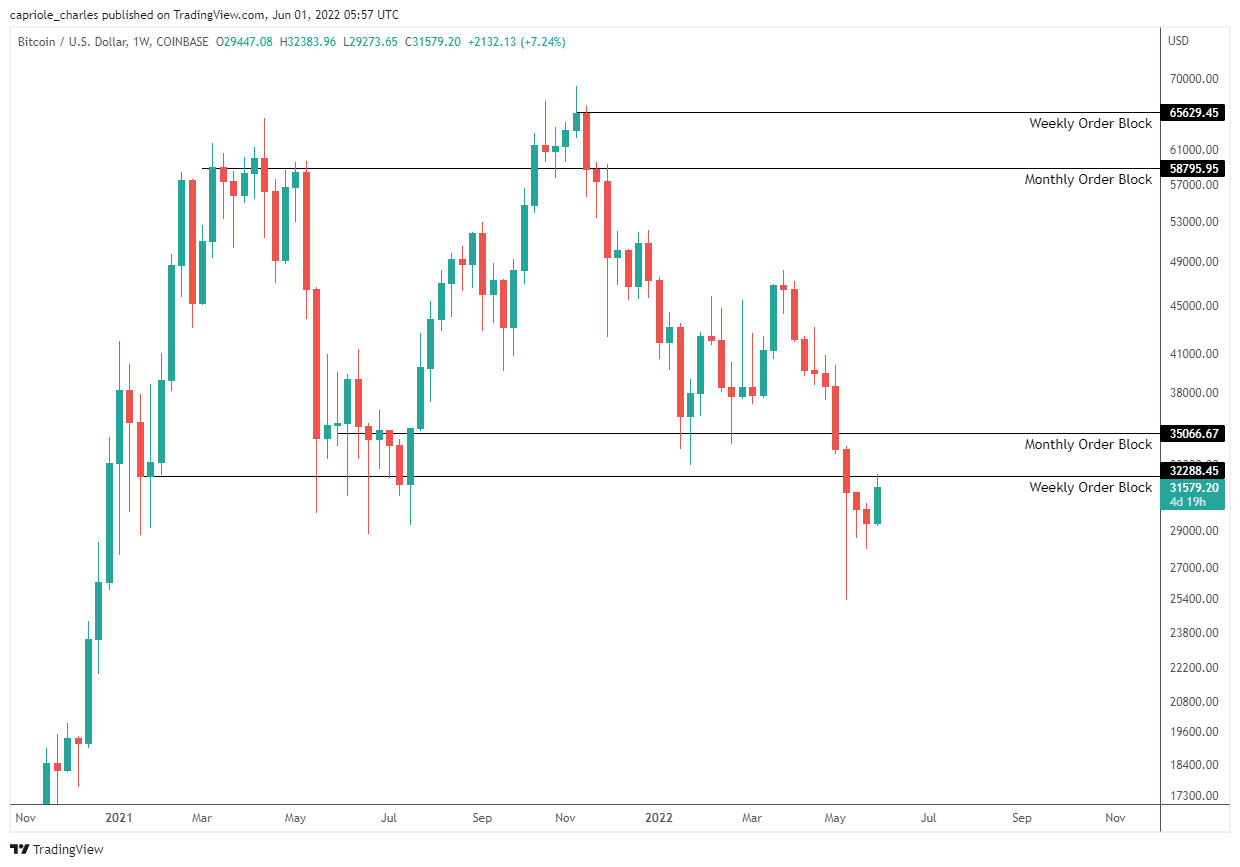
Bitcoin has suffered a major technical breakdown this month and is trading below weekly/monthly resistance. Source: TradingView
The Bottom-line
The macro environment continues to drive crypto markets, with correlations between Bitcoin and the S&P still very high. The last weeks have shown the first signs of life for a potential macroeconomic recovery, but more evidence is needed to prove that this is indeed a turning point or whether it is simply a dead-cat-bounce in a greater bear market.
The Bitcoin fundamentals picture remains similar to last month, with the addition of the notable LUNA/UST collapse acting as a ball-and-chain on recovery. As shown by the Capriole Macro Index, Bitcoin fundamentals have entered a region of value which historically is only seen every 4 years, but it’s still not as discounted today as it has been in prior cycles.
Bitcoin technicals remain bearish with price currently trading into major resistance. After a record breaking 9 weeks of down only, it’s good to see the market staged a relief rally this week. If this continues past the mid-$30Ks, we will have some convincing technical evidence for a bottom. Until then, caution is justified.
Content we love
- Greg Foss’s deep dive into debt markets and his very high fair value calculation for Bitcoin
- Bridgewater’s update from early May – which suggests the Fed may still be far from a stance change:
“There is an extreme asymmetry between the ability to tighten and the ability to ease. MP3 [quantitative easing] is no longer available until either economic growth or inflation is much lower, because the high level of inflation is producing political problems.”


3 Responses
Thank You very much for the time and people that are involved in a incredible newsletter.
Hi Charles,
Great writeup. What is the monthly and weekly order block you show on your charts with respect to resistance levels?
@Brian: order blocks are terminology for support resistance levels based on historic candles of significance. Usually where measurable volume changed hands and there are candles that have opposing direction, creating a consolidation in the chart. For this we used weekly and monthly candles to identify the relevant regions which we believed are the major levels.