Welcome to Capriole’s micro update. Where we consolidate the most important Bitcoin news, technicals and fundamentals into a 3-minute update. Two technical charts, two fundamental charts and our chart of the week.
30-second Summary
We wrapped Update #1 with a bearish outlook across both technicals and fundamentals at $30.1K. As of writing Update #2, Bitcoin is down -4.5% with the low timeframe range support at $30K failing last week. This was a technical bearish confirmation. Further, over the last week our pure fundamental Bitcoin Macro Index algorithm has seen an increasing rate of contraction. Not good.
At the same time that Bitcoin has been faltering, the S&P500 has had its longest winning streak in years and the Fed has essentially paused rate hikes at what is now the tightest monetary policy regime on record. In essence we are at a macro pivot point and (all else equal) entering a new monitory policy regime which should be more favorable for Bitcoin over the coming years. This is a positive backdrop for Bitcoin. But today the technicals and fundamentals are telling us “not yet”.
We may just need to wait out the summer lull and a positive trigger such as the Blackrock ETF approval.
The Technicals

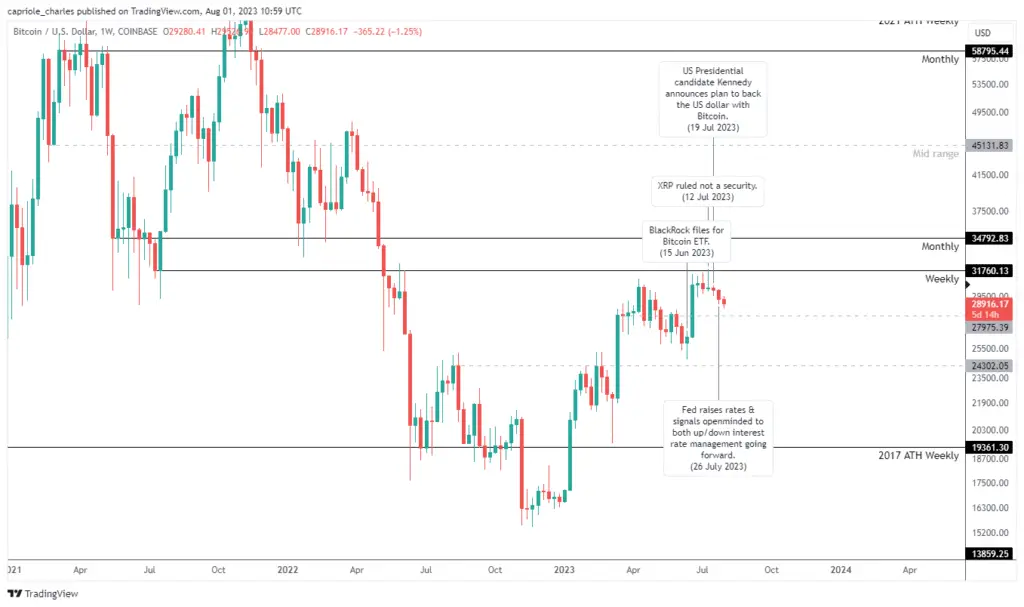
High Timeframe Technicals: Bitcoin is trending down from resistance amid a favorable macroeconomic backdrop. The next support levels are $28K, $24K and low-$20Ks; with each offering significantly better relative opportunity. Interactive Chart here.

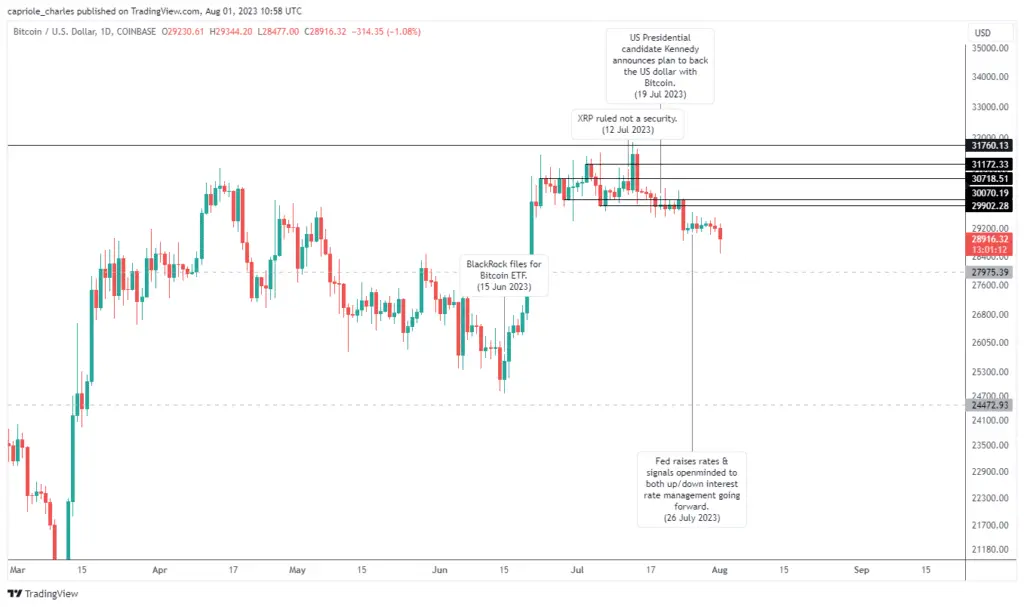
Low Timeframe Technicals: Breakdown! Support at $30K failed and a new bearish trend has emerged. This is a low timeframe Wyckoff distribution. If the magnitude of the downswing matches the upswing, the target of this move is circa $25K. Interactive Chart here.
Fundamentals and Value
Price is only half the picture. What about on-chain flows? What are retail and institutional investors doing with their capital? Is the mining network and security growing? How can we incorporate macroeconomic changes, equity market risk and broader market sentiment into Bitcoin? Finally, how do all these metrics compare on a relative basis to prior Bitcoin cycles?
We believe the full picture of fundamentals is best summarized by Capriole’s Bitcoin Macro Index.
Over 40 of the most powerful Bitcoin on-chain, macro market and equities metrics combined into a single machine learning model. This is a pure fundamentals-only value investing approach to Bitcoin. Price isn’t an input.
Current Bitcoin Macro Index Score: -0.23 “Contraction”
Bitcoin Macro Index: The Macro Index today remains in a period of relative value (below zero), suggesting decent long-term value for multi-year horizon investors. However, the Index has seen fundamentals erode at an increasing rate over the last week validating low exposure to Bitcoin.
Our interpretation: long-term bullish, short-term neutral
If you like the Bitcoin Macro Index, we share a weekly update of the of it and the Ethereum Macro Index here.
The Capriole Fund actively trades the Macro Index model on a daily basis, but what we present here is updated on a semi-static, weekly basis.
Chart of the Week
I published a new open-source algorithm last week which values the S&P500 using three fundamental datapoints only. It has a r2 of 90% since 1965. So it’s very accurate historically.
The model is very simply the summation of: the daily growth rate in GDP plus Money Supply less Interest Rates. That’s it.
It tells us that despite the surge in the S&P500, markets are fairly valued today so we should be openminded about both positive and negative outcomes. Either way, the picture is definitely not as bearish as many would have you think the recent rally is. On the contrary, with the Fed’s macro pivot essentially confirmed there is plenty of room for more upside.
You can read more about the derivation of this model here.
We are also sharing the live chart for you to monitor here.
The Three Factor Model presents a fairly valued equities market with plenty of leeway for continued momentum.
Bottom-line
Last update technicals and fundamentals told us to be cautious with Bitcoin. Caution has now turned into bearish confirmation with the $30K range breakdown. We are in a new downtrend until technicals or fundamentals prove otherwise. The nearest points of technical opportunity are $28K (average), $25K (good) and $21K (better), or a daily close back into the $30K range. Happy hunting.

Charles Edwards
Founder
Capriole Investments Limited
PS: see also my recent interview with CoinTelegraph here.


