The Greatest Inflation Hedge Ever
Welcome to Issue #37.
It never rains but it pours. This is our second newsletter in the last week. If you haven’t caught it yet, check out Issue #32 our deep dive into macro markets and how risk assets are setting the stage for the next year in Bitcoin. Alternatively, if you’d like a 2-minute market update with your morning coffee, check out our latest bi-weekly Bitcoin update here.
We are a quantitative Bitcoin and digital asset hedge fund. We deploy autonomous, risk-managed algorithms that trade to outperform Bitcoin. In our long-form newsletter (written opportunistically) we share important industry updates, explore major trends and review the technicals and fundamentals as they relate to markets and Bitcoin. Our aim is to help dissect the noise, distill the most relevant data and help expand the field of digital asset research.
This issue we present the case that Bitcoin is progressively pricing as a better-and-better inflation hedge. Why Bitcoin is rapidly skewing in favor of an incredibly good risk : reward opportunity and why we expect that opportunity to resolve in 2024.
Bitcoin as a hedge
Bitcoin gets a hard rep for its performance coming out of 2021 amidst growing inflation. Many people point to the large downdraw and say Bitcoin failed as an inflation hedge. But that’s incorrect. Bitcoin was a great inflation Hedge – it was when it needed to be.
Bitcoin rose 1000% in the 12-month period from Q1-2020 to Q1-2021, outperforming all other asset classes by a mile. It performed exactly as an inflation hedge should, rallying from the start of the liquidity boom. Markets today move incredibly fast and are forward looking. As soon as macro announcements are made, the pricing-in begins. This is exactly what happened in 2020 when the Fed announced its multi-trillion-dollar QE packages in March.
In other words, you want to hold inflation hedges before the inflation event, just as you want health insurance before you have a car crash. Hedges work best if you are in position before you need them. Bitcoin rode a giant wave of liquidity from the moment QE was announced in 2020 through to the Fed’s pivot in Q4-2021, delivering a whooping 10X. Over the same period Gold returned just 10% at its peak, while the USD money supply alone ballooned by over 25%. It’s only in recent months that we are seeing those levels of inflation in our everyday groceries; but the causal effect began with the Fed in 2020.
There is no doubt that Bitcoin dominated the crisis as the best inflation hedge.

There is no second best. Bitcoin was the greatest inflation hedge we have ever seen.
If we look at the below chart, we can see that in recent times Bitcoin takes about 12-months to fully price in policy announcements. Something to keep in mind for the next time we have a major macroeconomic change in the air, ala the next pivot.

The hardest asset known to man
The upcoming Bitcoin Halving in April will drop Bitcoin’s supply growth rate to 0.8% p.a. and below that of Gold (1.6%) for the first time ever.
In April 2024, Bitcoin will for the first time become harder than Gold. Bitcoin’s supply growth rate will be twice as slow as gold’s, making it quantifiably the best liquid inflation hedge commodity known to man.
But that’s just the beginning of course. Every 4 years from here on out Bitcoin’s inflation rate will asymptotically approach zero.
This makes the April 2024 Halving the most important date in Bitcoin’s history since its Genesis Block in 2009. This halving is Bitcoin’s event horizon.

But isn’t the Halving priced in?
If there is one thing we have learnt from Bitcoin’s past it’s that the halving is never priced in. 80% cycle drawdowns have a tendency to reset things and exterminate all interest in Bitcoin (it feels like we are there now). The level of pain that long-term holders have to go through in this asset class is second to none. But volatility is the price you pay for the largest average annual returns of all asset classes. The 4-year cycle is genius for this very reason in subverting attention and navigating the human emotion cycle.
Secondly, the Halving cycles are still very much intact. Many on chain metrics confirm we are in the exact same position today as we were in 2019 and 2015 before that. Some of the metrics later in this newsletter will paint the picture for just how similar this cycle has been to those of the last 14 years of Bitcoin history.
The following chart shows the returns of each cycle from the Halving Date. All of which occur within 12-18 months of the Halving date.

Bitcoin is ready for major capital flows.
Unlike 2019, the stage today has been set for major capital flows in 2024.
In 2021, Bitcoin was ruled by the CFTC as a commodity. It’s no longer in the gray zone, regulation is clear.
In June this year we had the massive announcement of Blackrock’s Bitcoin ETF application, followed by similar announcements from a half-dozen other leading US financial institutions. Blackrock has a 99.8% success rate in ETF approvals. Given their intrinsic link with Government agencies, their pending approval is only a matter of when, not if.
To add further weight to this, on 29th August the federal appeals court ordered the SEC to “vacate” its rejection of the Grayscale spot ETF in a major win for the Bitcoin industry (and plainly, for logic). This is the second such major battle the SEC has lost in the courts against crypto recently. Their unjust barring of spot Bitcoin ETFs for years, while still allowing leveraged futures Bitcoin ETFs and their schizophrenic take on whether or not crypto assets are securities or not is finally sunsetting.
The next important SEC dates for possible spot ETF approvals are 16 October and 14 January, with the final deadline next March. My base case expectation is it will see approval in either October or January.
All of this means the on-ramps into Bitcoin will be greater than ever before.
The impact of ETFs
What is the most similar asset to Bitcoin? Gold.
What happened when the Gold ETF launched? In November 2004, Gold was in a bear market, down -50% (much like Bitcoin is today). When the Gold ETF approval hit, what followed was a massive +350% return, seven-year bull-run.

So, we have three incredible catalysts on the very near horizon:
- The best inflation hedge and hardest commodity known in a macro environment with the tightest economic conditions on record which is primed to pivot.
- Institutional regulatory status and on-ramps with imminent ETF approvals by the SECs
- The Halving event, forecast for 16 April 2024.
All three of these catalysts have historically resulted in multi-hundred-percent returns in their own right. Together they present a very powerful concoction for 2024 and a compelling long-term investment thesis.
A win-win
Whether or not a beautiful deleveraging or a soft landing is engineered, Bitcoin has incredible catalysts in 2024. If risk assets continue to rally, Bitcoin has the Halving and ETF plays. If markets crash on rising unemployment or collapsing consumer spending, the Fed will deploy its war chest; and inflation hedges will rocket.
With Bitcoin’s market capitalization being just 5% of Gold’s and Bitcoin being twice as scarce, you can expect Bitcoin will probably capture 95%+ of the returns in the next liquidity crisis (just as it did in 2020). This puts Bitcoin today in the best cyclical and macroeconomic place it can be, and easily the best positioning it has been since March 2020.
Positioning
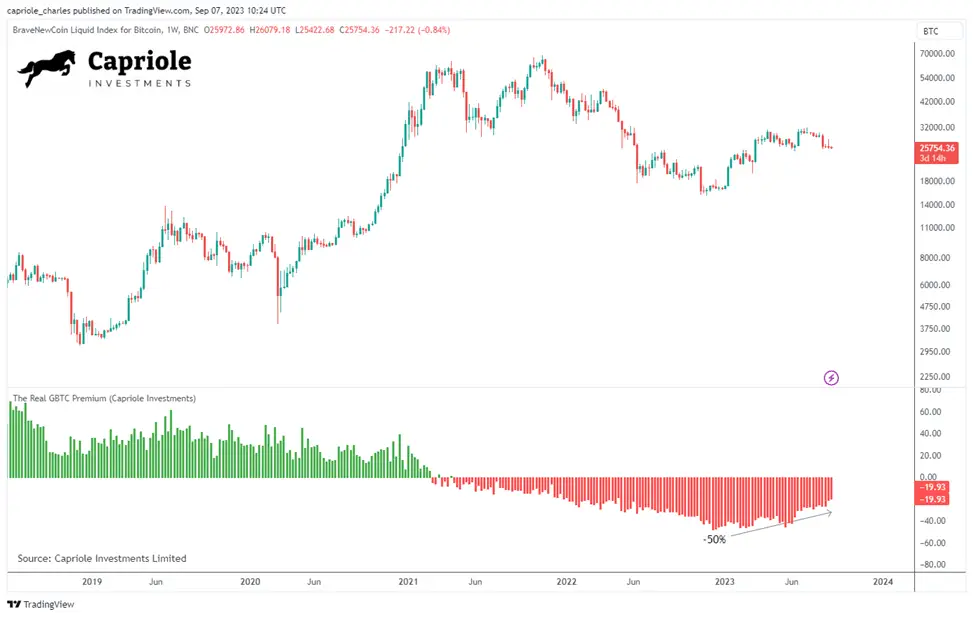
Global sentiment towards Bitcoin has improved a lot this year. The Grayscale Bitcoin trust (GBTC) discount is a great barometer for institutional interest. It has gone from -50% in December to -25% in August. Then on the court ruling in August, this discount collapsed to just -17% in a matter of hours. So, while Twitter can seem very quiet, we have seen important recovery and healing taking place. Given the level of 2022’s fraud and chaos, this is a great turnaround.
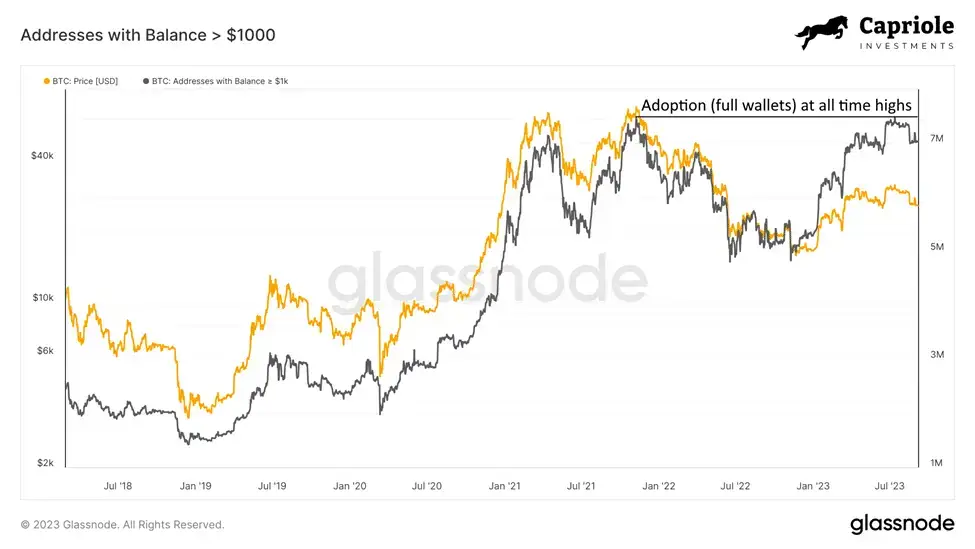
We have also seen growth in Bitcoin adoption over the last year.
The number of addresses with a balance of over $1000 is currently approaching all-time highs.
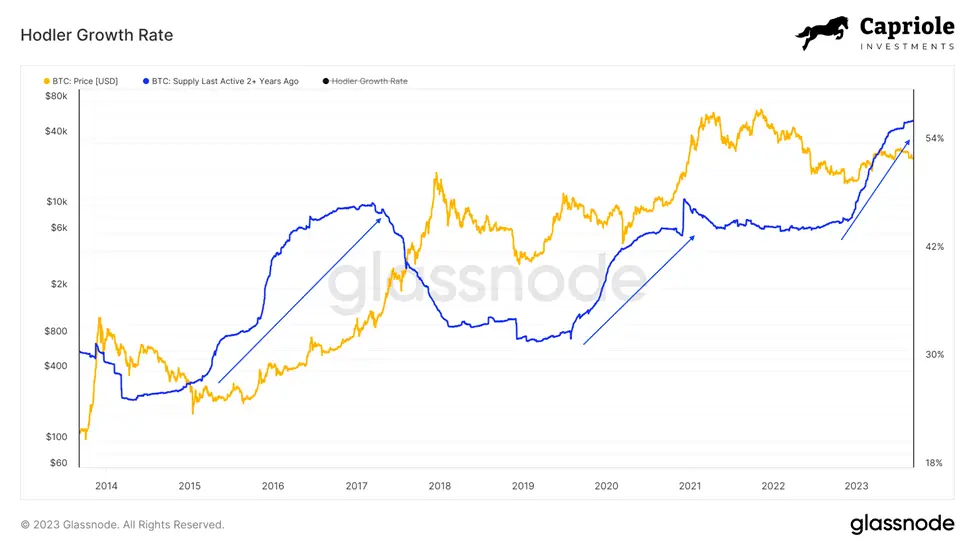
The number of long-term Bitcoin hodlers continues to hit new all-time highs. Over 57% of Bitcoin in network having not moved their capital in over 2 years. They are accumulating for the next bull run.
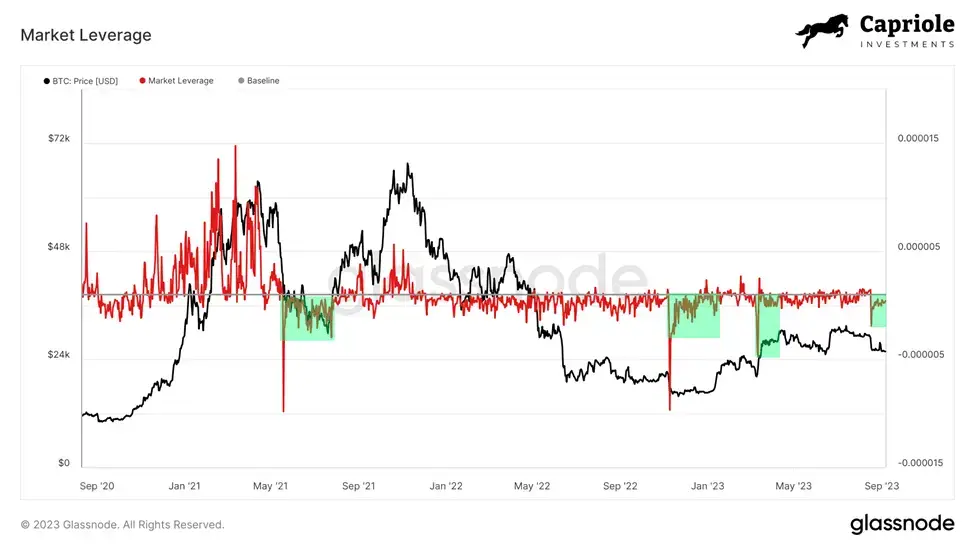
The crash to $26K also saw Capriole’s Market Leverage ratio collapse and funding rates turn negative. A healthy flush which often signifies market turning points.
Our Dynamic Range NVT Signal also dropped into an undervalued zone recently. Suggesting growing long-term value opportunity, but also one which could potentially see greater value yet.

All these metrics are setting up for a long-term supply squeeze in 2024.
Net Fundamentals
Nonetheless, net fundamentals remain in a contractive downtrend as we have discussed since Bitcoin was at $30K in our bi-weekly updates (latest Update 4 here). Our Macro Index model assesses over 40 on-chain and equities market metrics and passes them through a ML model. Today, it’s still bearish.
As a result, and along with other models, our fund went to cash and was net short in the drop from $29K to $26K in August.
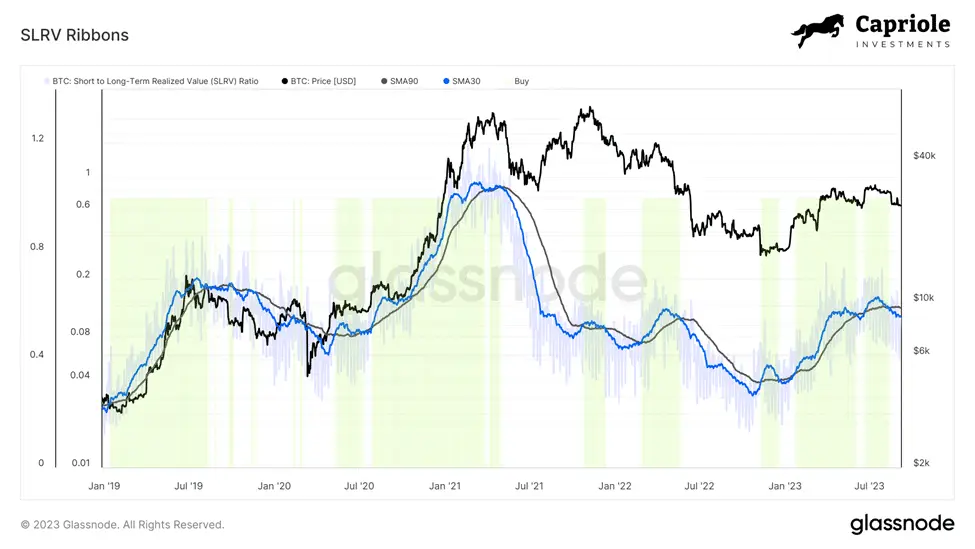
Some examples of the bearish fundamentals we are seeing today include SLRV Ribbons.
Capriole’s SLRV Ribbons maps the ratio of coins that moved in the last 24 hours to the last 6-12 months. When we apply moving averages (ribbons) to this metric, it’s a great fundamental trend indicator for relative hype vs adoption. This metric crossed bearish at $30K.
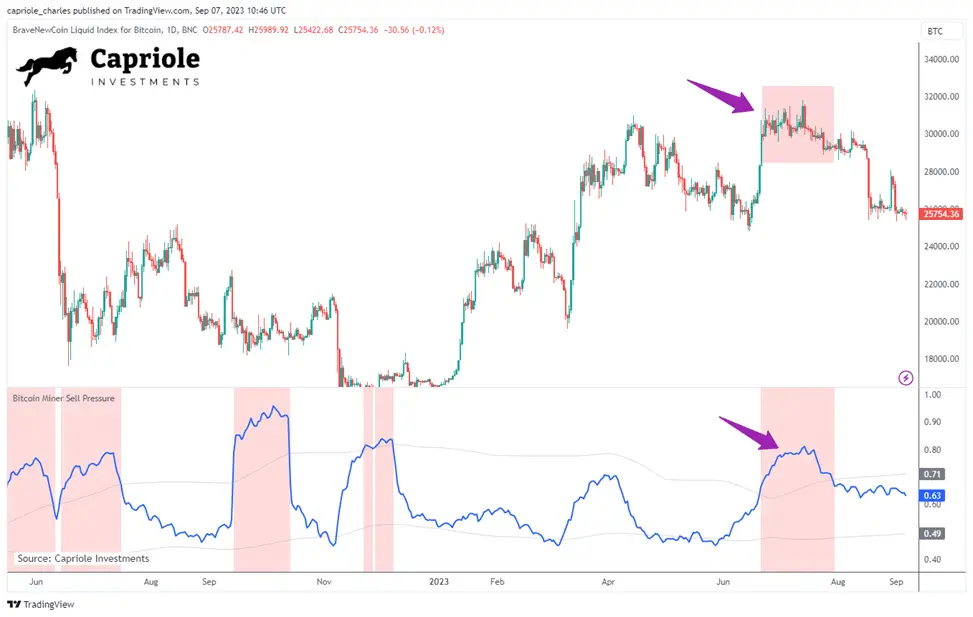
Bitcoin miners also went on a selling spree at $30K, with Capriole’s Bitcoin Miner Sell Pressure indicator spiking into bearish territory as miners looked to secure profits at some of the highest prices in the last year.
We also saw Bitcoin dominance drop at the $30K mark. A sign of growing speculation and typically a good risk-off flag in Bitcoin bear markets.
Chart of the Month
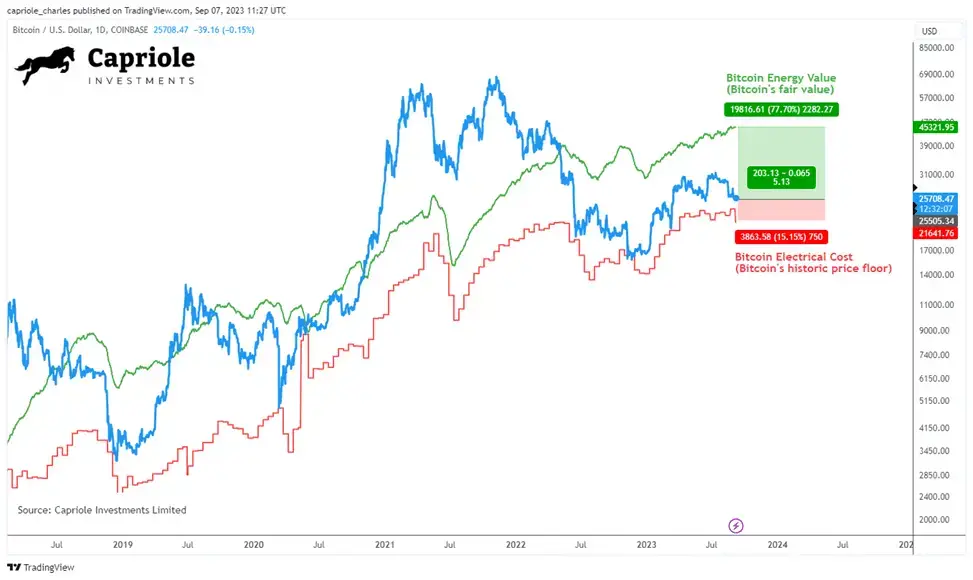
I will leave you with just one chart which perhaps is the most important chart in this Newsletter.
This chart shows you exactly where the risk and opportunity are today.
Bitcoin’s Electrical cost, the raw electricity cost of mining Bitcoin and its historic price floor, is trading a mere 15% below price. Meanwhile, Bitcoin Energy Value, the fair value of Bitcoin is trading at over $45K.
That’s a 5:1 risk-reward assuming no-hype and that price would stop at fair value, which it never has.
The Bottom Line
With price in the vicinity of Electrical Cost at $22K we are close to the phenomenal buy zone. And extraordinary long-term Bitcoin value for this stage in the cycle.
Bitcoin Energy Value, Capriole’s measure of fair value is a massive 75% higher than price, that’s a long-term discount opportunity that doesn’t come often.
Most fundamental metrics are showing readings of long-term value today. Many are showing all-time highs in terms of adoption. However, the aggregate picture as shown by Capriole’s Macro Index is still in a downtrend and needs to see some improvement before we can expect to see a sustainable market turnaround. It’s very typical of the 6-9 months pre-Halving to see sideways price chop and complete apathy. That’s where we are today. Should the opportunity present itself to revisit the low $20Ks, I would be very excited for one last chance to dip into the candy store before 2024, but that very well may not happen.
In Bitcoin’s four-year cycles, there’s typically 12-18 months where 90% of returns happen, followed by 2-3 years of sideways and down. I am expecting that the single highest returning year of this cycle will be 2024 and I believe the data supports that thesis.
That begs the question, have you got insurance?

Charles Edwards
Founder
Capriole Investments Limited


2 Responses
A+++ Analysis! Thank you!
Cheers Yahtzee, glad you liked it!