

The Cycle Top
As we approach Q4 2025, we’ve been getting questions on how we think about identifying the Bitcoin cycle top and managing positioning and risk. This issue we explore some summary thoughts and metrics which we find useful to navigate the Bitcoin cycle accordingly.
Is the cycle dead?
As discussed a couple times over the last year (including this podcast), there is growing evidence for diminishing peaks and troughs in the Bitcoin cycle going forward. To date, each 4-year Bitcoin Halving cycle has seen smaller maximum drawdowns and Bitcoin’s volatility has declined year-over-year. A key driver of this shift is the significant reduction in Bitcoin’s supply growth rate. Since the 2024 Halving, Bitcoin’s annual inflation rate has fallen to 0.8%. Less than half of Gold’s 1.5–3%. This made Bitcoin the hardest asset known to man, with look-ahead certainty.
In 2028, Bitcoin’s inflation rate will drop again to 0.4% and continue halving every four years. All of this means Bitcoin miner impact on supply and demand are largely a relic of the past, curtailing the impact of large miner capitulation events which drove price down, and eliminating the risk of miner driven supply saturation at elevated market caps. As a result, we might expect smaller cycle drawdowns going forward under “normal” conditions (i.e. significantly less than 80% every 4 years) as a result of this structural change and the “decoupling” of price from the 4 year Halving cycle.
In short – the primary driving force behind Bitcoin cycle 80-90% drawdowns historically is dead.
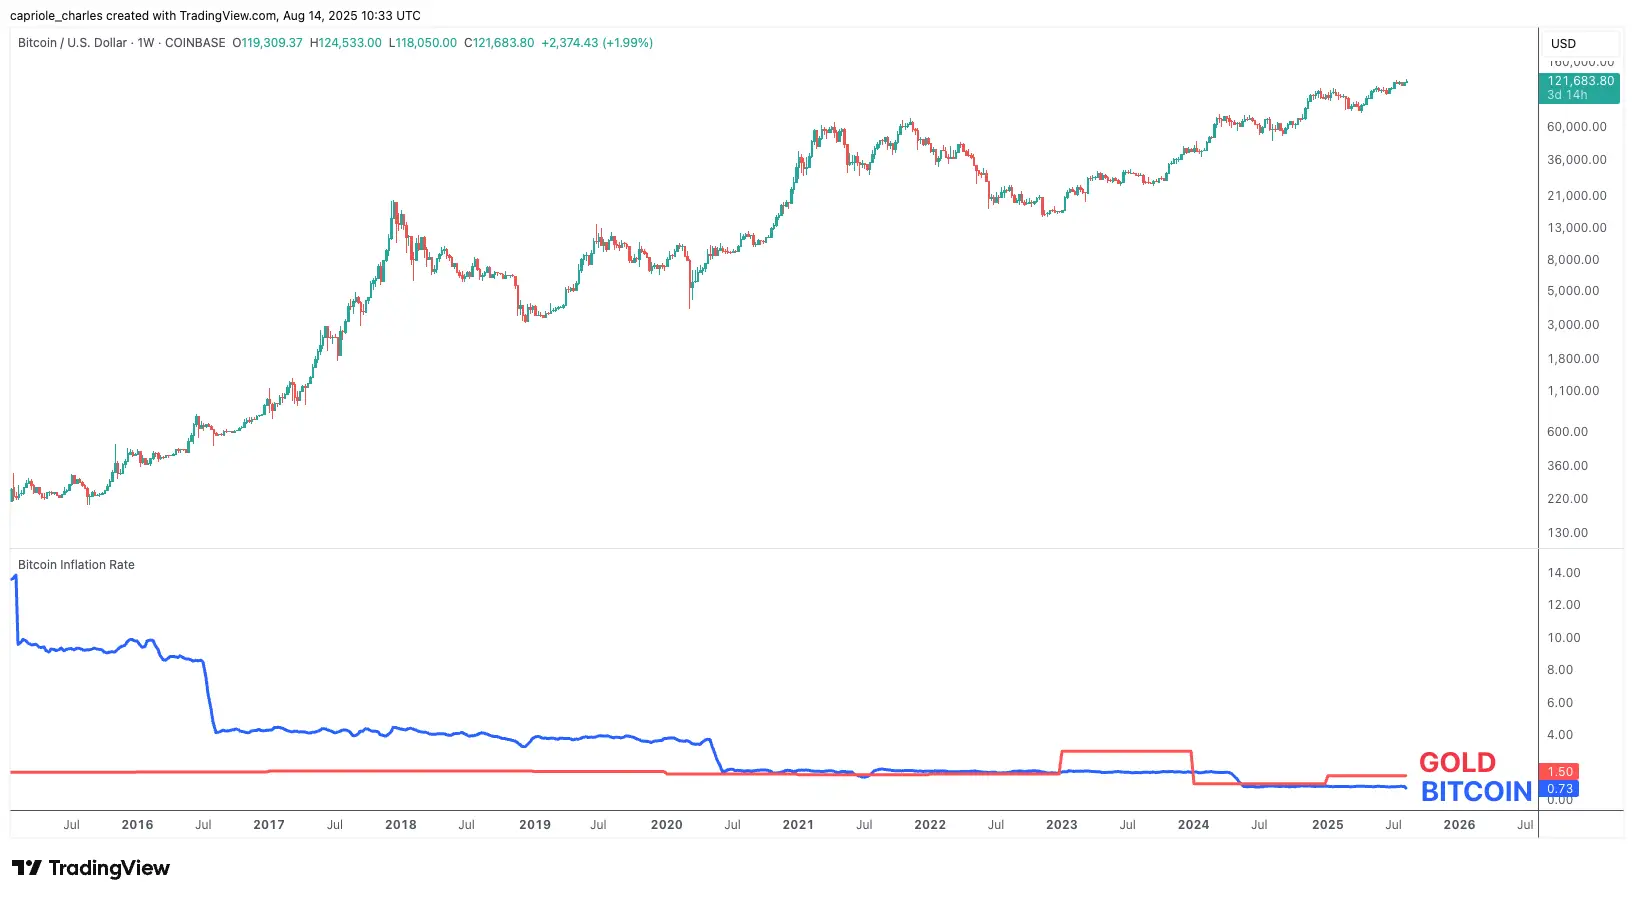
The Supply Growth Rate of Bitcoin has dropped from 10% p.a. a decade ago, to just 0.75% today (less than Gold), diminishing the impact that miners have on market prices.
Causes of a Bitcoin cycle
We believe the mining supply impact alone is the biggest factor that drove the Bitcoin cycles in the past, but there are other influencing forces. Some of the following factors could reinforce or trigger a major cyclical drawdown event in the future:
1. Self-fulling Prophecy
If enough Bitcoiners believe in the 4 year cycle (and many do), they will structure their investing activities (buying and selling) around it. This intangible factor alone could be enough to see substantial de-risking and trigger sizeable drawdowns. Cue George Soros “Reflexivity” theory for markets: over time market participant actions influence fundamentals, and fundamentals then further influence participant actions.
2. Macro Liquidity Cycles
When the year-on-year change in the Global M3 money supply is in expansion (greater than 0) we have a positive liquidity environment conducive of price expansion. We can take this a step further and deduct the cost of debt (using US 10 Year Treasuries as a benchmark) to get a better idea when global markets are seeing liquidity expansion and contraction. We call this “Net Liquidity“. Simply put: when more money is being injected into the system, and it is outpacing the cost of debt capital, market participants tend to pump that fiat into assets like equities, Bitcoin, gold and real-estate. You can see it on the below chart. All of Bitcoin’s historic bear markets have occured while this metric was declining, with the depths of all of Bitcoin’s deep bear markets occuring while this metric was less than zero. All of Bitcoins historic price appreciation occurred during Net Liquidity expansion phases (green shading). You can track Net Liquidity live here.
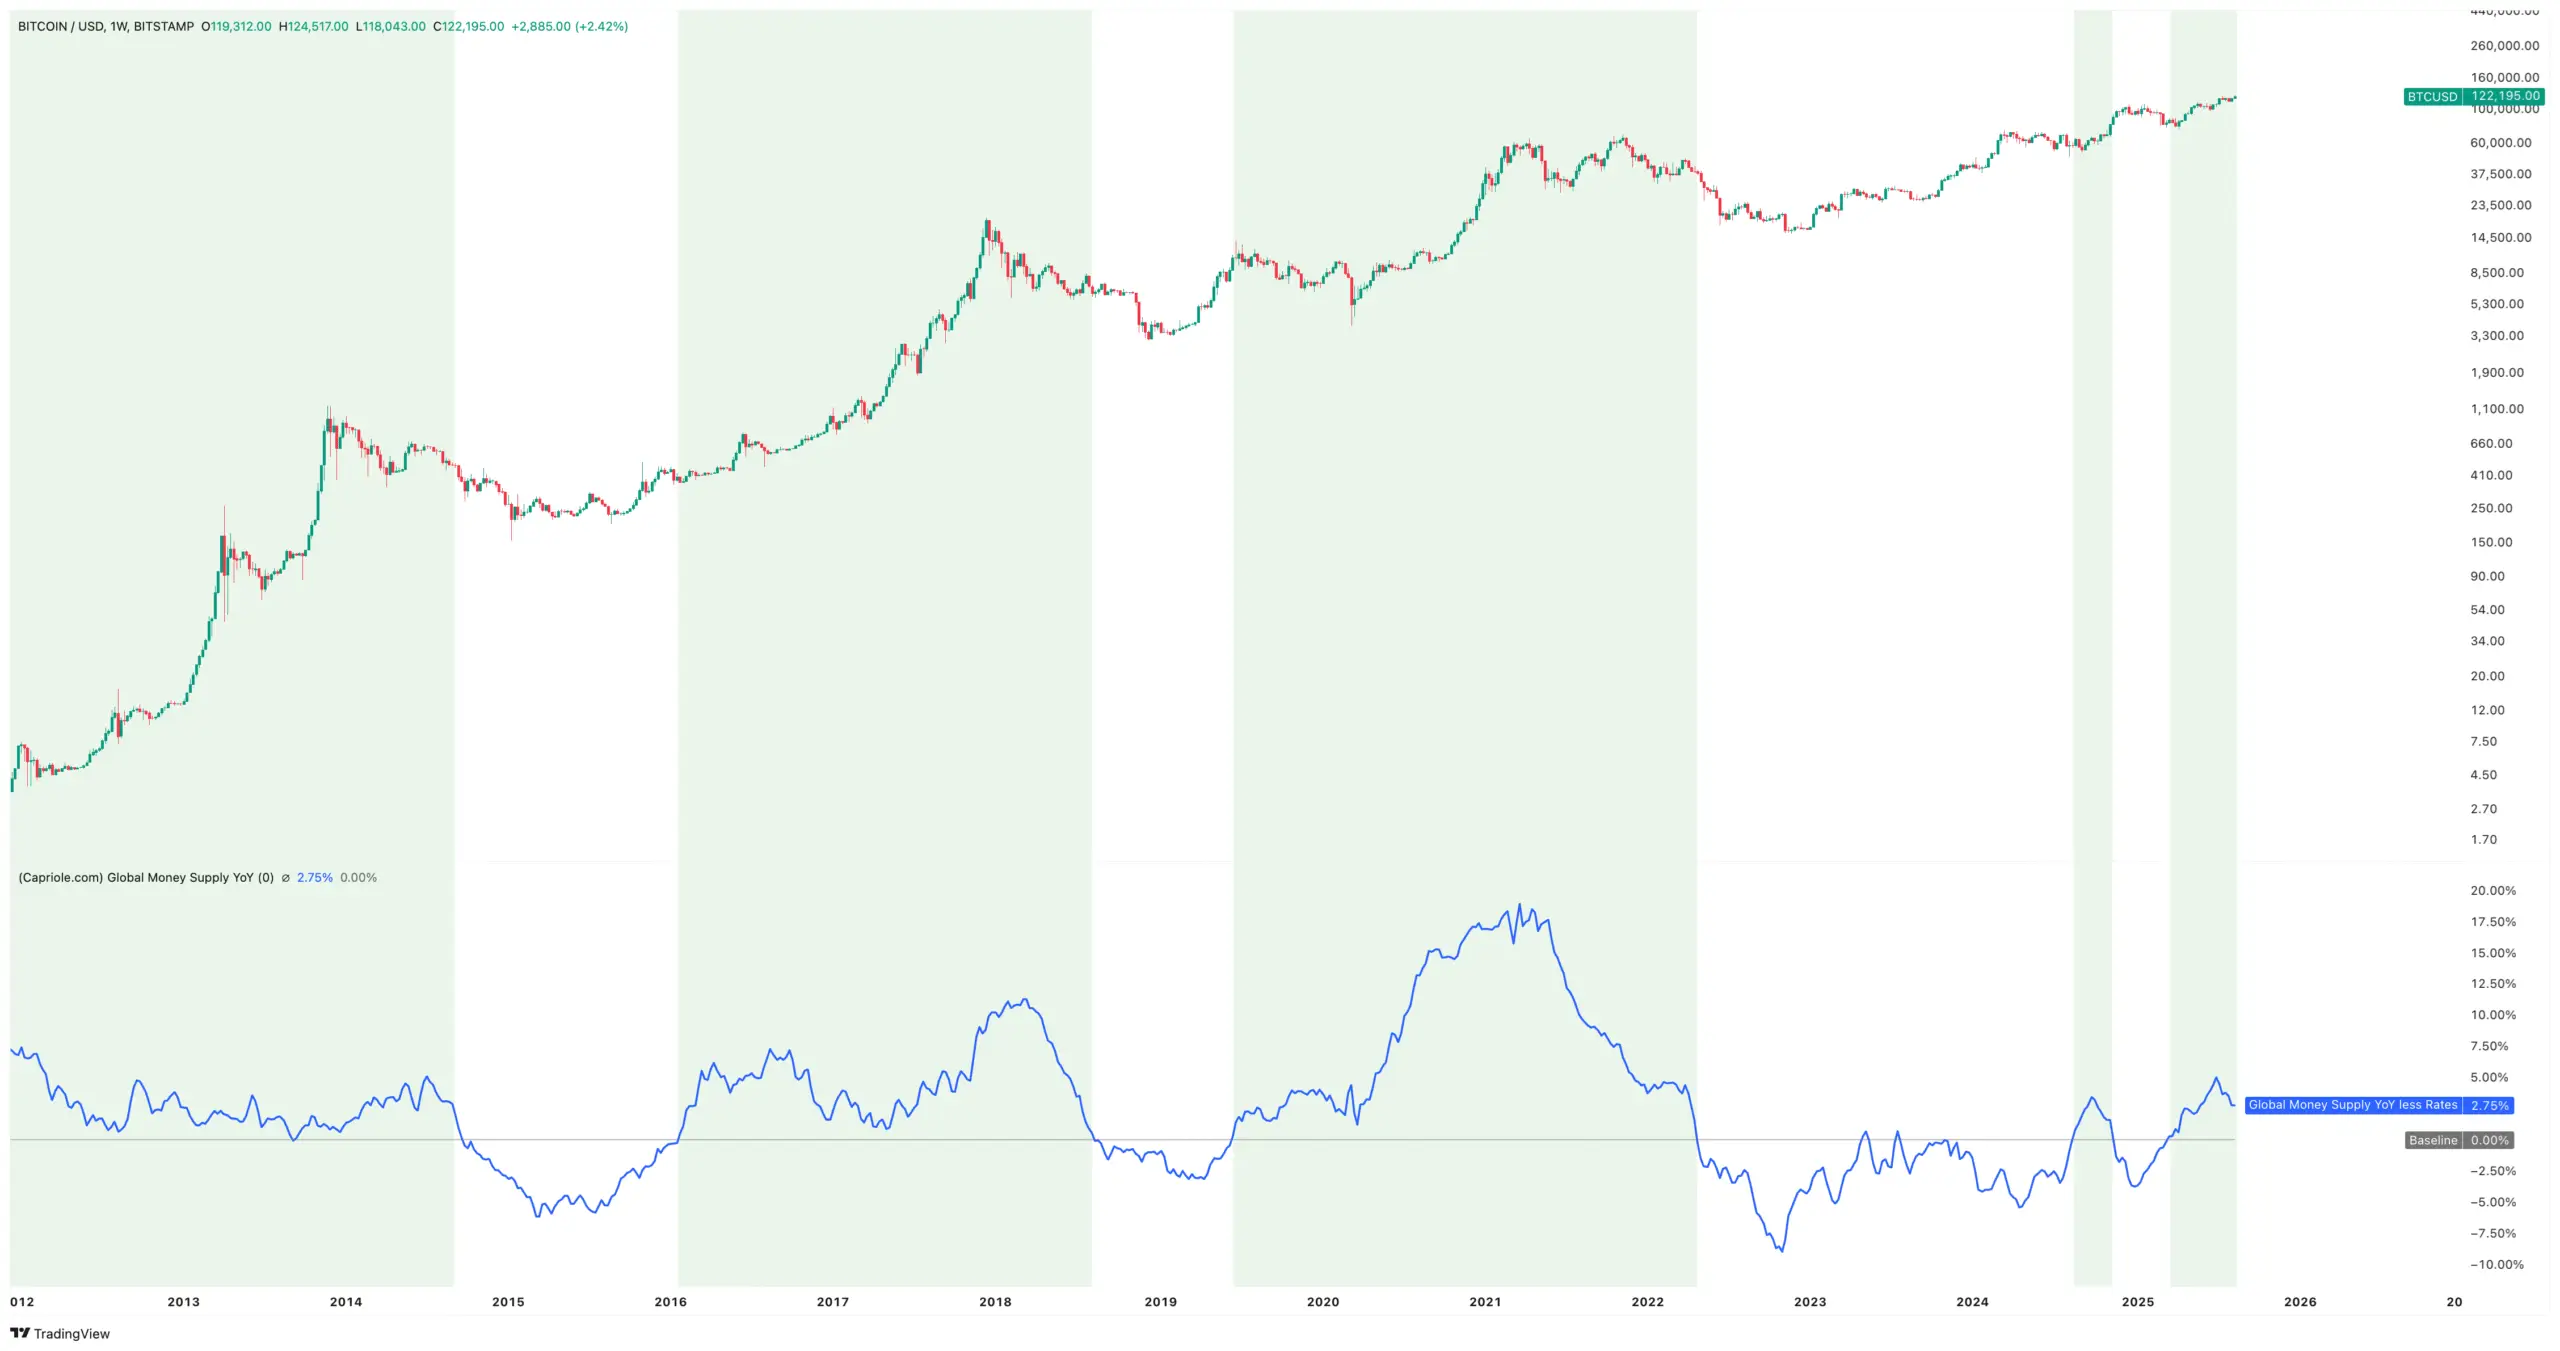
All of Bitcoins major bull runs have occured in positive Net Liquidity environments (Growth in global money supply YoY less Interest Rates). All of Bitcoins deep bear markets have occured in contractive liquidity environments. We are currently in a positive liquidity environment and the Fed is now forecast to cut rates 3 times in the remainder of 2025.
3. On-chain Euphoria
There are many useful metrics to gauge euphoria for Bitcoin using onchain data. Classic metrics like MVRV, NVT and Energy Value spring to mind – but there are a lot more. When at multi-year extremes, these metrics broadly suggest that current market prices are (a) very high relative to the value that participants bought their Bitcoin at, (b) high relative to the value of transactions occurring through the Bitcoin network and (c) high relative to the dollar value of energy being committed to the network by miners. All prior cycle tops occured in the extreme range on these respective charts (see links above for details and descriptions on each metric). In 2025 we still see no signs of onchain Euphoria. Bitcoin today is appreciating in a steady, relatively sustainable way versus historic cycles. When euphoria occurs next, and these metrics start to flag accordingly, that would be strong evidence that prices will need to correct.
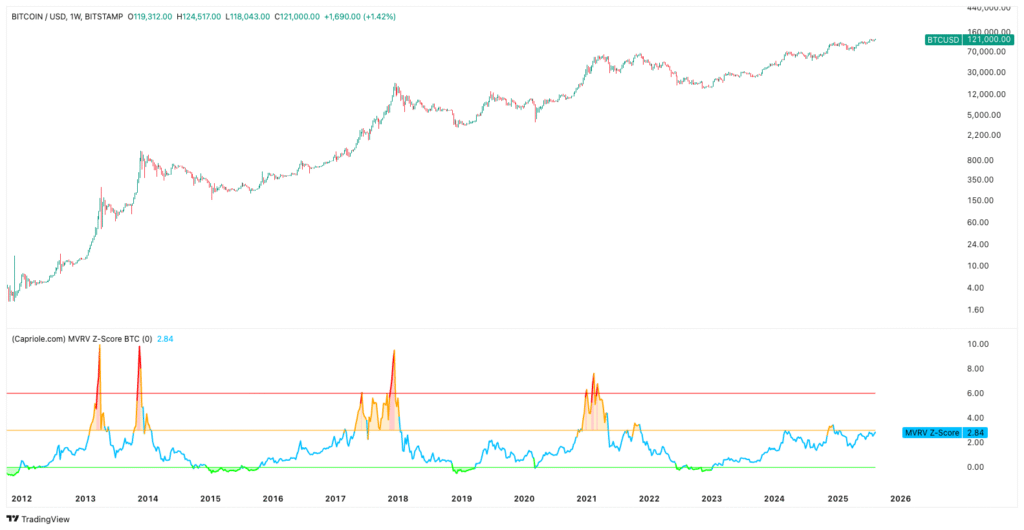
MVRV Z-Score, a powerful onchain Bitcoin signal, shows we are nowhere near the price euphoria of historic Bitcoin tops
4. Off-chain Euphoria
Euphoria can be measured many ways. Another great way to track it is across derivatives data. When market participants are extremely bullish on an asset, they will take on leveraged positions across Perpetual Swaps, Futures and Options markets. We track all of this in one metric, the Heater. High leverage and extremely bullish positioning across these markets results in the metric having high values (0.8 and above). It’s rare for Bitcoin to continue aggressive price appreciation while this metric is elevated, especially when Open Interest (OI) as a percentage of market cap is also elevated and rising. Generally speaking Heater (and other sentiment metrics) are useful for short-term risk off identification, but not necessarily indicative of major cycle tops. You want to see these kind of sentiment metrics in extremes for extended periods of time (i.e. the majority of a multiple month period) to historically assist in identifying a major top.
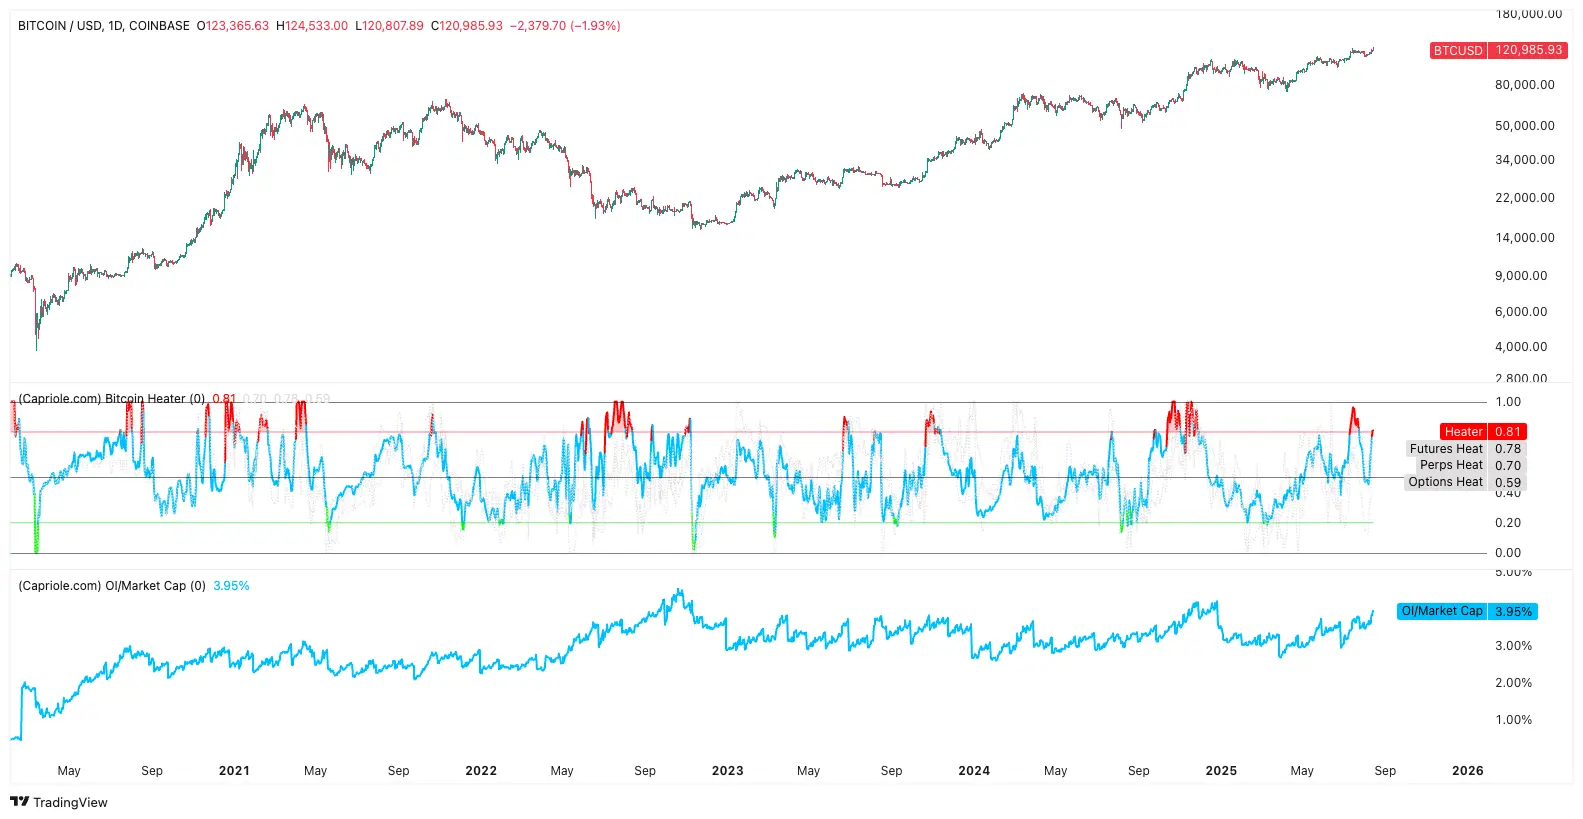
The heat is on. Capriole’s Heater is useful to identify euphoria across derivatives assets where traders are aggressively bullish (or bearish). Extended periods of time above 0.8 are a red flag. Of all the metrics we will look at here, this one is telling us that the market locally has overheated near all time highs this week.
There are many other metrics, social signals and other intangibles to monitor for increasing risk of a cycle top. I wrote a detailed article a couple years ago about some other usual signals to watch here. It’s also worth taking a closer look at the other Bitcoin and Macro charts here.
The most important chart
The above are important and extensive considerations, covering dozens of metrics. However, if we had to choose just one data point to monitor, we believe the single most important metric to monitor in 2025 and 2026 is Institutional Buying.
Today, 150+ public companies and ETFs are buying over 500% of Bitcoin’s daily supply creation from mining. When demand outruns supply like this, Bitcoin has historically surged over the coming months.
Every time this has happened in Bitcoin’s history (5 occurrences), price has shot up by 135% on average.
We are currently in an extended period of a high positive multiple. As long as we remain so, that’s good news for Bitcoin.
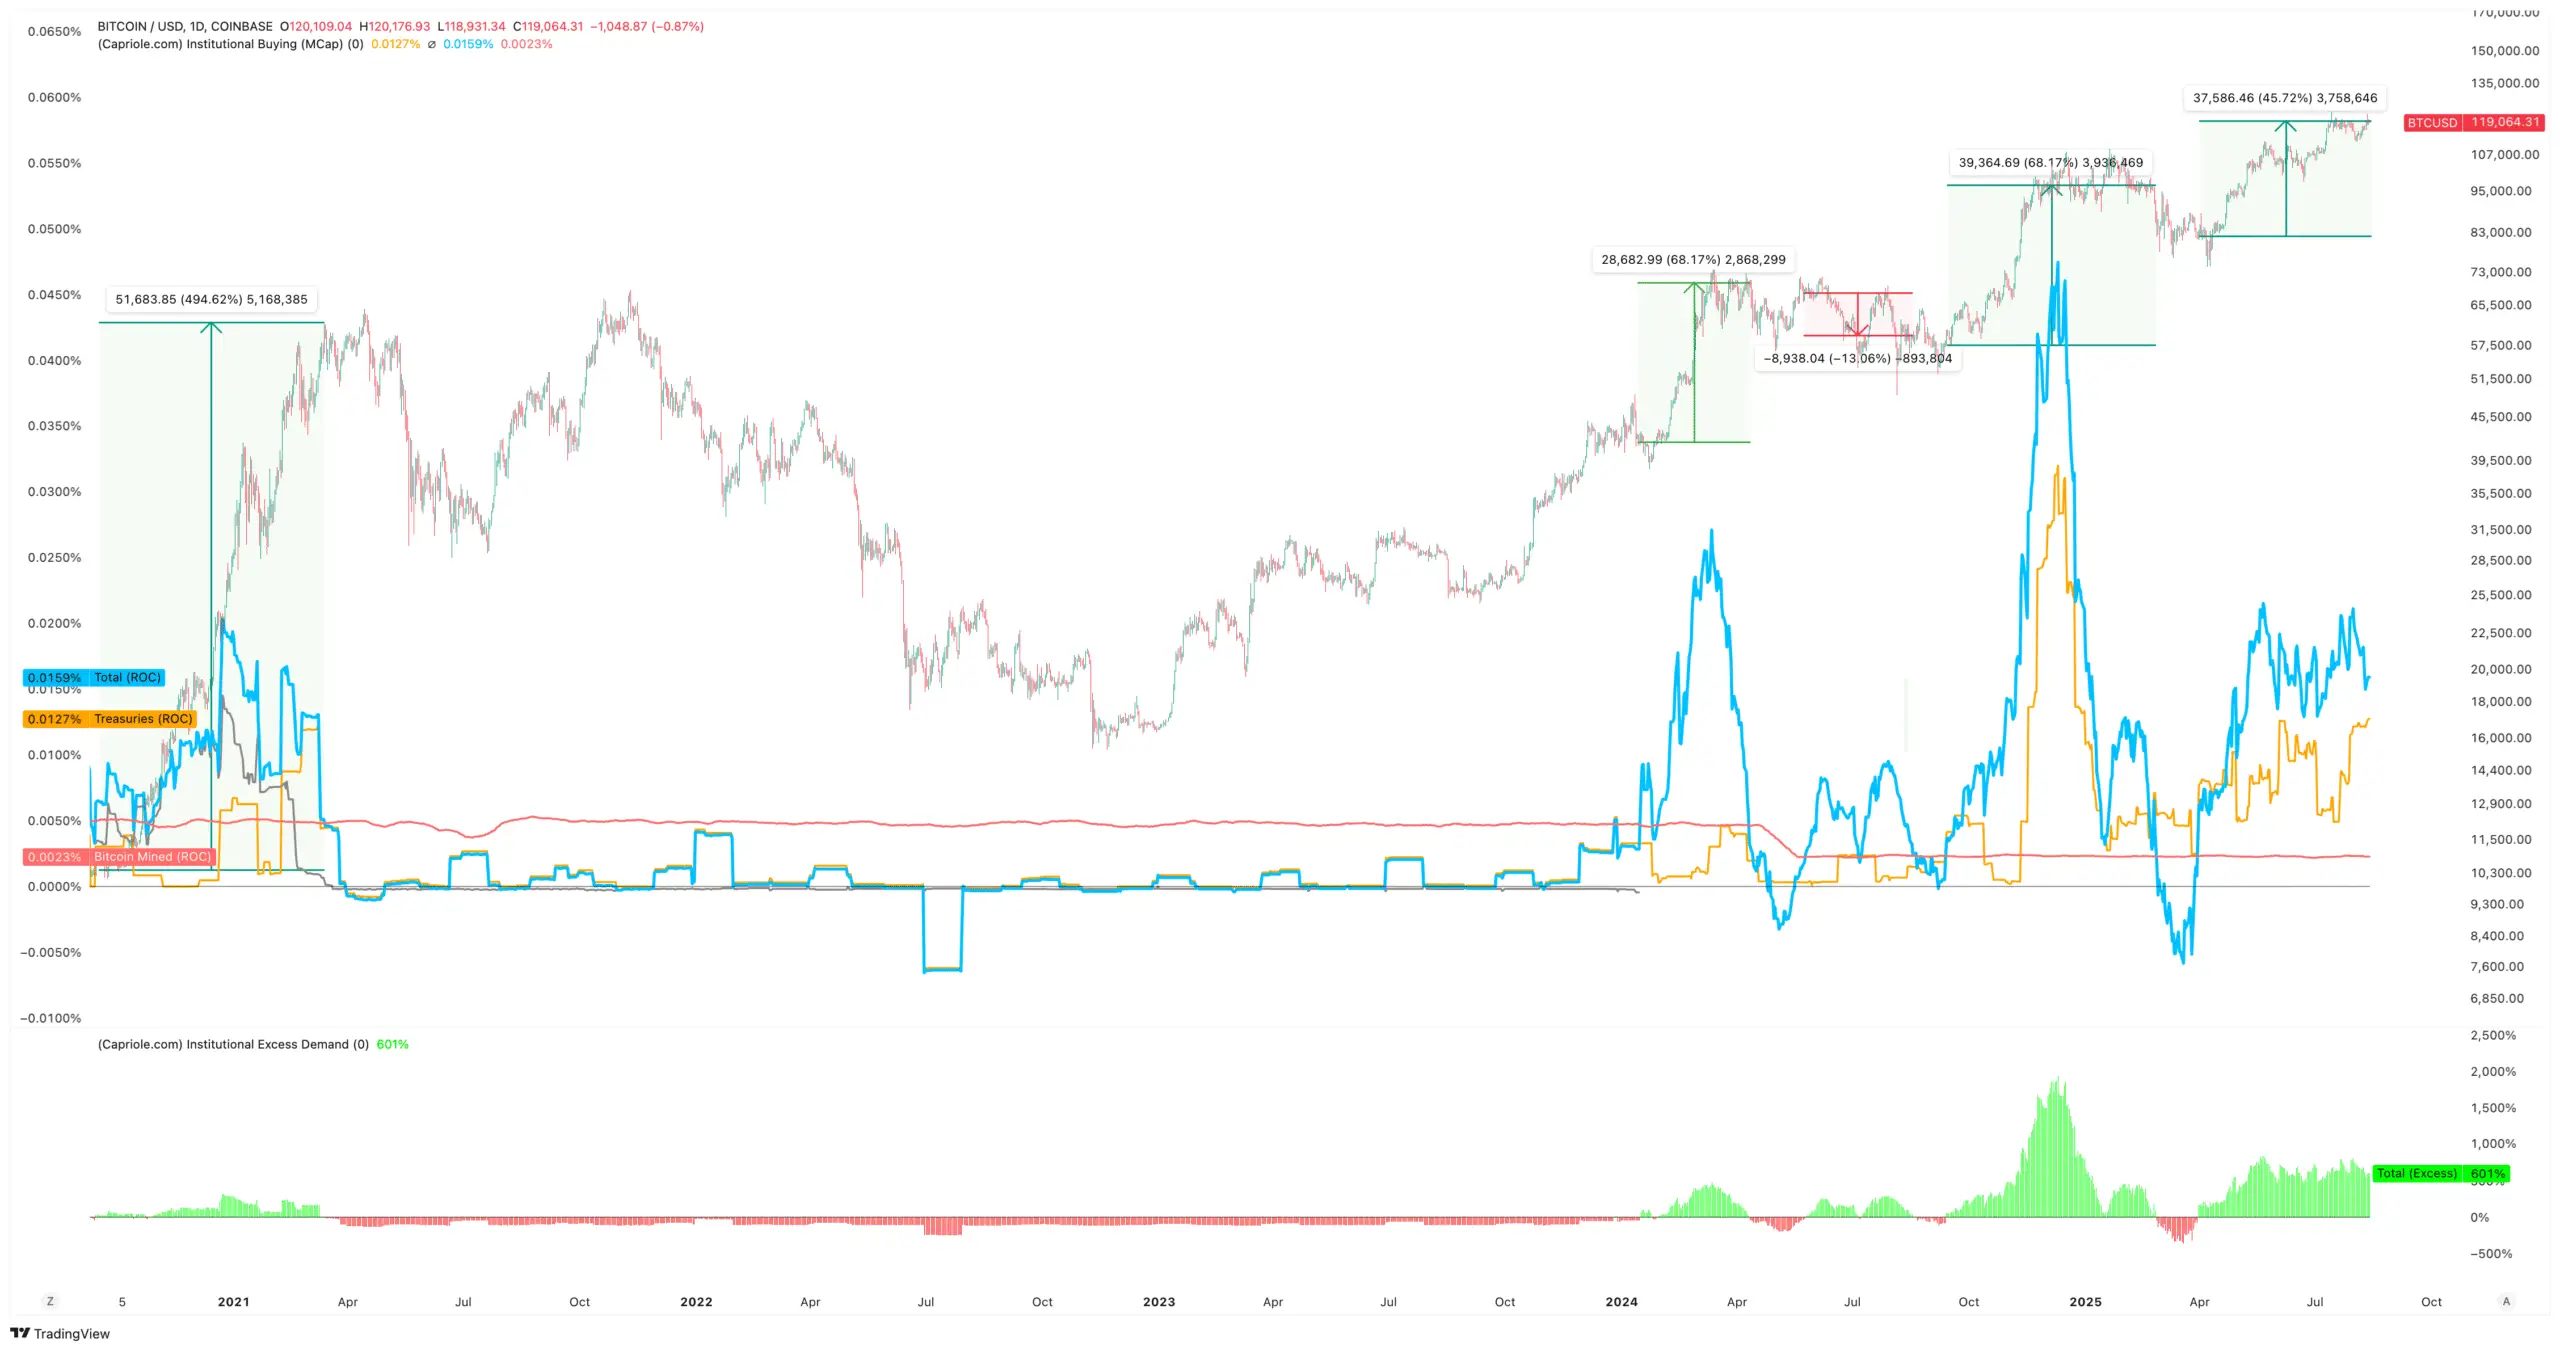
When Daily Institutional demand outstrips Bitcoin’s mining supply, Price rallies over 100% on average in the coming months.
While this is great news today, we cannot predict how long these conditions will last. The same goes for all metrics we monitor, which is why we take a dynamic approach to position sizing and risk management through cycles – we wait for the data to tell us if we are in a high risk zone (and therefore potentially late cycle). Otherwise, we are cycle agnostic.
As outlined in our last issue, there are many reasons to think 2025 may be in a right-translated cycle, with a significant period of price expansion still ahead of us.
Treasury company early warning system
While the Institutional Demand for Bitcoin today is overwhelming, it is also the number one metric to watch for a potential negative shift in institutional interest. Something we are systematically tracking 24/7 for cycle risk management and positioning purposes.
There are many other important metrics to monitor for potential shifting Institutional interest and growing risk that may shift the cycle into a downward spiral. These include:
- Treasury Buy-Sell Ratio: When this falls, it’s a red flag and suggests growing selling by the 150+ companies.
- Treasury CVD: when this starts to flatten out – or alternatively spike into the red zone – we have a risk off signal.
- Buying % Coinbase Volume: Similar to Institutional Buying above, but this can be more responsive.
- Treasury Company Seller Count: The count of companies selling Bitcoin. Definitely one to watch when it spikes.
Leverage Risk
Another very important factor to monitor is the risk these treasury companies are taking. Key here is the serviceability of their debt used to acquire Bitcoin. Total Debt relative to Enterprise value are key to track as a guide for this. If enough of the treasury companies over lever to grow their Bitcoin stack, the downside cascade could be more than sufficient to trigger a deep cyclical like Bitcoin bear market. So watch this space. We will be releasing Tranche 3 of Capriole Charts Bitcoin treasury company metrics next week to provide further insight into the risk each of these companies is taking with regards to debt and leverage.
Quantum Hedges
Followers will know we have a very positive outlook on Quantum Computing (QC). In fact we expect the asset class will outperform Bitcoin by circa 50% p.a. over the next 5-10 years. This forecast is based on the relative market cap of publicly traded QC companies being comparable to Bitcoin in 2015, and the addressable market size being in the $2T+ range over the next 5-10 years.
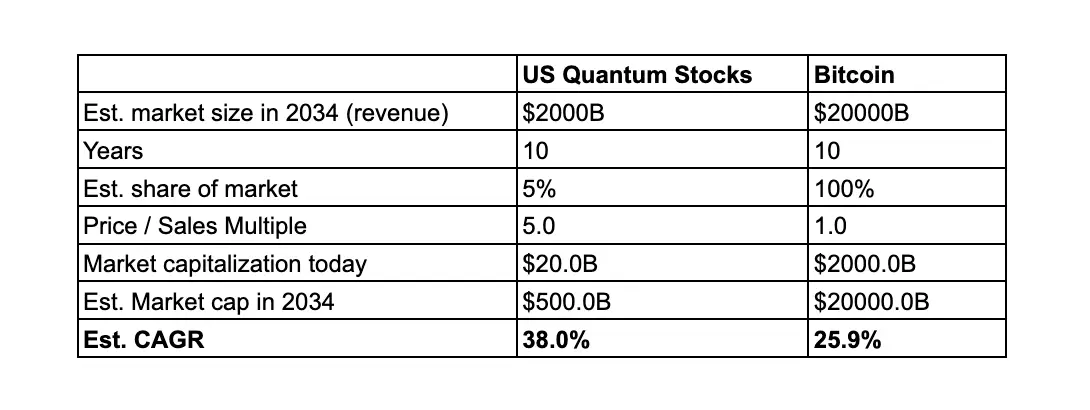
Quantum Computing forecast (outlined here) suggests QC annualised returns may be 50% higher than Bitcoin.
We also view QC as the biggest tangible threat to the Bitcoin network. In the long-term (without change) QC is existential to Bitcoin. This risk is easy to overlook. Many Bitcoiners brush off the QC risk as being 10+ years away. However, as we’ve written about before, Bitcoin’s security algorithm could be broken by a Quantum machine in 3-6 years in a worst case scenario. This is based on the current and projected growth rates in Qubits that QC companies themselves are forecasting, versus historical studies that have been conducted to assess the risk to Bitcoin. That this doesn’t even consider China, which is spending 5X more on QC than the US and is keeping its developments in the space largely concealed. Recently however, a Chinese entity presented a QC machine a million times more powerful than Google’s.
The risk isn’t whether or not QC will break the current Bitcoin tech, but if Bitcoin can upgrade to be Quantum proof in time.
Today there are 25M Bitcoin addresses with over $100 in them. On a good day, the Bitcoin network processes 10 transfers a second. So if everyone was to decide today that they wanted to move their own Bitcoin to a new Quantum proof wallet, it would take 30 days (and that’s if the only transactions on the network were for entire balance movements to Quantum proof wallets).
Want to do a test transfer before you move your savings? Double that time. Now it’s 60 days.
What about all the other organic Bitcoin network traffic? Double that time again (at least).
So we are looking at a 3-6 month lead time for all Bitcoin wallets to move to a Quantum proof wallet system in a best case scenario. Then we need to add on the lead time of general Bitcoin technology upgrade deployments. Bitcoin is historically very slow moving at implementing major changes (for good reason, it’s protected the network’s incredible value). Consensus can take years. Add all this together, and optimistically we are looking at a 12 month lead time to move the Bitcoin network to a Quantum proof system, and that’s after a prefered technology upgrade has been isolated.

Jameson Lopp, a Bitcoin OG and developer, has suggested a potential upgrade to protect against Quantum risk. You can read about it here. The half-page description alone is worth digesting. Lopp is a Bitcoin security expert and he knows what he is talking about. He even notes that some timelines put the QC threat to Bitcoin at just a few years out from today.
The thing is, no one knows exactly when a sufficiently powerful Quantum Computer will be built to crack Bitcoin’s RSA cryptography, but most estimates lie between 3-10 years. Given the aggressive technology leaps that QC companies are making today, with breakthrough innovations occurring every quarter, I suspect this technology will mature sooner than many think.
Just like ChatGPT.
As it stands, the Bitcoin network is moving too slowly on the QC threat. We have a long lead-time to resolve this risk, and the risk is growing.
What can you do?
- Encourage action on the QC Bitcoin Improvement Proposals (BIPS).
- Consider getting some QC exposure.
At Capriole, we believe the QC sector is important to our strategy for a few reasons:
- High return potential: We expect if you fast forward 5 or 10 years, QC assets will have outperformed Bitcoin given their relative undervaluation today and the expected and historic QC growth rates. We view QC today as a similar investment opportunity to Bitcoin in 2015. Highly volatile, but rewarding long-term.
- A hedge: Putting the returns aside, if you hold a meaningful amount of Bitcoin, it’s probably wise to have some allocation to QC as a portfolio hedge should a worst case scenario eventuate.
The Capriole Fund has dynamic exposure to Quantum Computing assets. Our QC positions have outperformed Bitcoin and have been the best performing part of our portfolio since first acquisition a year ago. We’ve received a lot of interest in QC over the last months, and as a result we are considering establishing a pure QC investment vehicle to fill the current market gap. We expect it will be available to retail. If you are interested in learning more, contact us. Generally, QC is an industry we expect will see a lot of volatility over the coming years, much like Bitcoin did in the early days. So as always – if you do get involved – manage your risk.
How Capriole positions for cycle “tops”
You will have noticed all of the metrics discussed here are available live at Capriole Charts. It’s our collection of what we consider the most important signals to monitor for cycle risk and opportunity. There are many others not discussed here, so take a look. We eat our own cooking.
In particular, Macro Index parses over 100 on-chain and macro data points into one ML model which summaries the general market health into four regimes. It’s one of Capriole’s preferred models for navigating risk in this market.
At Capriole we deploy capital across a portfolio of strategies. Each strategy has a target position for each asset(s) at every point in time. Portfolio optimisation is conducted to determine the relative percentage of the total portfolio that is allocated to each strategy. The sum of these weights and strategy positions determines our final allocation to each asset, across Bitcoin, altcoins, equities and commodities.
The net effect is total position sizing will on average scale down when Bitcoin cycle risk is high (the above mentioned metrics are in dangerous territory) and scale up again when conditions normalize. Simplistically, you could say we are navigating the market, considering the data and assessing the potential risk of a Bitcoin “cycle top” every day – regardless of whether or not one eventuates.
The other asset classes noted above are also very useful in managing Bitcoin cycle risk. Gold for example tends to move in waves, out of step with Bitcoin, and offers unique opportunities and improved overall portfolio risk-adjusted returns. We also view Quantum Computing as a necessity for risk management, as well as a significant return multiplier.
These are important elements of our portfolio and cycle risk management process. Risk management isn’t sexy. People usually don’t care for it until after the fact, but it’s always our first priority. If you have been in the crypto space long enough, you will know risk management and survival is the most important factor to consider first.
The Bottom Line
The Bitcoin miner driven cycle is largely dead.
As outlined last issue, we believe there is a strong chance of a right translated cycle. Provided current institutional demand holds. However, we must also remain vigilant to data that could turn for the worse. Bitcoin moves fast.
There are many valuable metrics for monitoring of heightened cycle risk, covering on-chain data, macro data, sentiment data and more. You will find our favourites live at Capriole Charts. Given the diminished impact of Bitcoin miners today, we suspect the two biggest factors to watch for this Halving cycle are Net Liquidity and Institutional Buying.
What is the biggest risk to this cycle? In our opinion, it’s also our greatest opportunity; the Bitcoin treasury companies.
While Quantum Computing isn’t a risk to Bitcoin this Halving cycle, without action it certainly will be in the next one. So let’s push the Bitcoin community towards implementing a solution sooner, rather than later.

Charles Edwards


One Response
This is so good. Thank you Charles for keeping up the ALPHA. 🙂