The Bitcoin Liquidity Tap
This issue we take some time to reflect why this major Bitcoin breakout to $119K was not surprising at all if you were following the right data. Most Bitcoin analysts get caught in the weeds of technicals and on-chain data. Yes they are both very important, but the most important data for driving Bitcoin price in the mid-long term in 2025+ is global macro – something Capriole has focused on deeply for years. Indeed the below metrics and many more are important inputs into our systematic macro strategies, including Macro Index and One (Trend King) which are used by the Capriole Fund in managing positions day-to-day.
We finished last update (at $108K) noting “Today we have strong on-chain and macro data, strong cyclical data (with Gold) and we have strong technicals. As long as this picture remains, the outlook is very bullish Bitcoin, leaving a 50%+ rise over the next 6 months a conservative target based on similar historical comparables.” Our view is largely unchanged today.
In short: Money and liquidity provided the backdrop for capital flows, and Bitcoin Treasury Companies are the funnel.
The World is Long Hard Money
USD Positioning and Big Bitcoin Rallies
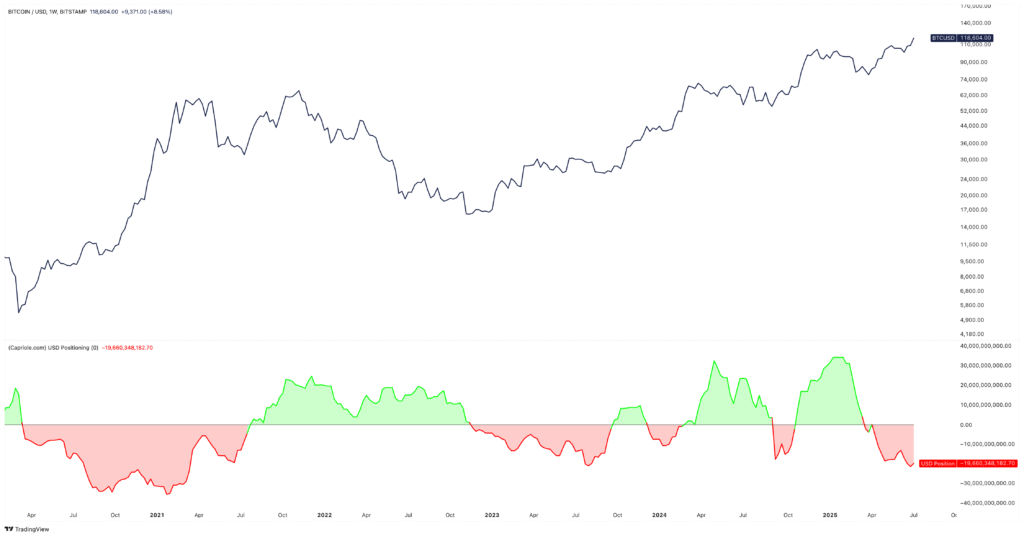
When the world is bearish the US Dollar, it tends to go long hard assets and other currencies. Perhaps one of the best gauges for this is Capriole’s “USD Positioning” metric which aggregates all currency positions and identifies when the world is net short or long the US Dollar.
As noted in July: “The biggest Bitcoin rallies occur when the market is net short the USD. This phenomenon has been powerful since Covid, when Bitcoin became a Macro asset. Guess what. The world is very short USD today.”
Since then we have seen the biggest technical breakout on Bitcoin in months, with a $20K rally occurring within 2 weeks. Today, USD Positioning remains deeply negative.
Source: https://capriole.com/charts/?chart=usd-positioning
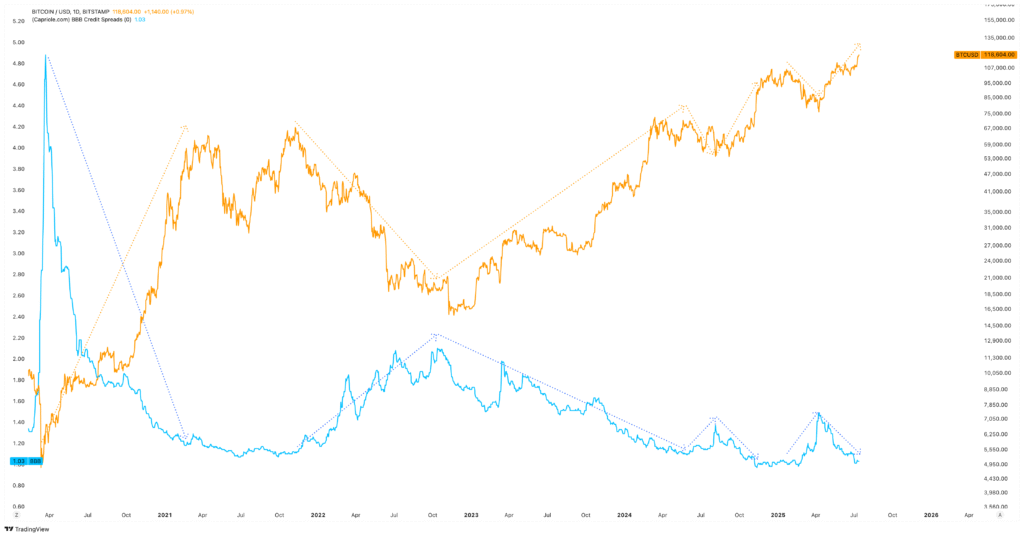
Credit Spreads and Bitcoin. More evidence Bitcoin is a tradfi asset.
Falling credit spreads are widely accepted as a risk-on metric for equities. They typically spike around uncertainty and risk-off events (the classic case is Covid 2020). As we can see, Bitcoin has had a strong relationship with Credit Spreads since 2020, with major Bitcoin trends coinciding with falling Credit Spreads. Yes, credit spreads have also been falling through this significant rally from $100K to $119K creating the optimal environment for Bitcoin to move.
Source: https://capriole.com/charts/?chart=bbb-credit-spreads
Fiat money is flooding the market.
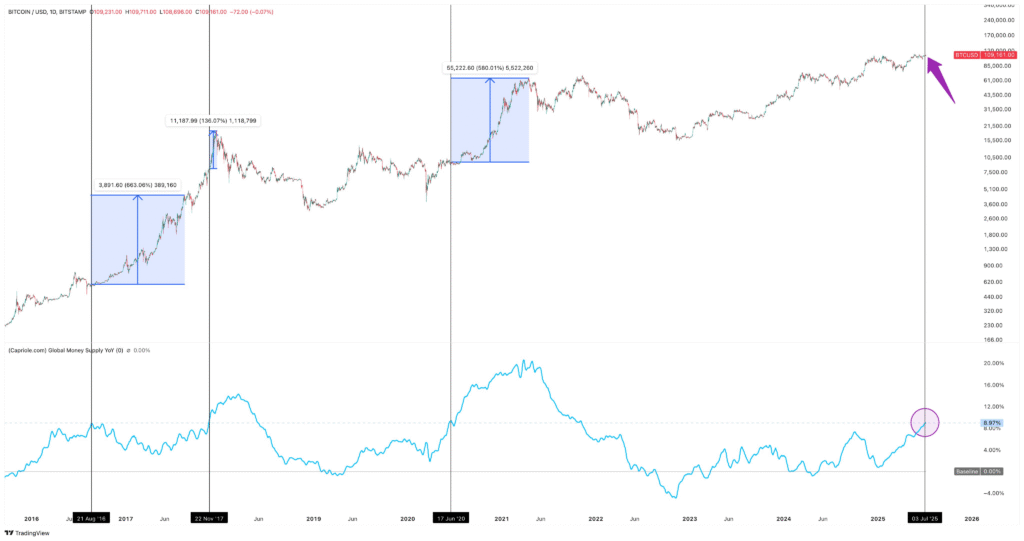
Central banks are flooding the market with fiat money. The yearly growth rate in M3 Global Money Supply (over $112T) recently hit 9%, which is extreme and rare. The last times this happened? Bitcoin returns peaked on average up 460% within the next 12 months. As a multi-trillion-dollar asset today, we do not necessarily expect a 460% move, but it wouldn’t be surprising to see something very substantial from here. Since we first noted this last week, Bitcoin is up 10%.
Source: https://capriole.com/charts/?chart=global-m2-yoy
The above global money and liquidity drivers are paramount to how macro assets are priced relative to each other. The key word here is relative. All asset pricing is relative to other assets and to base money. In the environment provided by the above metrics, it’s clear that we expect hard money to do extremely well in second half 2025.
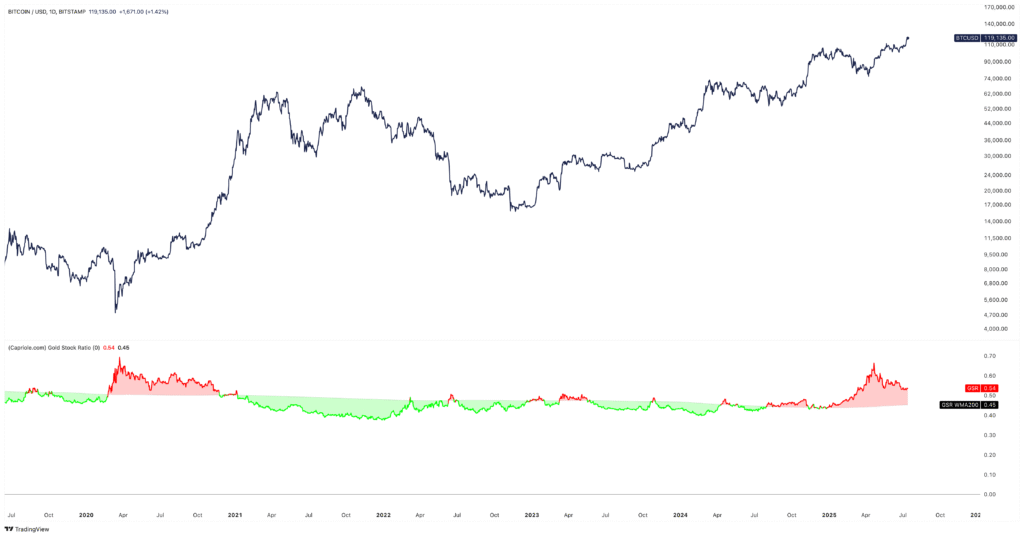
Something I personally have been harping on about every year since 2020 is the strong relationship between Gold and Bitcoin. Historically, when Gold sees a strong rally, Bitcoin has followed 3-4 months later. Gold again saw a big rally in early 2025, and we noted this typical relationship again on X in April. The Gold strength alone is strong support for the current market’s diminishing demand for fiat money and favour of hard money. This adds confluence to USD Positioning being net short the USD and Central Banks flooding the market with money. So these metrics help explain each other and add support to the strong bullish Bitcoin case we have seen. Fast forward 2.5 months, and since the noted Gold breakout on X, Bitcoin is up 28%.
We like to track relative Gold strength to Equities. We can see the current Gold breakout versus equities is unparalleled since 2020/2021, giving supportive evidence for the relative strength of hard assets and a very strong baseline support for Bitcoin through 2025.
Source: https://capriole.com/charts/?chart=gold-stock-ratio
Local risk-on metrics are also favorable
The Equities Advance-Decline Line broke out to the upside.
As noted a week ago, the Advance-Decline Line is flying: “Historically this means we have just entered a period of significant price expansion and relatively low volatility for the next 12m (see green). Risk on. S&P 7000+ coming soon?”
So whether or not you are in the camp that Bitcoin is a risk-on asset – such an environment is a great backdrop for Bitcoin support.
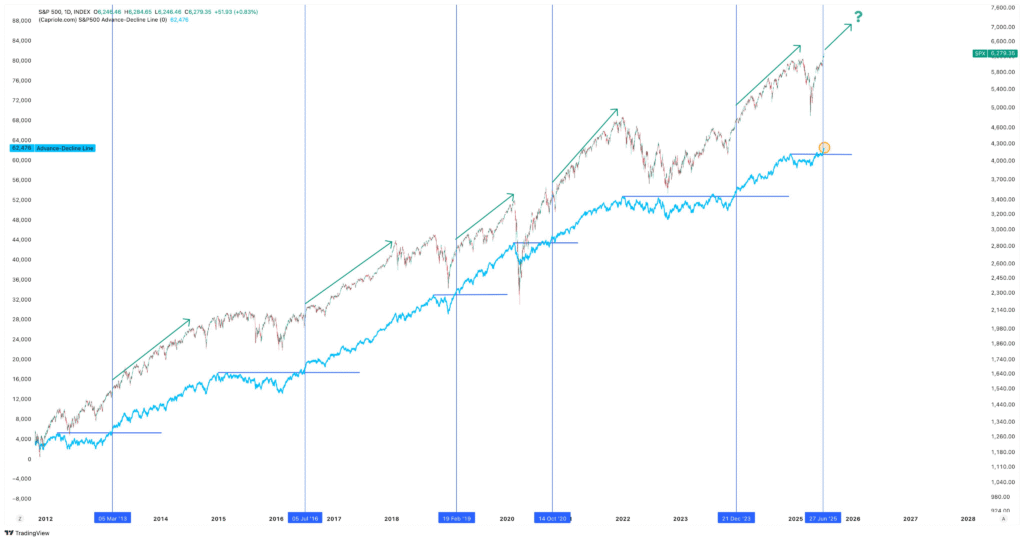
Source: https://capriole.com/charts/?chart=advanced-decline-line
The above AD-Line move was preceded by the Equities Premium resetting to zero, which we also discussed 2 months ago: “US Equity Premium recently reset to 0. Recovery of EP from this region typically occurs after a correction is complete and usually suggests green skies for risk-assets ahead.”
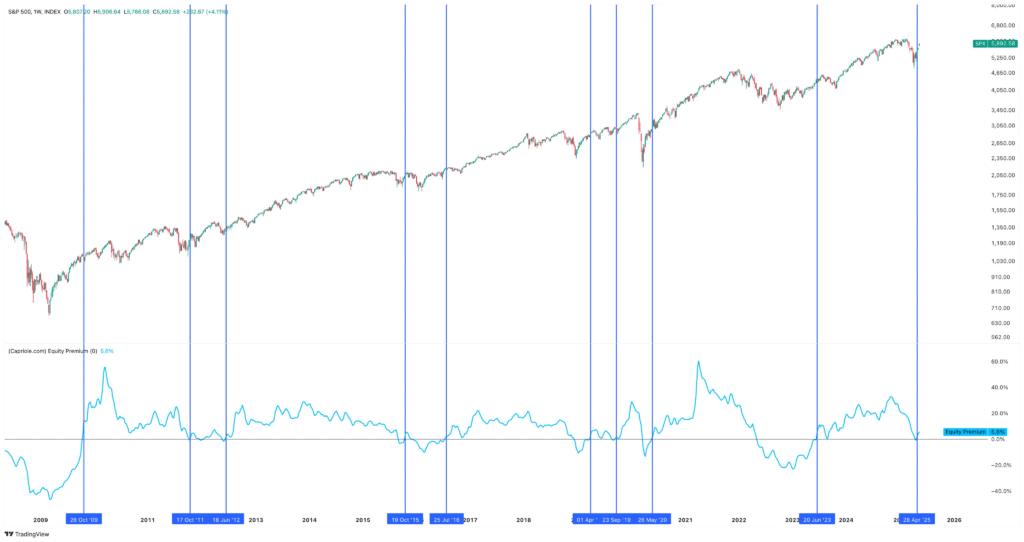
Source: https://capriole.com/charts/?chart=equity-premium
Capriole’s Bitcoin Macro Index
We’ve focused on a select set of high value macro metrics this issue. There are of course some other factors and were more early warning signs for Bitcoin’s potential (not to mention Capriole’s Hash Ribbons firing a buy signal a month ago).
Finally if you don’t want to do the work, we have Macro Index which summarises all our important metrics, and dozens of other proprietary metrics which are not public, to provide our aggregate fundamental view on the Bitcoin market and yes, for now, it’s still in strong positive growth territory:
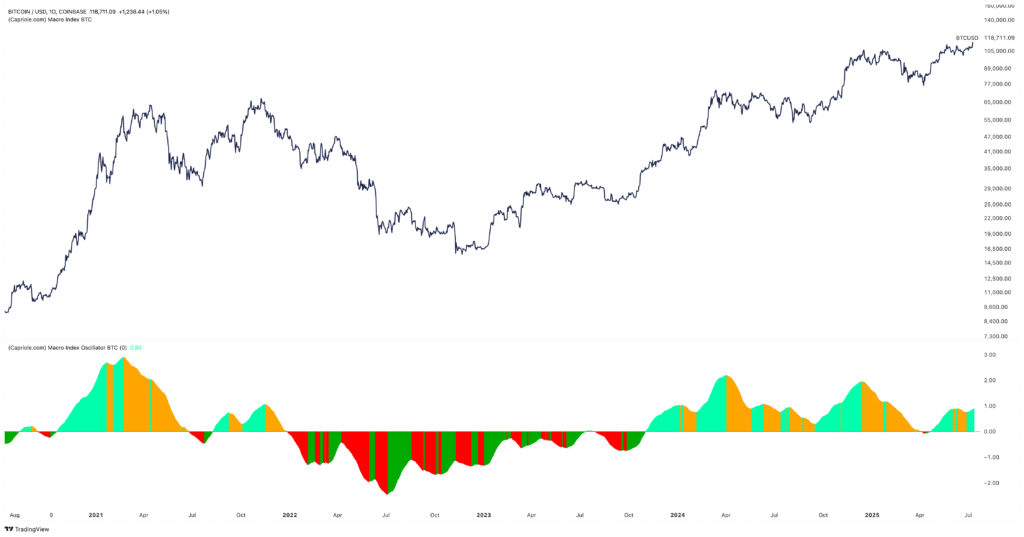
Source: https://capriole.com/charts/?chart=macro-index-btc
All of the metrics discussed above are plotted live at Capriole.com/Charts and you can monitor them in your own time, to make your own assessments. Check it out. In the coming weeks we will also be launching dozens more metrics, and a Strategy section with strategies even more advanced than Macro Index.
We may be biased, but we believe Capriole Charts offers the best holistic view of Bitcoin and Macro markets in one place. We only show high signal metrics that we actively use and believe offer the most value in navigating the markets.
Bitcoin Treasury Companies
The above dynamics have been the liquidity drivers for significant capital interest and flows into Bitcoin in Q2.
The Bitcoin Treasury Companies have been the funnel that has allowed that Capital to flow in size to attractive Bitcoin equities.
Quarterly inflows into Bitcoin Treasury Companies (TCs) hit $15B last quarter and is seemingly about to go parabolic as the opportunity to leverage and arbitrage traditional finance capital raising techniques to purchase Bitcoin is allowing incredible returns for these companies. I believe TCs have a long way to go in 2025 still, and the TC flywheel will be the primary bubble dynamic of this cycle, likely overtaking the Bitcoin ETFs in size by the end of 2025. Later this cycle it will be important to monitor the purchasing (and selling) behaviour of these entities which will likely emerge as Bitcoin’s greatest risk factor in 2026 and beyond. That’s why we are adding a suite of these metrics to Capriole.com/Charts very soon. While in most cases leverage of the TCs is easily serviceable today, we now have over 145 copycat entities pursuing this growth strategy, and at some point (knowing human behaviour) its probable that the dials will get turned up too far to the right. But for now, let’s enjoy the ride. These entities will likely help add over $1T to Bitcoin’s Market cap over the next year and set the stage for the Government Treasury cycle (next cycle).
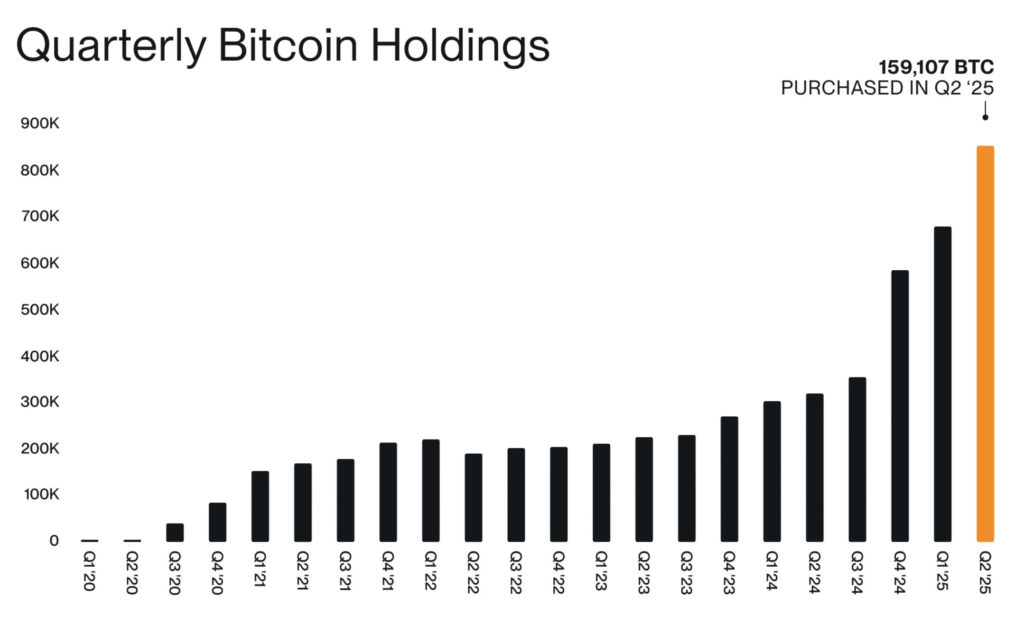
Source: https://x.com/BitwiseInvest/status/1943029893153067193
The Bottom Line
The primary liquidity drivers are still very much in favour of Bitcoin today and suggest we are broadly in the early stages of this macro bullish regime for hard assets. Against this backdrop we are also in the early stages of a shorter-term risk-on regime and we have the biggest capital funnel into Bitcoin we have ever seen just starting the crank up – the Bitcoin Treasury Companies. Now that these entities have big wins under their belts with Bitcoin at $119K, they can readily attract and raise more capital for deployment using their strong returns and inflated market caps. What a flywheel.
Recently I received a negative comment on this centralisation of Bitcoin into these companies. But to the contrary, I believe Treasury Companies are a logical step in Bitcoin’s adoption and scaling. It’s pure arbitrage of fiat money capital to purchase a superior, hard asset. If Bitcoin is to one day become base money, Satoshi’s “Peer-to-Peer Electronic Cash System”, it needs to scale to $10s of trillions to flatten volatility and become “stable” enough to be used as cash. The only way that happens is mass acquisition like we are seeing today. While today’s early adopters may be seen as speculators, it will be very obvious in hindsight. After the Treasury company wave is the Government treasury wave (next cycle). We are simply riding the adoption curve which requires trillions of dollars to flow in to Bitcoin from the entities that have it in order to achieve scale.
Important note: the metrics focused on here are higher timeframe / longer term. The view taken here is over months. When Bitcoin sees huge rallies there are always strong pullbacks and local overheating within the Bitcoin market. We have deliberately ignored those factors this issue to focus on the bigger picture and driving factors for the next 6 months.
PS: If you like these charts and want to learn more about how we look at them, check out my recent podcast with Juhyuk on X and YouTube. I will also be speaking at the World’s largest crypto event, Token2049 in October in Singapore – looking forward to meeting a few of you there!

Charles Edwards


One Response
Thanks for this post!
Like your work and your models very much.
Regarding your models on your new website: it’s rather difficult to use for decision making without knowing any backtested results and rules how and when to use them.