

Changing Tides
Market Update
Sentiment is in the pits. Check out these three major sentiment indicator readings and what they are telling us today:
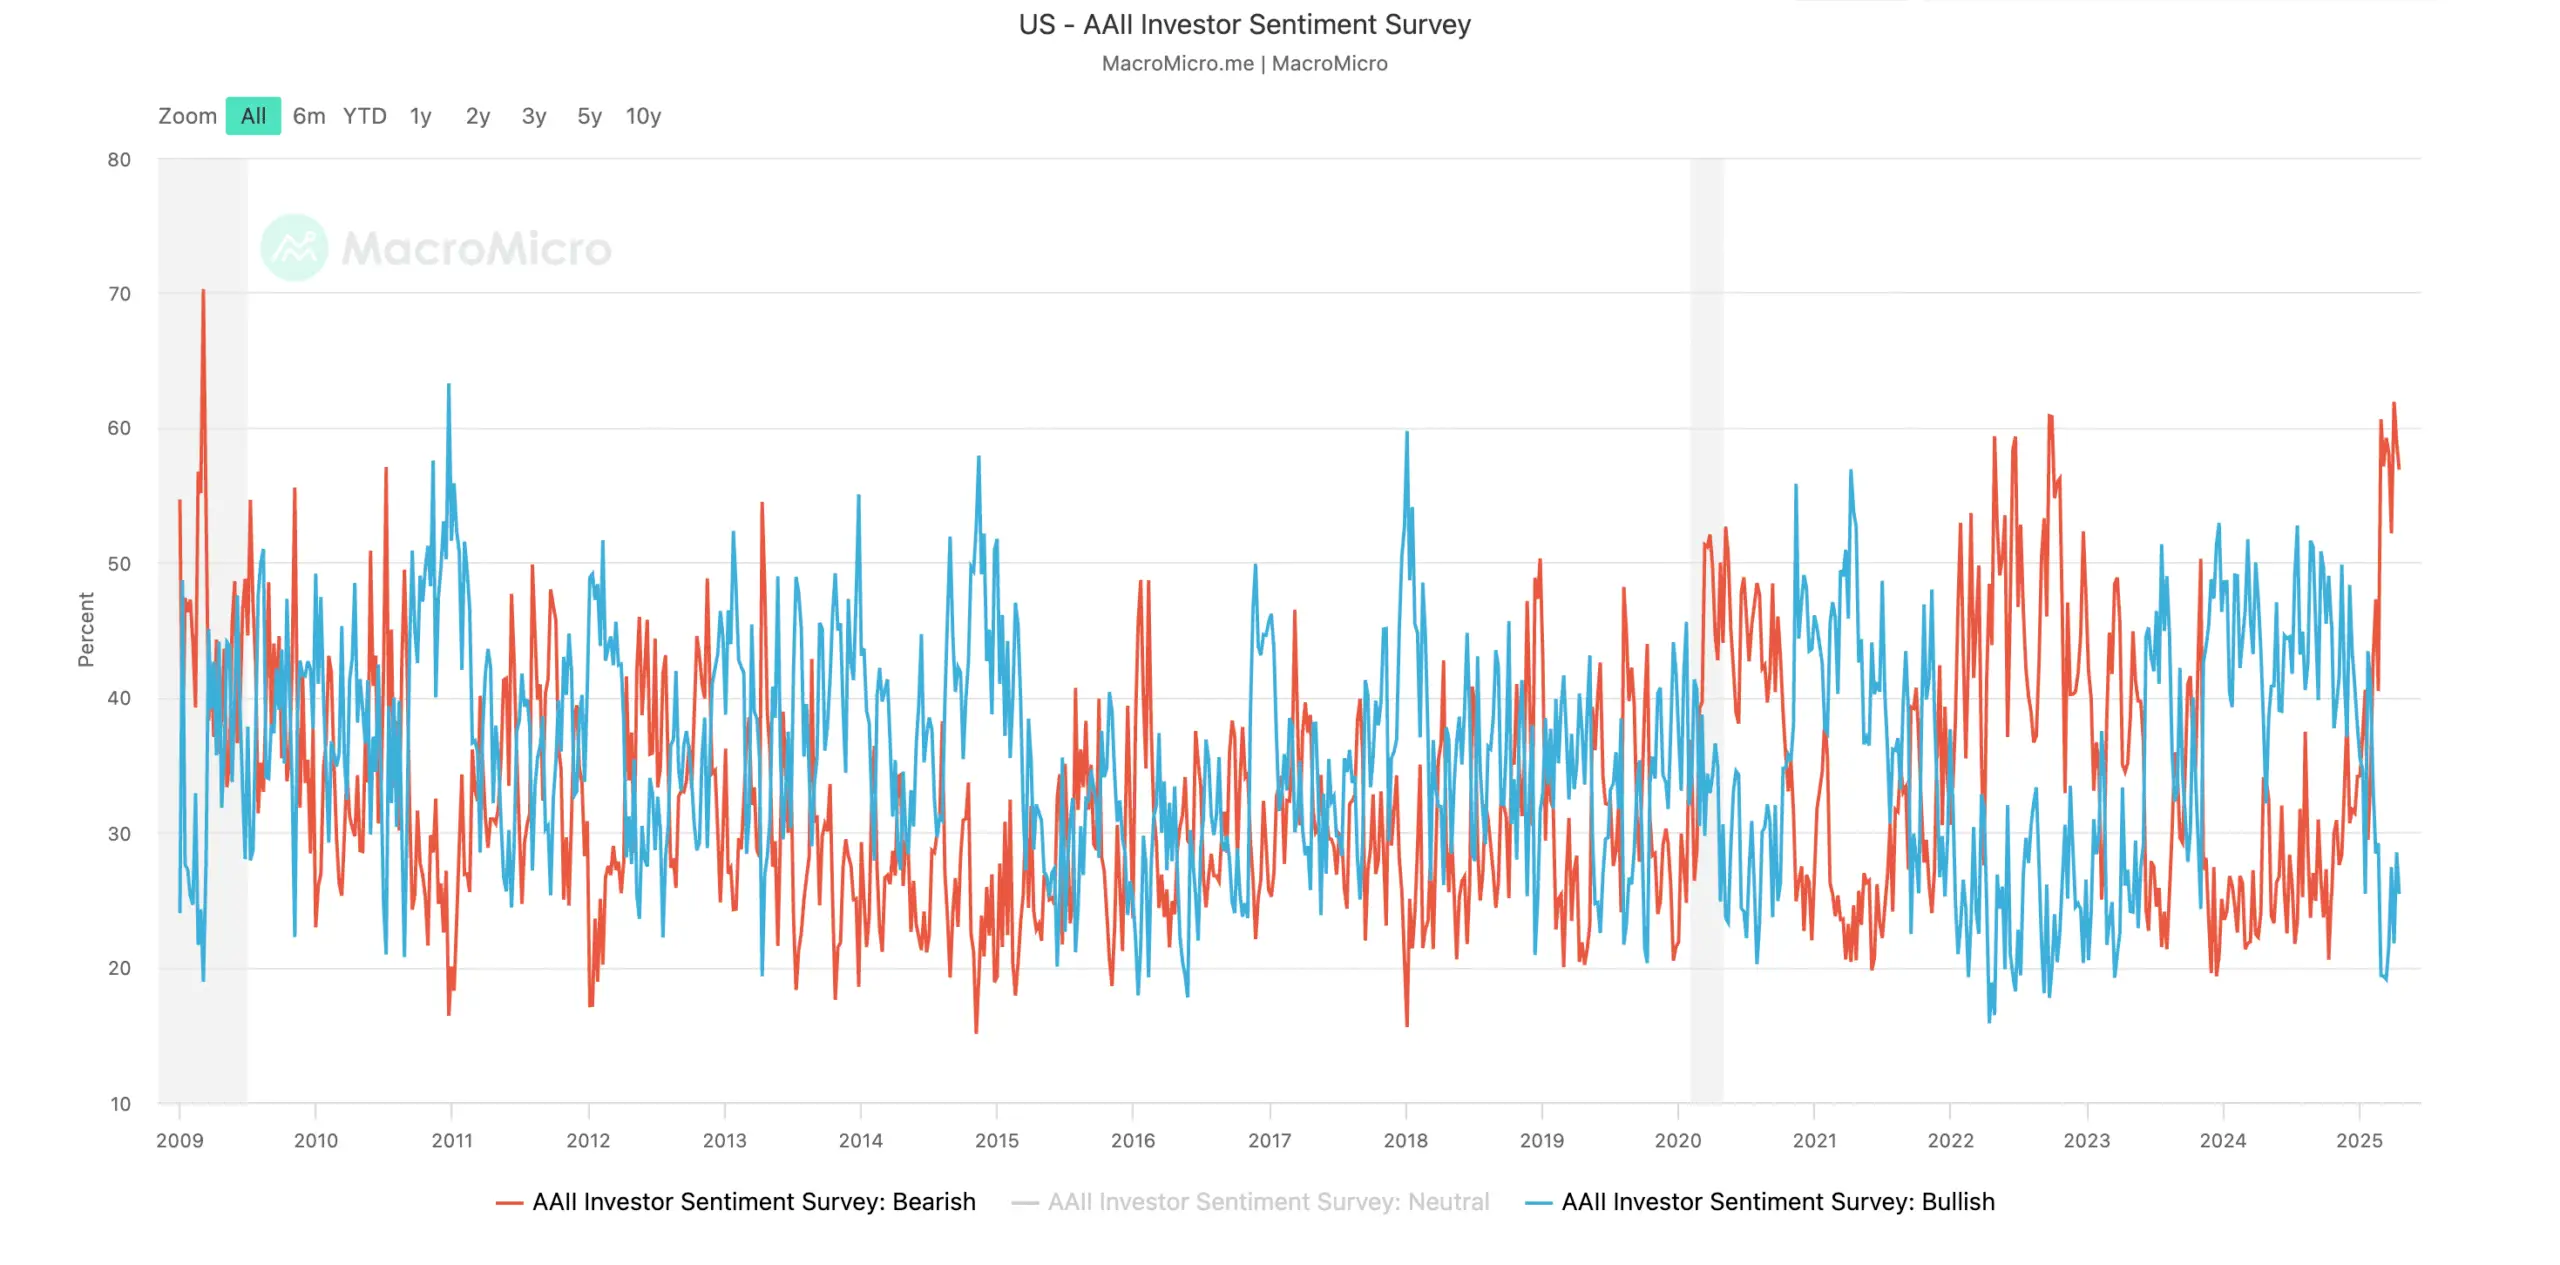
AAII Investor Sentiment survey maps where investors think the market is heading. At present there is an overwhelming view that the direction is lower and the crowd is almost always systematically wrong. The bull/bear spread today is as bearish as 2009 and the 2022 lows, and significantly worse than the 2020 Covid crash. Simply put, investors are panicking today. Even though both Bitcoin and the S&P are down less than 15%.
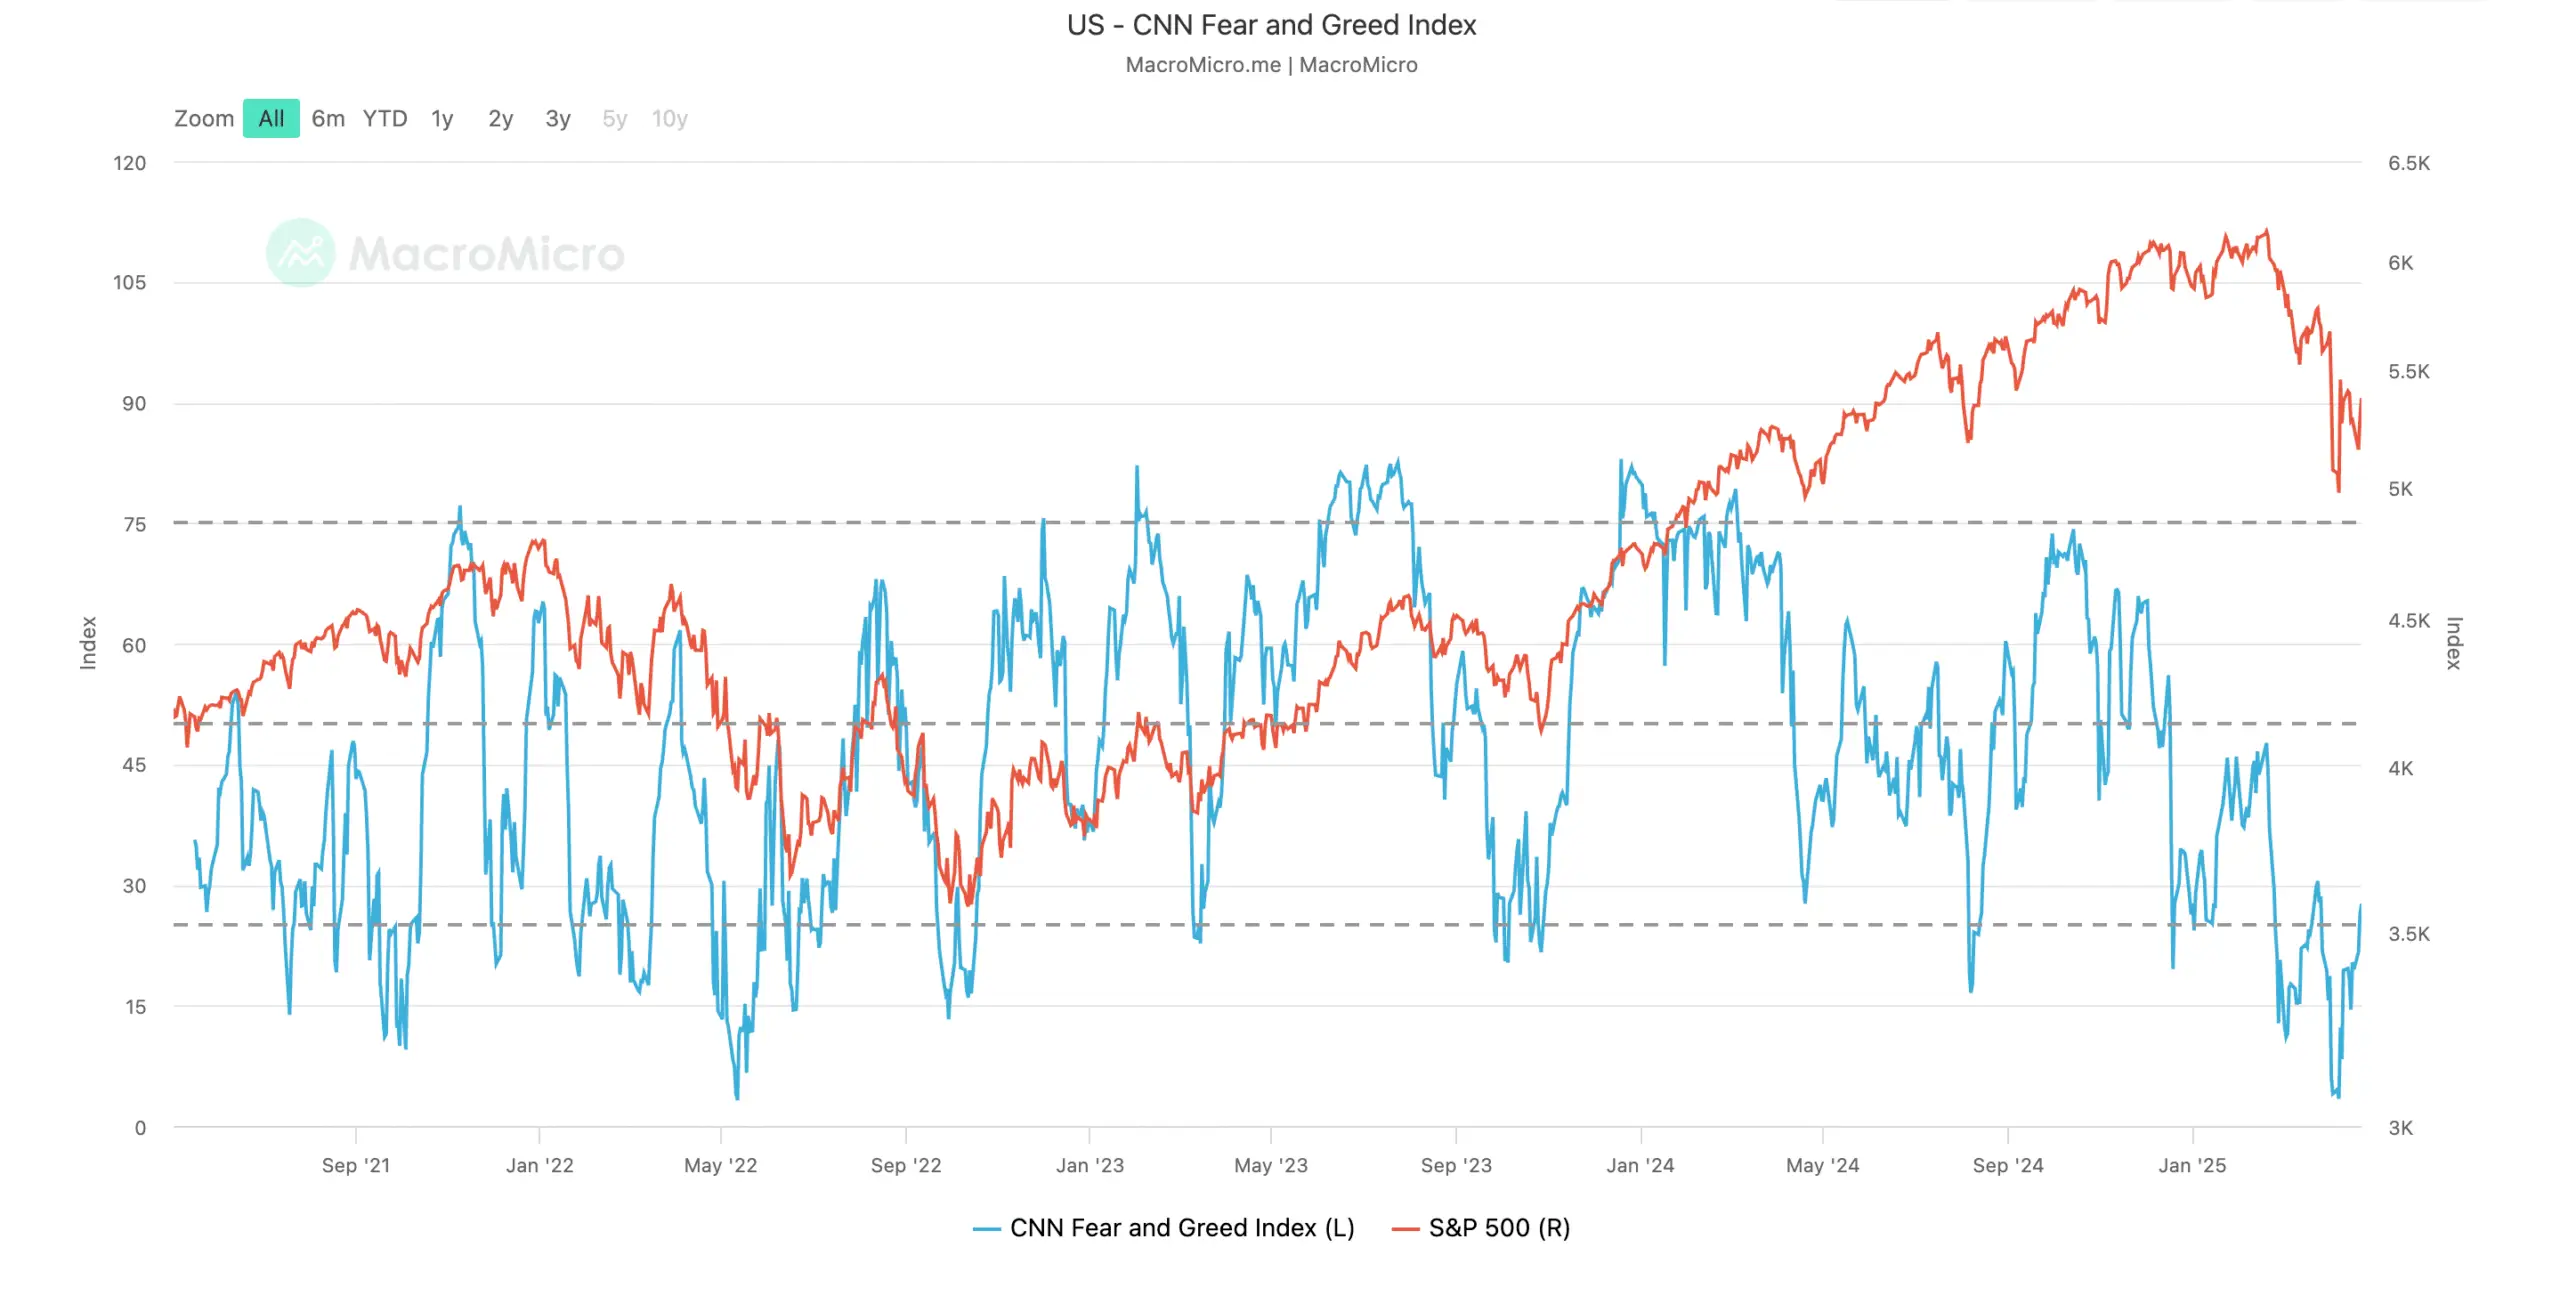
CNN’s classic Fear and Greed metric has just seen its worst reading in years. Typically such bearish readings align with significant opportunity across risk assets. Can prices still go lower? Of course, but the opportunity 6, 12, 24 months out is usually great.
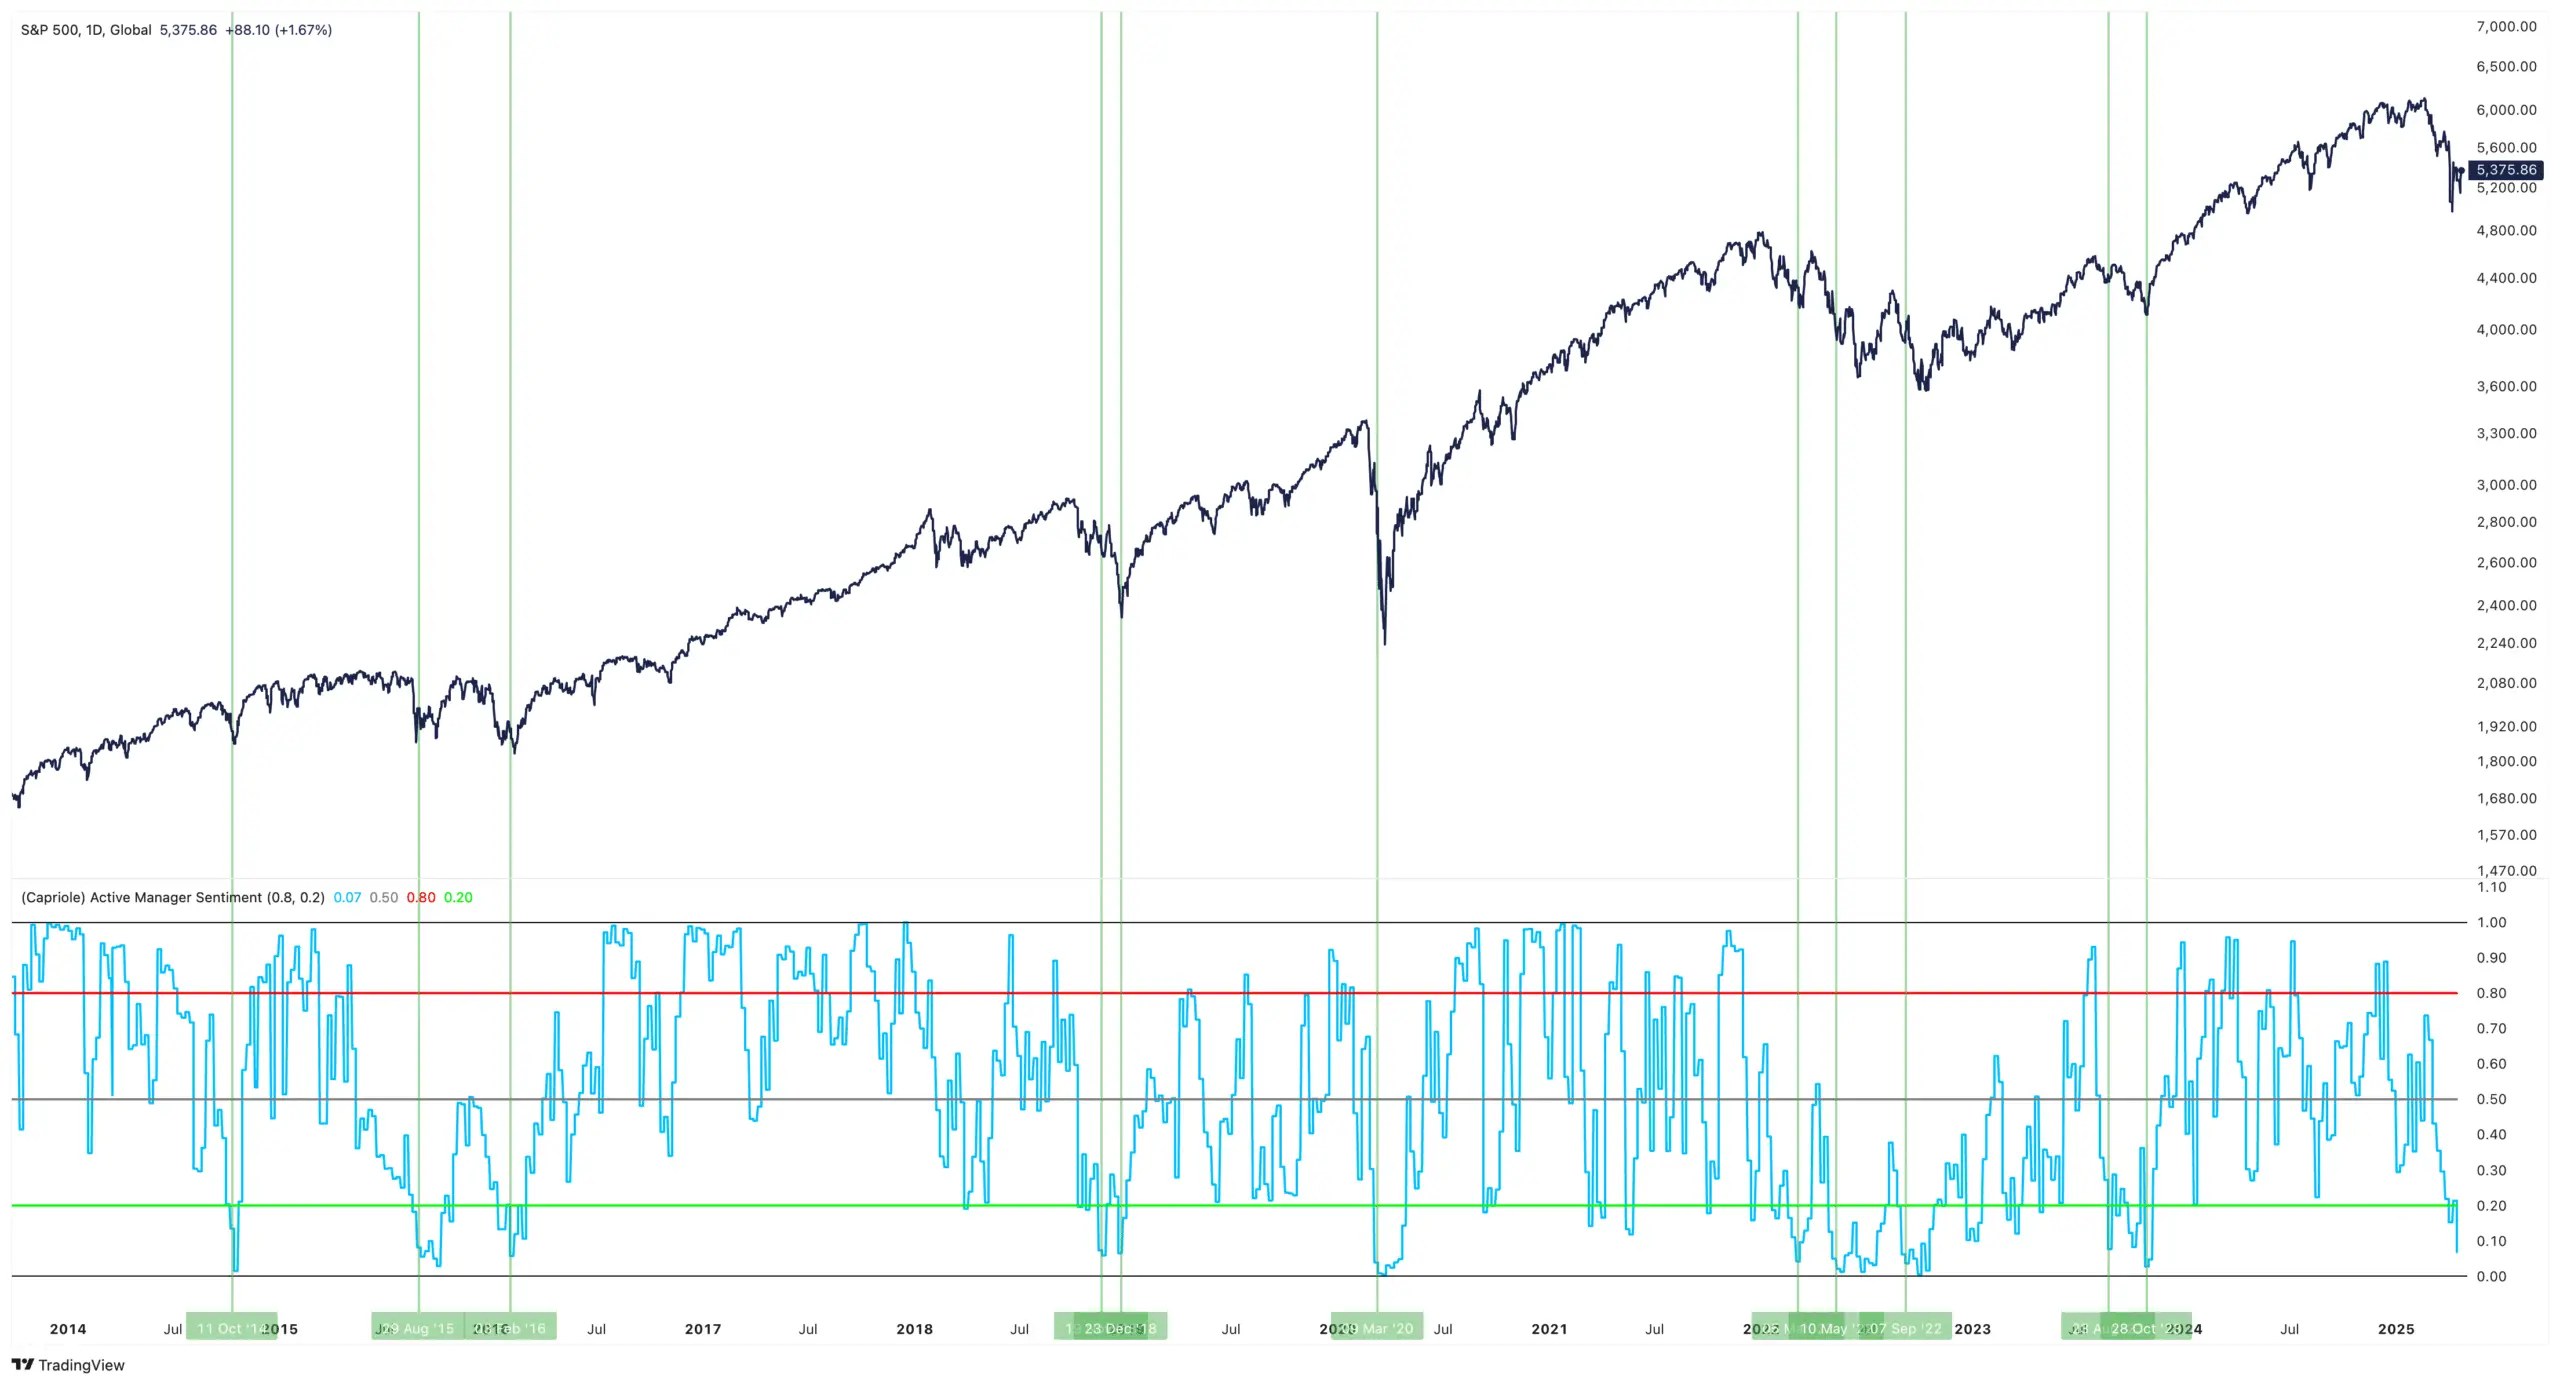
Capriole Charts Active Manager Sentiment tracks the relative exposure of asset manager to equities. At present it is near historical lows. Similar low readings are highlighted in the below chart. At the very least you would normally see a short-mid term price rally off such extremes, as when there are no more sellers left (net exposure is low) price forms a bottom.
All three sentiment metrics are showing rare multi-year extremes which typically coincide at the mid-late stage of a major price bottoms and hence mark great long-term opportunities.
As Rothschild famously said; the time to buy is “when there’s blood on the streets, even if the blood is your own”. Despite the relatively shallow price decline today, these sentiment metrics are telling us there is definitely blood (and fear) on the street.
Technicals
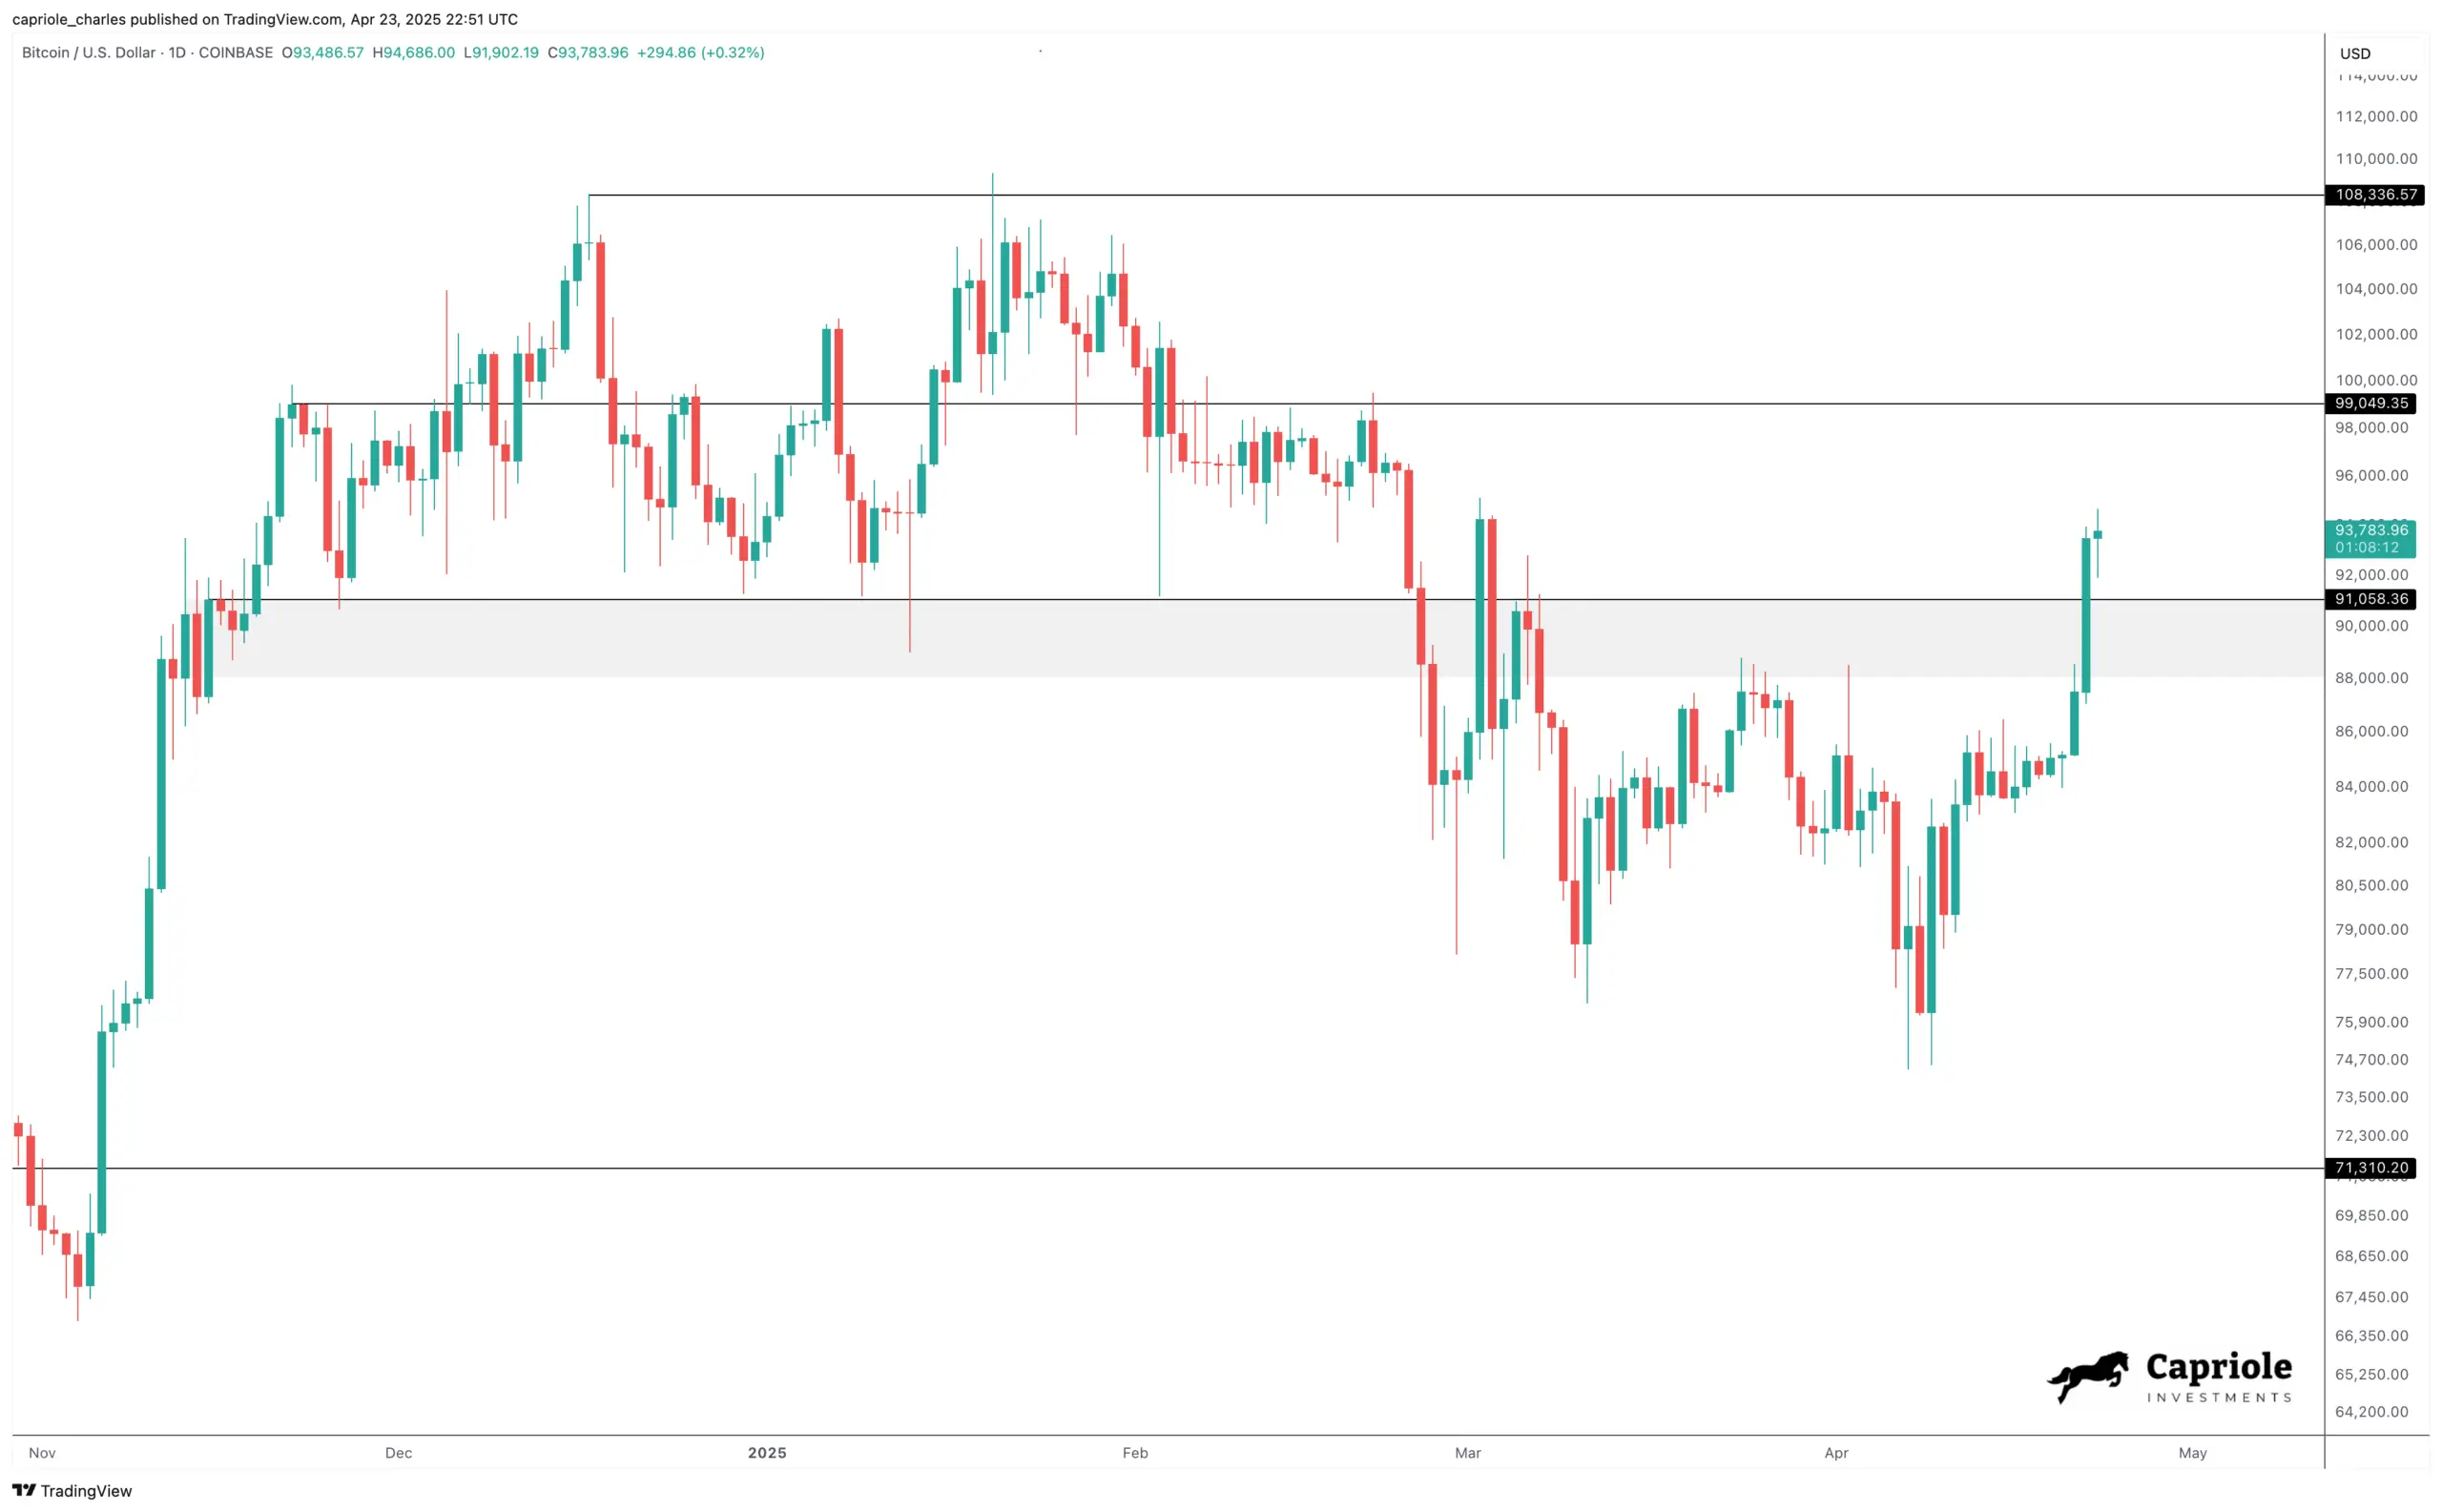
Bitcoin technicals can flip dramatically and quickly. Yesterday we saw such an example as a breakout candle to $94K triggered a significant range reclaim on the daily and weekly timeframes.
Range reclaims occur when there is significant time spent below a prior technical support/resistance range (in this case $91-100K) and then price cleanly breaks out back into the range. We have just seen a significant range reclaim, having spent two months below $91. For Bitcoin, such bullish range reclaims rarely see price look back. This is a strong confirmation of a trend change and the emergence of a new bullish trend.
Unless we see a significant change (e.g. a daily close under $91K), it’s hard to get a technical chart more bullish than this.
Fundamentals
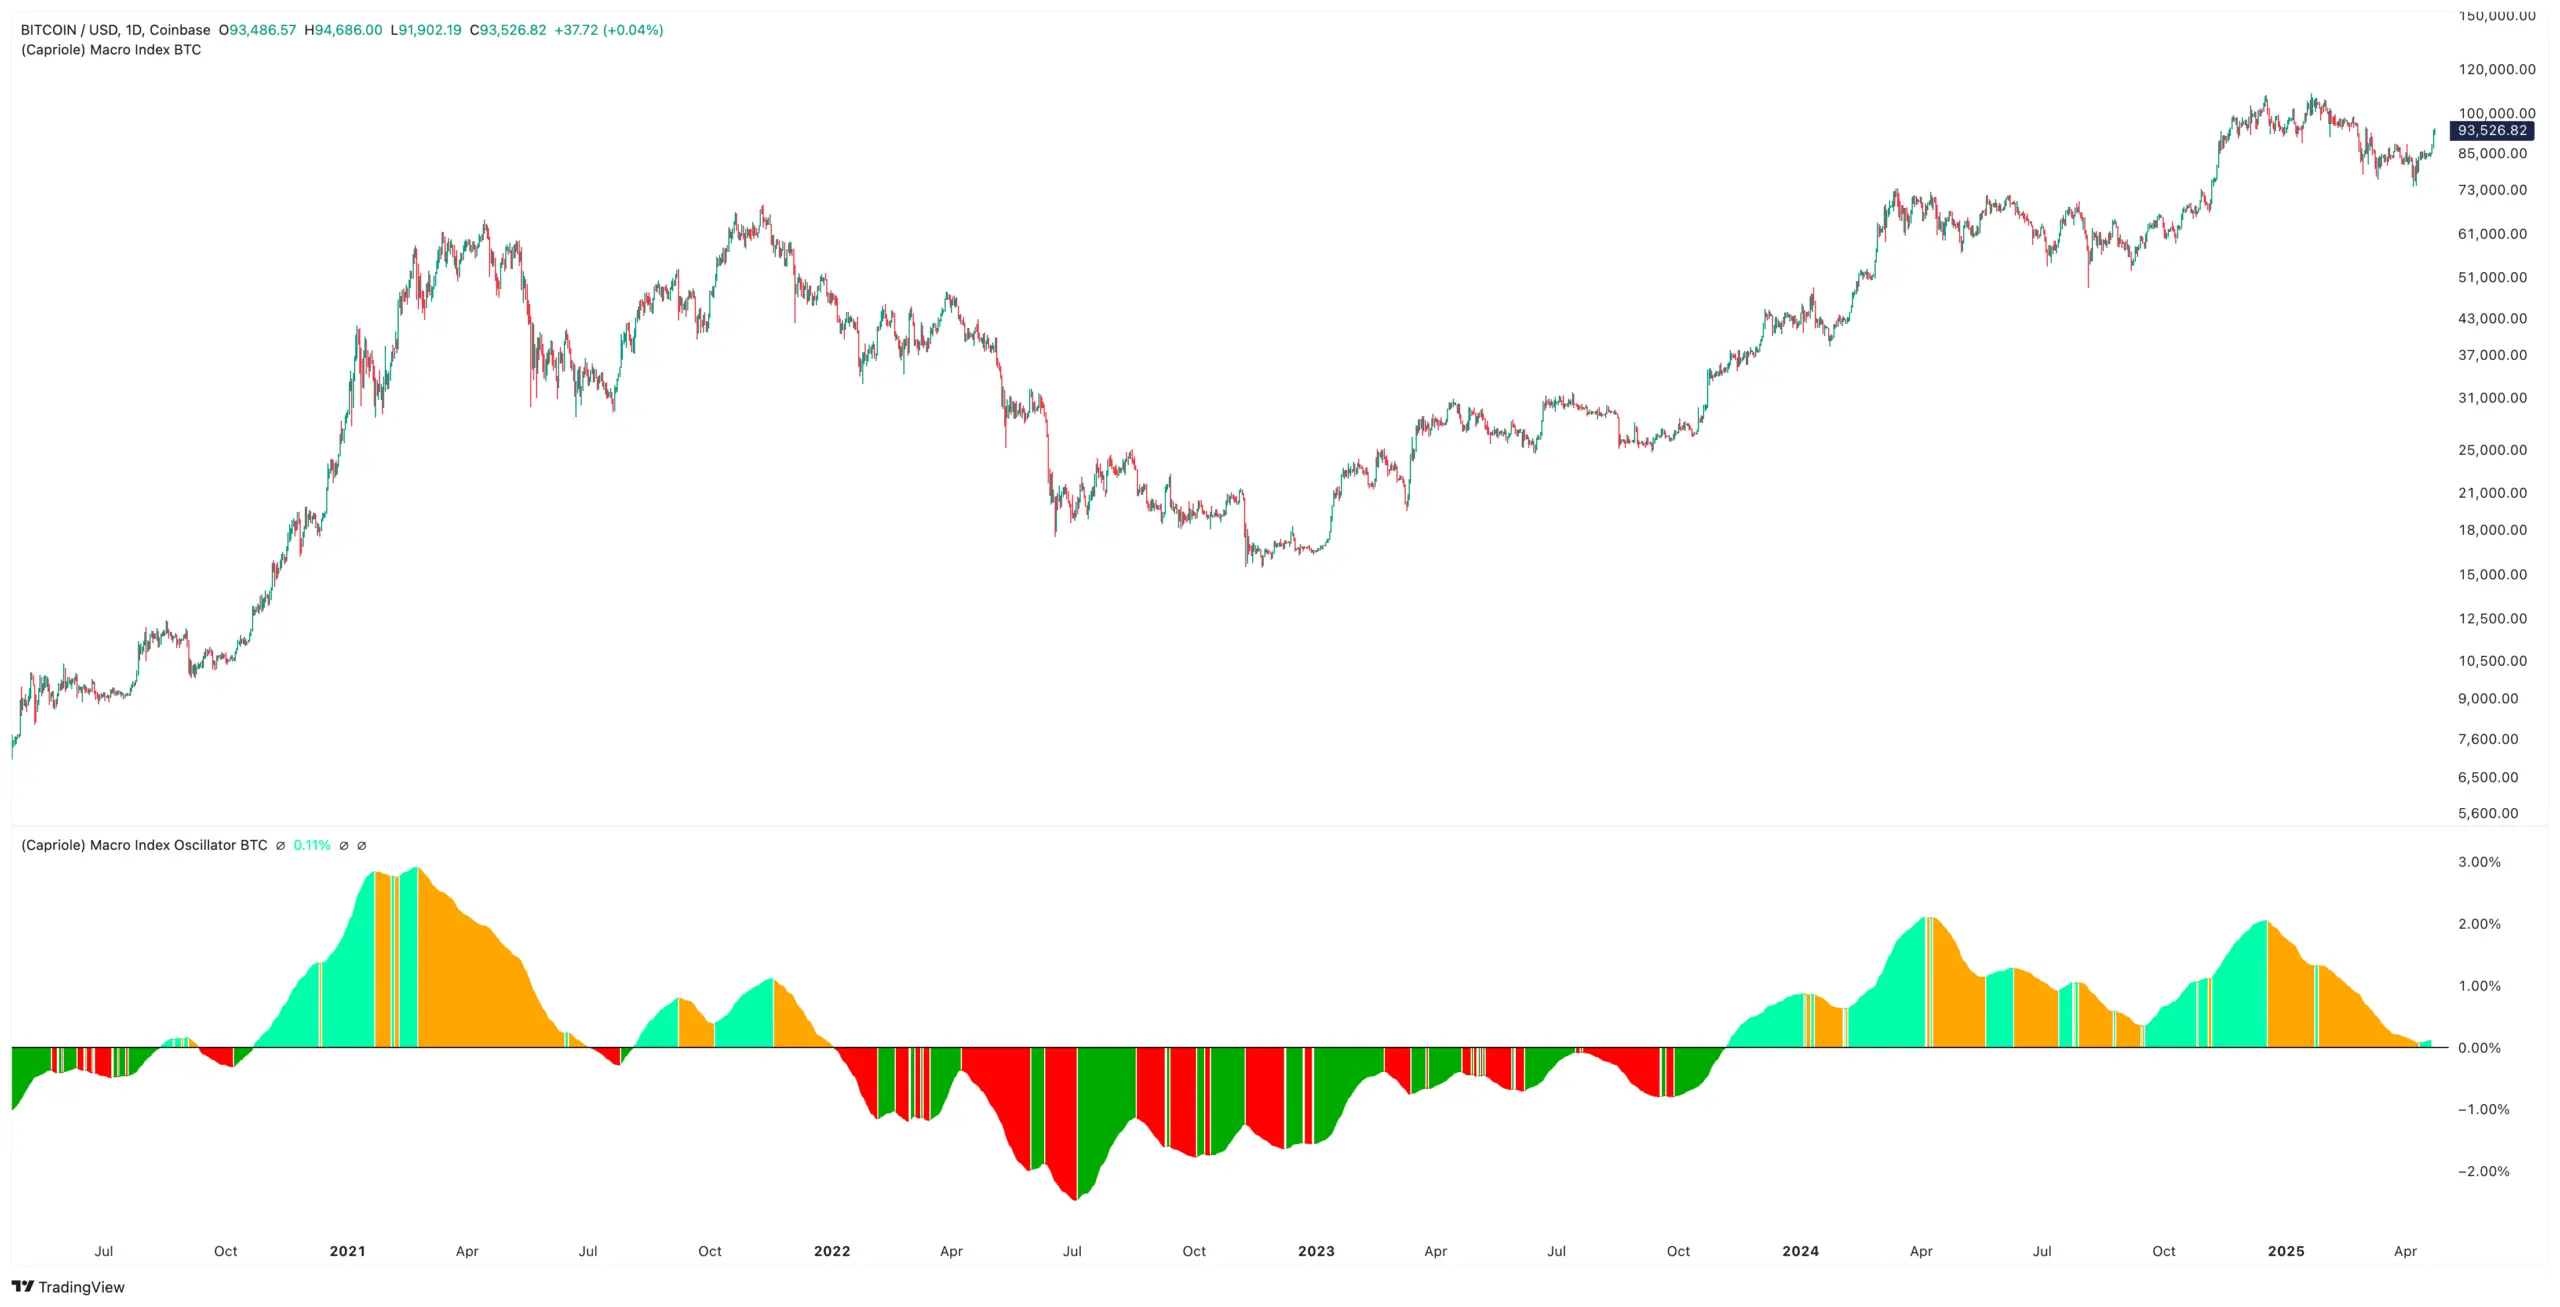
The collective picture as shown through Capriole’s ML fundamentals model Bitcoin Macro Index flipped bullish last week. This is a much anticipated and significant change and tells us that global macro and Bitcoin on-chain data has started to recover. This Index includes over 70 of the most powerful Bitcoin on-chain, macro market and equities metrics combined into a single machine learning model. It is a pure fundamentals-only value investing approach to Bitcoin, where price isn’t an input.
This new bullish trend in fundamentals is also bolstered by the fact that Capriole’s Macro Index effectively reset to zero. In other words, we saw a significant bearish trend in fundamentals which reset to “fair value” and then resumed a bullish trend. In light of the broader macro-political environment, tariff wars and extremely bearish sentiment – this is a very promising fundamental data reading.
The technical range reclaim that occurred a yesterday also adds confluence to this. Further, the Fed’s end to Quantitative Tightening (QT) and the positively shifting tide in US Liquidity (both discussed last issue) gives further promise that this new trend in Capriole’s Bitcoin Macro Index will be sticky.
The Triple Put
Since the April 2nd “Liberation Day” implementation of large sweeping global tariffs, the US has largely cut down its effective tariffs globally by circa -50% and implemented a 90 day pause. In effect, Trump very quickly walked back the extent and ambitions of the original tariff plan on the back of the increased equities and bond market volatility. It’s quite clear that the financial market pressure triggered Trump to take political action. He acted and we saw the first execution of the “Trump Put”. In other words, if markets decline too much, Trump will step in, enact policy and backstop them.
At the same time, we also saw the “Fed Put” kick in to effect on 1 April, with the 95% reduction in Federal Reserve balance sheet tightening, effectively putting an end to the 2021-2025 QT era, and positioning the market towards inbound liquidity. Powell has also recently signaled that tariffs are adding economic stressors to which the Fed will act on if required. The highly accurate CME FedWatch is also pricing in an increased base case scenario of three rate cuts by the Fed before year end.
Finally last week we also saw hints that a new “Treasury Put” was ready to be engaged. Treasury Secretary Scott Bessent said the recent decline in the US Treasury market was driven by deleveraging, not foreign selling and that the Treasury had tools to mitigate the situation, including scaling up buybacks if necessary. In other words, should the situation worsen, the US Treasury will also be stepping in to backstop markets.
The political actions this month provided important learnings on a few fronts:
- It’s highly likely we have seen the worst of the tariffs, i.e. they won’t get worse than what was initially rolled out on Liberation day.
- We now know when Trump will step in to enact the Trump Put. A 15% equities decline, VIX above 30 and spiking credit spreads were enough to do that and break the back of his ambitious tariff policies.
- We now have three major financial market “puts” in place, all ready to backstop financial markets. Together the US President, Federal Reserve and US Treasury represent the Triple Put.
Chart of the Week
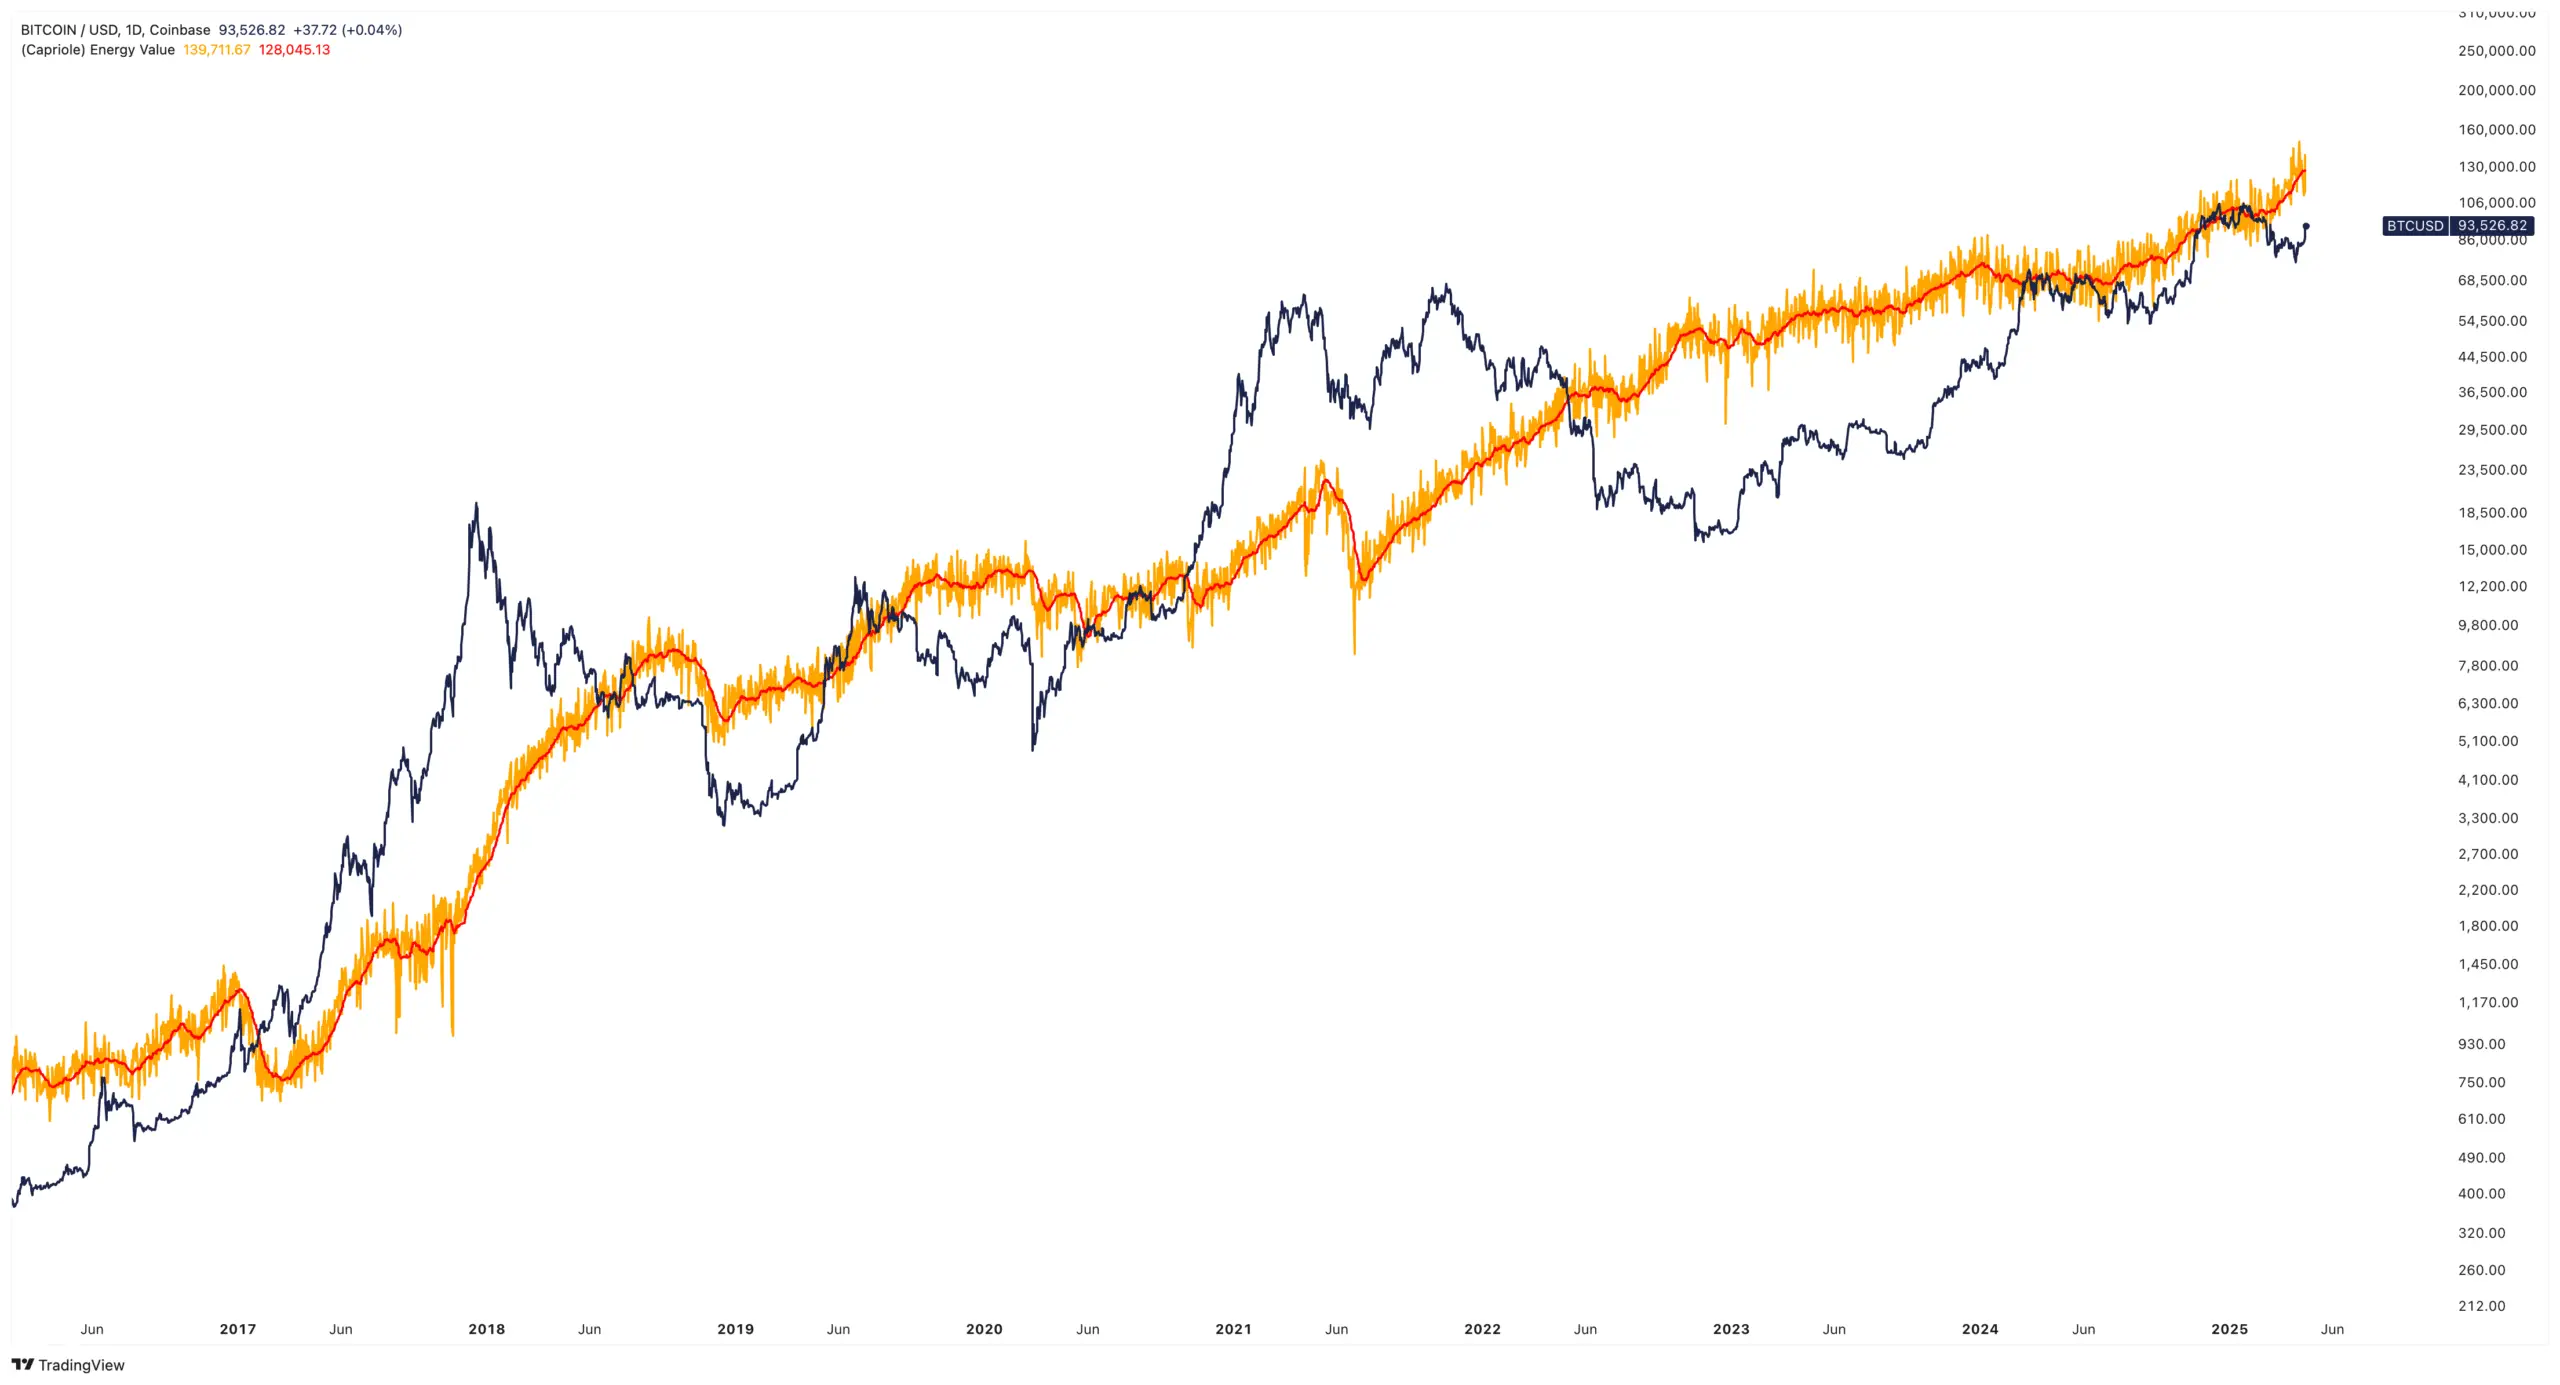
Capriole’s Bitcoin Energy Value cracked $130K for the first time ever this month, which places Bitcoin at a near 40% discount to fair value today. As you can see below, these discounts can always widen, but Bitcoin has always reverted to its fair value over time. A 40% discount in the year post halving is quite rare and a very welcome sight.
The Bottom Line
Bitcoin moves incredibly fast. As Ferris Bueller put it “Life moves pretty fast. If you don’t stop and look around once in a while, you could miss it.” Swap Life with Bitcoin, 100X it, and you have a pretty good summary of this market.
Bitcoin’s outlook can change from net bearish to net bullish at the blink of an eye, so at Capriole it’s important we remain diligent and constantly monitor for data and major macro policy shifts. We have just seen a significant change over the last week. As it sits today, the outlook for Bitcoin is very bullish with confluence across technicals, fundamentals and sentiment. At the same time, Bitcoin is uniquely trading in deep value, at a time when in prior cycles it was historically overvalued (eg. 2017 and 2021).
Political and volatility risk remain, and new policy changes are the greatest risk to derailing markets at present. However, based on what we saw in April, it’s highly likely the worst of the Tariffs are behind us and we now also have the Triple Put in place across all of the highest echelons of US government. A new volatility backstop.
To sustain this new trend we are looking for both $91K to hold on a weekly basis and for the Capriole Bitcoin Macro Index trend to remain in expansion. Bitcoin Macro Index trends tend to be sticky so the outlook is promising.
We’ve seen a big tide change this week. If we close the weekly here, I suspect we will be pushing new all time highs on Bitcoin quite soon.

Charles Edwards