Is Retail dead?
Welcome to Capriole’s Newsletter Update #55. A consolidation of the most important Bitcoin news, technicals and fundamentals.
This issue we explore the conundrum that faces Bitcoin today, an apparent lack of retail on-exchange activity and declining active address numbers despite Bitcoin trading at $72K. Since the FTX collapse in 2022, a trust void has plagued Bitcoin and crypto trading.
Will retail activity return?
Retail Speculation is Dead
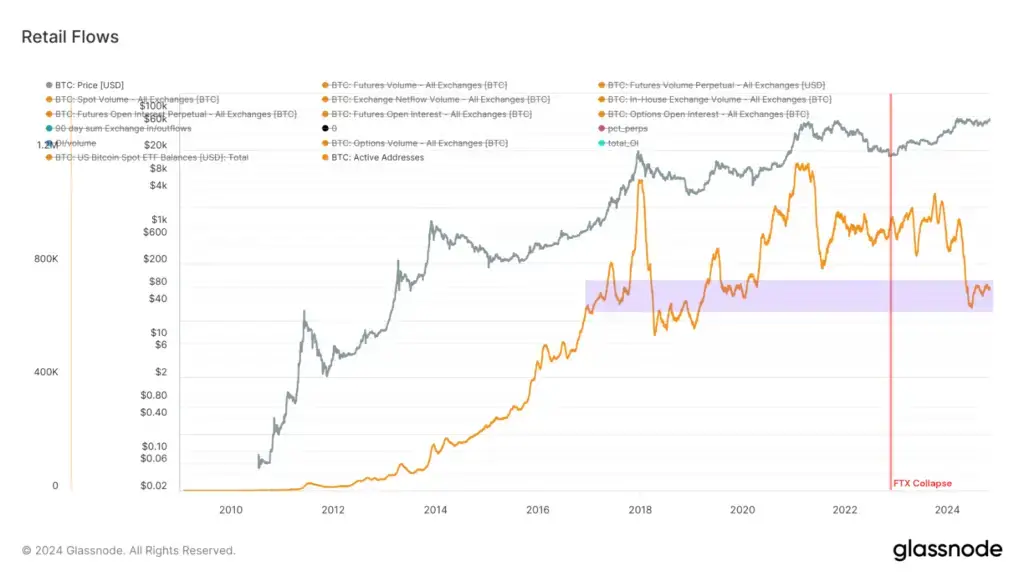
Active Bitcoin Addresses, the number of addresses that are transacting, is at the same level as the lows of 2016, 2018 and 2019. Well below the levels set in the 2017 bull market and 2020/21 bull market.
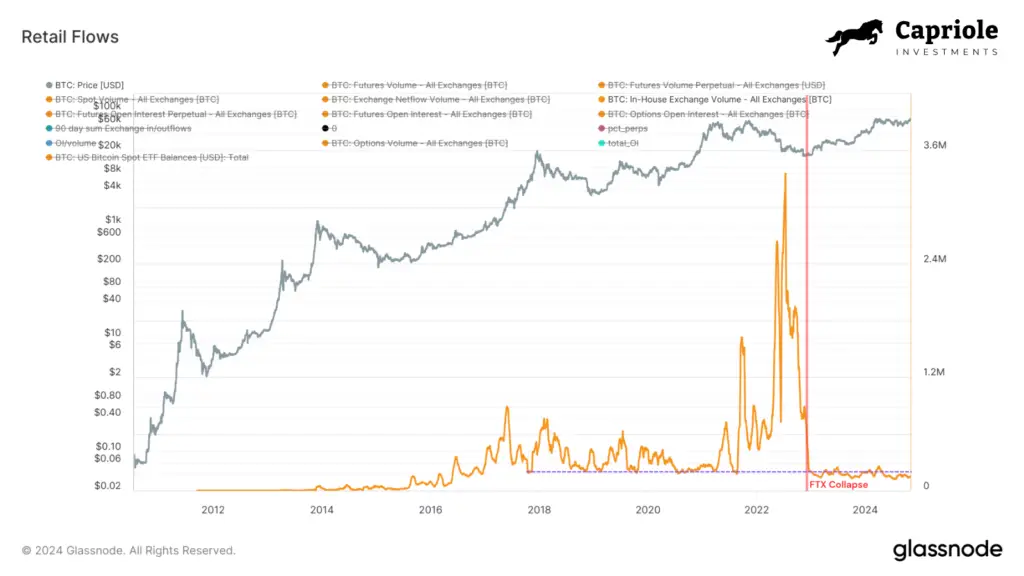
Since the FTX collapse in November 2022, in-house exchange volumes, the amount of BTC moving between wallets on exchange, is still below the floor of the 2017-2021 cycle. This metric has clearly seen no like-for-like BTC growth since the FTX collapse. This suggests exchange activity has not recovered from FTX.
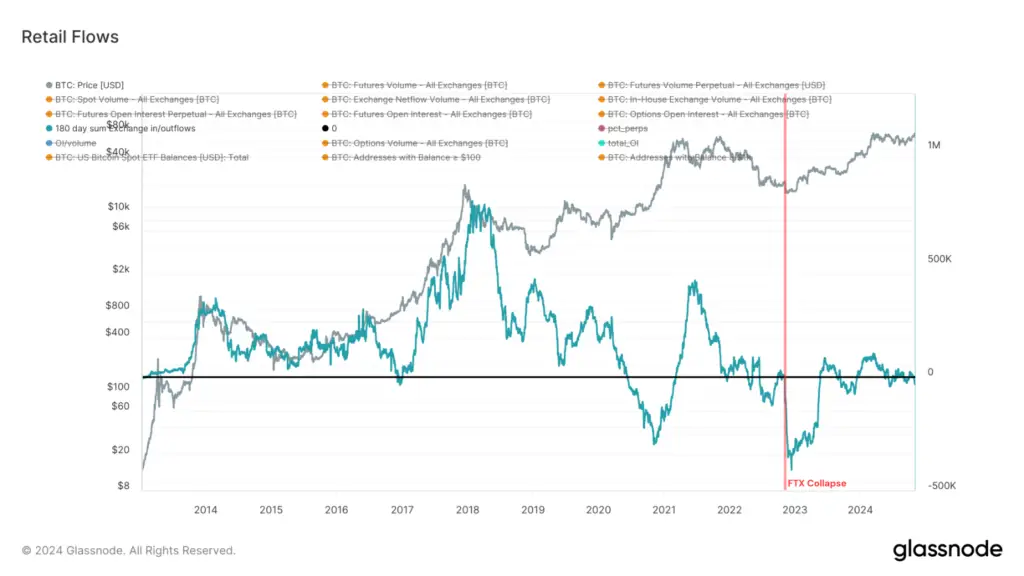
On the following chart you can see the 6 month sum of exchange in- and out-flows has been at and below zero since 2022 (new outflows). The extent of this phenomena has not been seen ever before in Bitcoin’s history. This suggests a continued lack of trust in exchanges (and/or in the benefits of trading on centralized exchanges) since the FTX fraud.
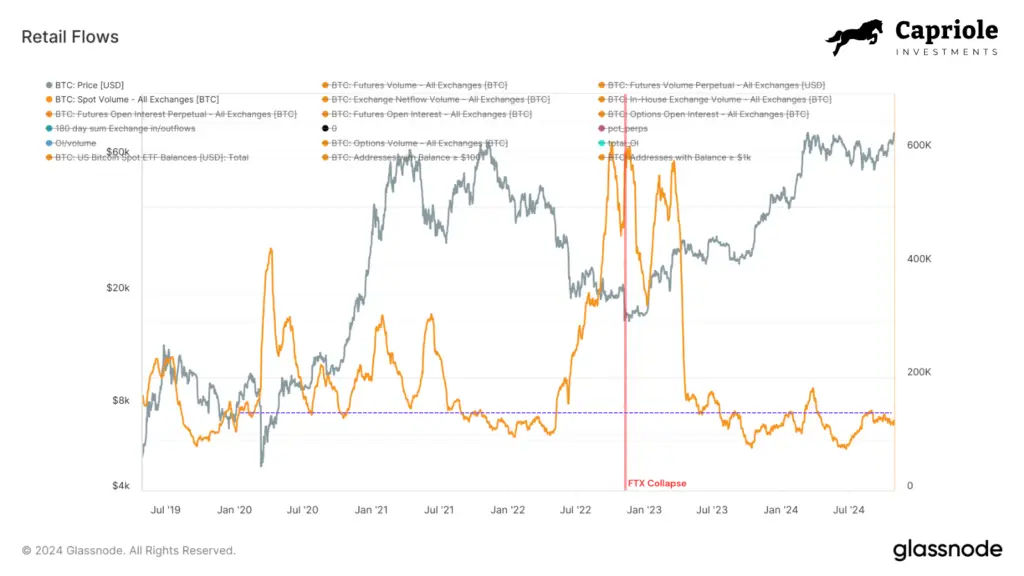
The next chart shows spot trading volumes in BTC. Again we see no growth since FTX, despite massive price appreciation, spot trading volumes are still less than 2020 and 2021.
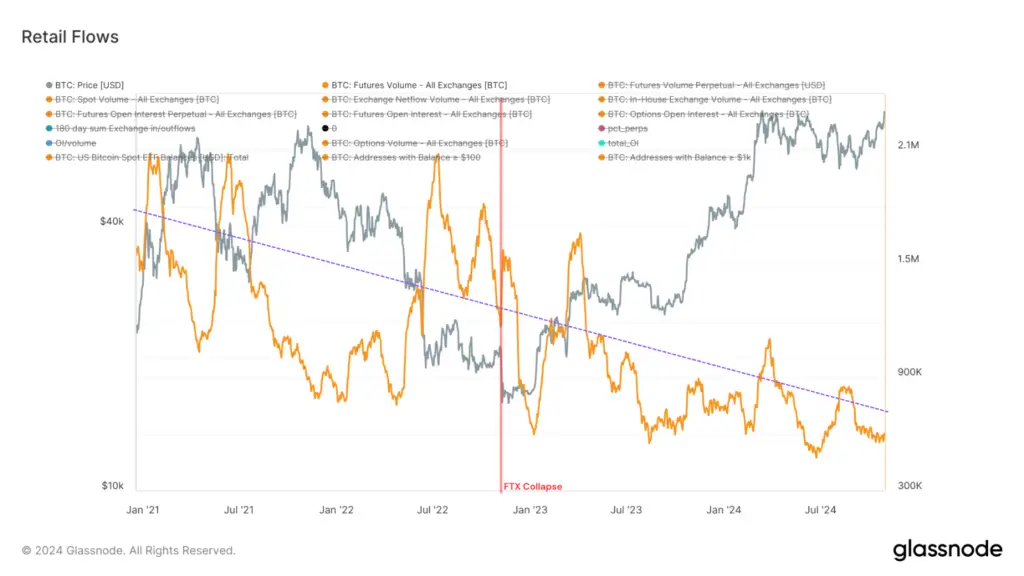
Total Futures trading volumes (incl. Perpetuals) is way down from 2021. This is a significant drop in on-exchange leveraged speculation.
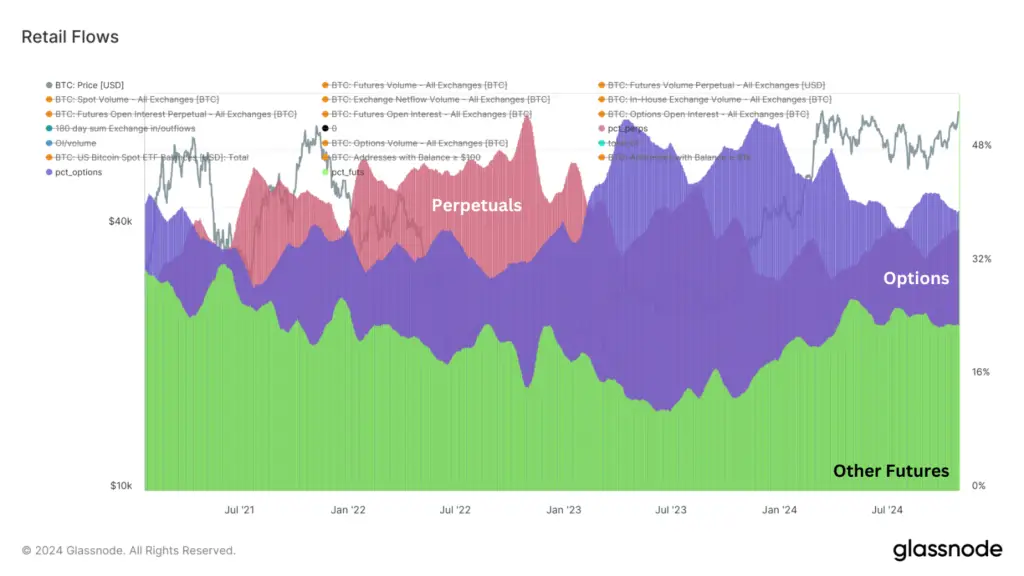
The next chart shows the relative Open interest (percentages) across Bitcoin derivatives markets covering Perpetuals, Options and Other Futures products. The chart suggest Perpetuals lost their lead in 2023, with Options taking the dominant market position today. This is indicative of the institutionalisation of Bitcoin, and a move away to the historic leadership of Perpetual contracts under a largely retail driven market pre-2022. Is the 100X leverage era gone?
The next chart shows the total derivatives market open interest (OI) is largely flat since the FTX fraud. The shaded light-blue area is the ratio of total OI to volume across derivatives markets. OI/volume is up about 300%. This represents a lot less trading turnover for a similar magnitude of total Bitcoin derivative positions; which suggests the market is taking on less speculation trades, and instead perhaps opting for more long-term positions and cash-and-carry arbitrage trades, a phenomenon also well discussed in a recent Glassnode newsletter.
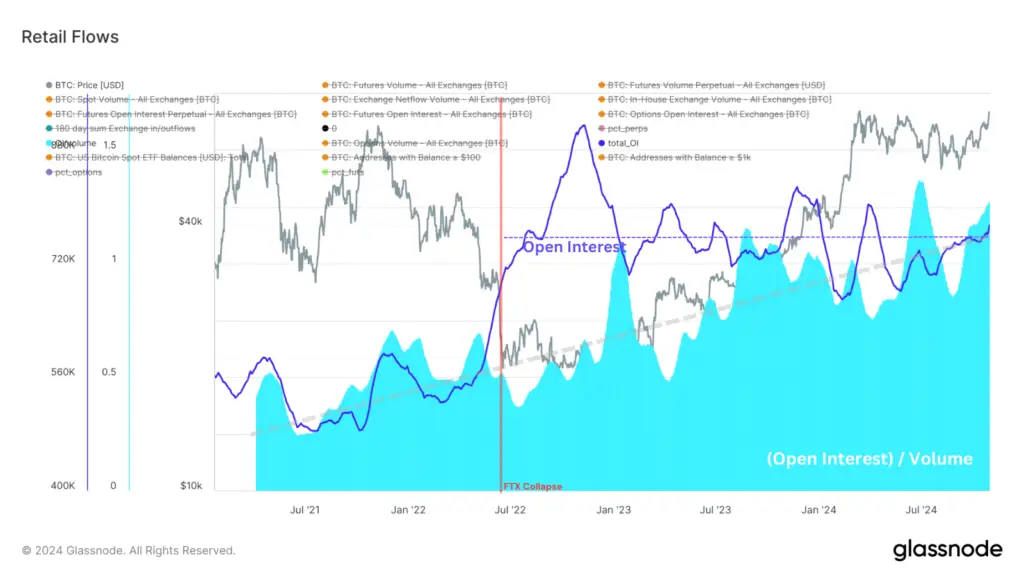
With OI at circa $42B today, one crypto native entity alone represents around 5% of that figure. Ethena, the crypto native cash-and-carry protocol arbitraging BTC and ETH perpetual futures funding rates. If just one crypto native entity represents 5% of OI, you can imagine that across the entirety of crypto and across the US Bitcoin ETFs (which alone now have assets under management near 2X the total Bitcoin derivatives OI); a significant chunk of OI that we see today is from institutionalized cash-and-carry trades and other market making activities.
Where is Retail?
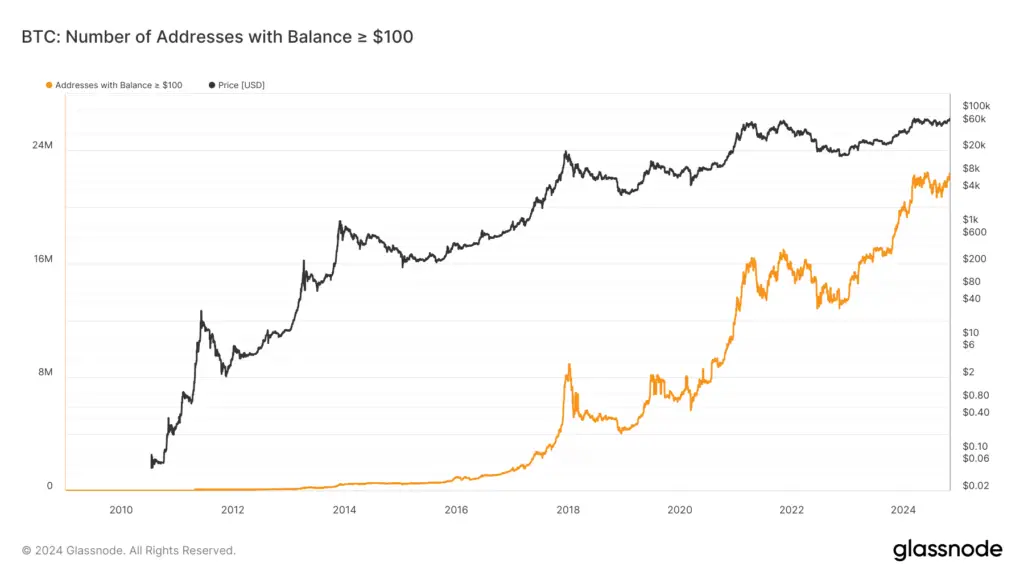
However, despite the low activity readings in on-chain and on-exchange data above, we conversely see that the number of Bitcoin investors worldwide (those with at least $100 on a wallet) is expanding rapidly in 2024 and consistently hitting new all time highs.
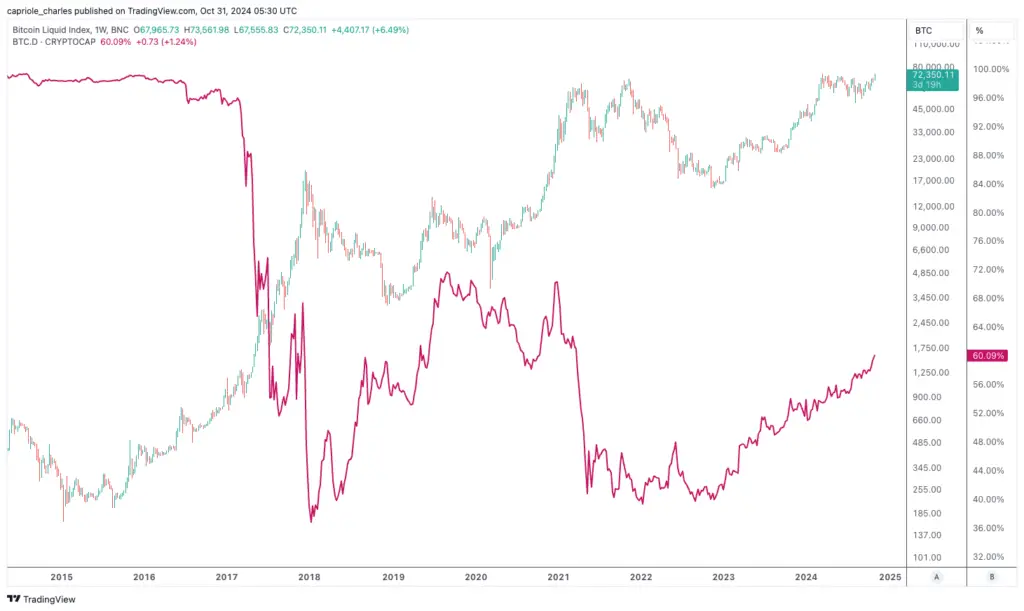
We can also see an industry wide preference for Bitcoin over other altcoins since the FTX collapse, with Bitcoin market dominance (its share versus the total crypto marketcap) growing from 40% to 60% today. A similar story can be told by simply looking at Ethereum’s performance, both across price (poor) and its comparable US ETF launch (lacklustre uptake).
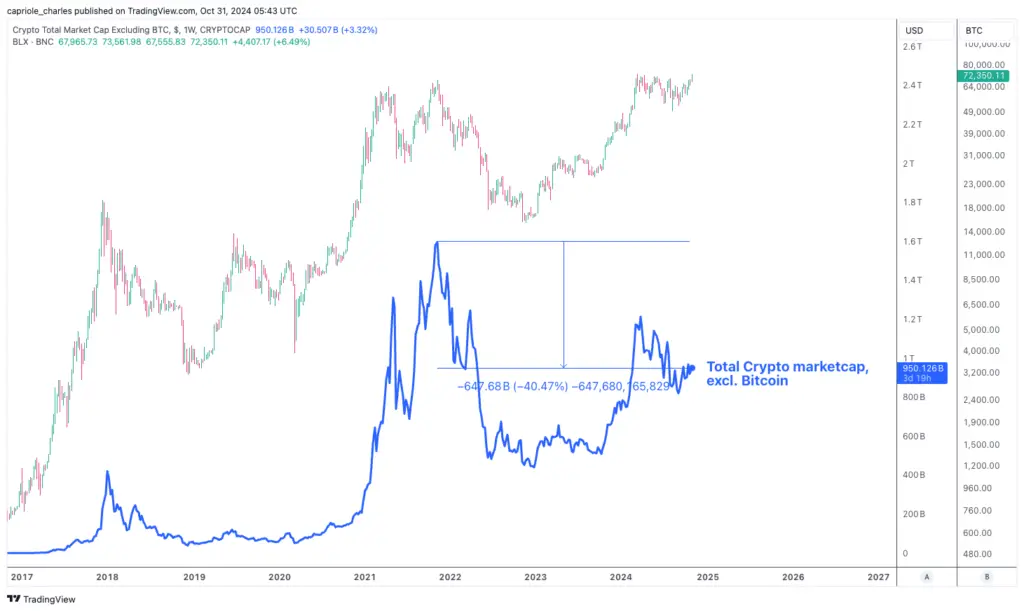
Presented a bit differently below, we see that total crypto market cap excluding Bitcoin (i.e. all altcoins) is still down -40% from 2021 highs. Again highlighting the market preference for Bitcoin since 2022.
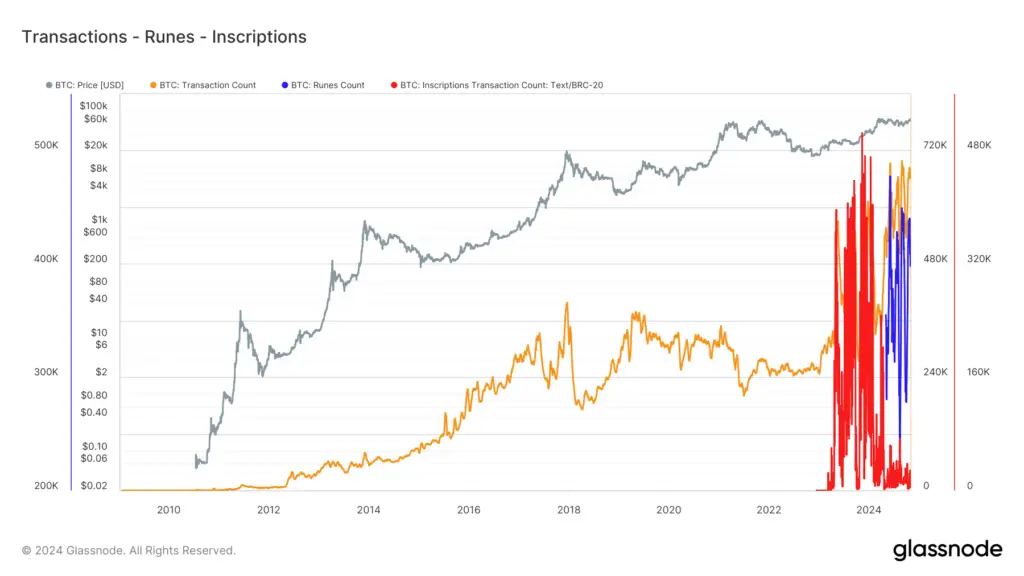
We also see on-chain transactions are booming in 2024. As the below chart shows, all of this Bitcoin on-chain transaction growth is fully explained by the rise of Inscriptions and Runes. Net of these two, on-chain activity is actually down. In short, all of Bitcoin’s transaction growth in 2024 is from Runes as of writing. All speculative growth here is in Inscriptions and Runes. By way of example, Runes can be used for Bitcoin native NFTs (digital art) and Memecoins.
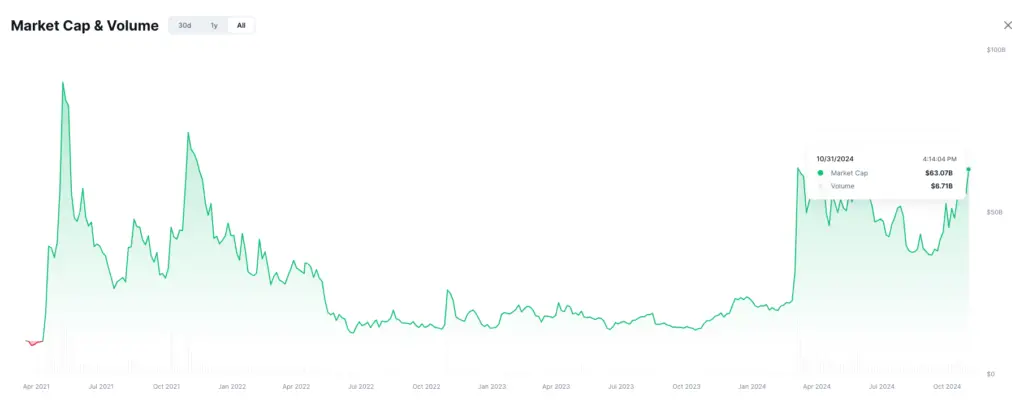
Other notable areas of crypto growth in the last year include Memecoins, which have seen their market capitalization grow from $14B to over $63B today across all cryptocurrencies (per CoinMarketCap).
And of course, we have the massive growth of Bitcoin ETFs, whose holdings have reached 1M coins in less than a year. That’s over 5% of all supply when you exclude lost coins.
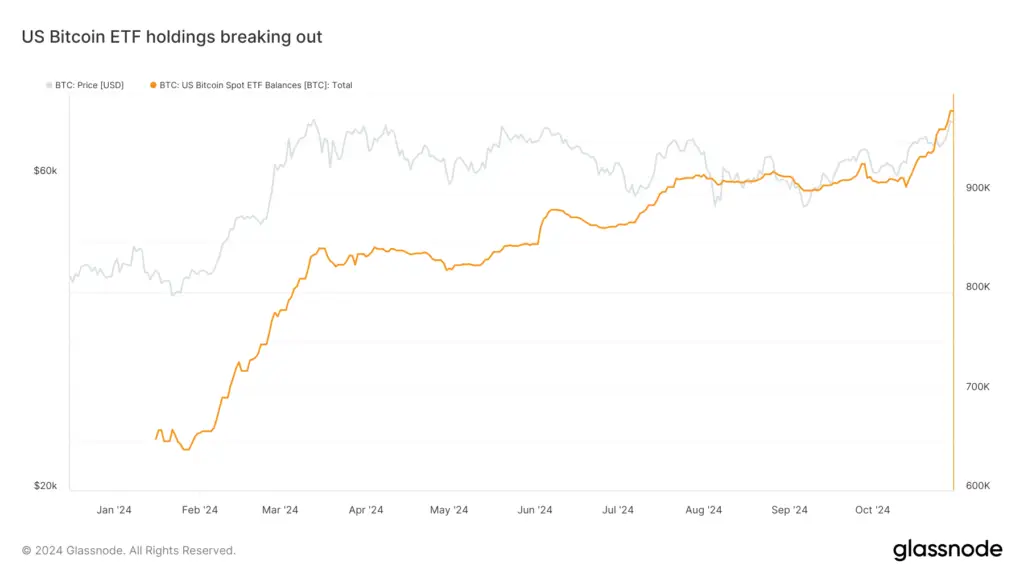
This tells us that retail traders:
- Have a stronger preference for investing and hodling Bitcoin (on-chain and via ETFs)
- Are not utilising centralized exchanges and leverage like in previous cycles (yet)
- Are buying less altcoins
- Conducting limited speculation at the fringes, mostly on-chain (Runes, memecoins)
Implications
Very healthy, Sustainable Bitcoin Appreciation
All of this suggests a very healthy Bitcoin rally to $72K today. While we are trading near all time highs, we have not yet seen speculation near the levels of prior Bitcoin cycles and bull runs (2016-17, 2020-21). Strong crypto markets are formed by strong Bitcoin leadership which then allows capital to flow down stream. Provided Bitcoin’s relative strength can continue beyond prior all time highs without dramatic increases in market leverage, this sets a positive frame for late 2024 and 2025.
Institutional Adoption
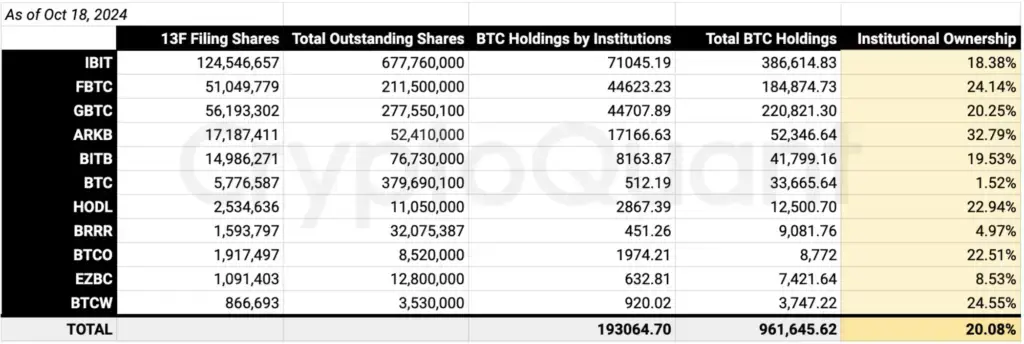
At the same time we have seen increased institutional adoption of Bitcoin via ETFs, and from the growing use of Tradfi dominant products (options and CME futures). As Ki shows, over 1000 institutional investment managers (investment firms with over $100M in assets) now represent approximately 20% of Bitcoin ETF holders. This number doesn’t include smaller asset manager and other companies holding Bitcoin ETFs on their balance sheet. That means 10s of billions of dollars are being invested in the Bitcoin ETFs by businesses in 2024.
Not to mention Microstrategy alone which now holds $18B Bitcoin.
If retail speculation is low, and institutional adoption of Bitcoin is growing rapidly, this suggests a very “Player-vs-Player” (PvP) environment today, where those actively trading Bitcoin and altcoins (especially on exchange) are up against experienced professionals, making it a more challenging trading environment at present.
Funding Rates low signal
It also suggests historically powerful predictive metrics like “funding rates” are not very valuable at present; because:
- Funding rates are being dampened by cash-and-carry traders (like Ethena), adding noise to the signal
- More trading is longer-term (lower leverage and lower risk)
- Retail isn’t using leverage like it has in the past, and
- Perpetual futures market share has collapsed in the last 2 years against Options and CME. So they have much less importance in the market.
A once incredibly powerful trading signal in Funding rates is a lot less useful today. This could all change very quickly with the resurgence of retail traders in the future.
Going Forward
Despite Bitcoin being up 4X since the FTX collapse, exchange activity and use of retail leverage has remained constrained. Bitcoin as a safehaven has been the preferred investment approach and despite all the social chatter about Memecoins, their market share remains less than 3% of the total Crypto market cap today ($2.4T).
If history is anything to go by, we usually see renewed growth in speculation type activities when Bitcoin trends beyond all time highs. This era may be just in front of us, opening up a more speculation driven environment, stronger retail growth and broader price appreciation across cryptocurrencies. A more “Player-vs-Environment” landscape. That trigger may be increased certainty following conclusion of the US election.

Charles Edwards


2 Responses
Great article, thanks!
One comment on the spot trading volumes in BTC charts. While it’s true that the volume in BTC is low, isn’t so that the volume in $ is actually pretty robust (although not great)?
Can another (complementary) interpretation be that Bitcoins are simply getting more scarce, so basically there is less Bitcoin available for sale?
Yes this is true, it does look a bit better in USD terms. Though I like BTC terms for a ‘like for like’ comparable as the market grows. Nonetheless, even if you compare volumes today versus similar price points in 2021, volumes are lower. In conjunction with all the other metrics here, I think it paints the aggregate picture I suggest in “Implications” below. Especially when you look at Derivatives volumes and the decline of Perps against Options.