Is the Cycle Top In?
Welcome to Capriole’s Newsletter Update #52. A consolidation of the most important Bitcoin news, technicals and fundamentals.
A month ago we had a technical breakout of $65.5K monthly resistance and strong on-chain fundamentals. It looked very positive. But things turned sour quickly. Days later we saw a $70K breakout turn into a fakeout. At the same time, Capriole’s Bitcoin Macro Index turned negative at $67.5K. Summer month downward pressure kicked in and so far the “Sell in May” proverb is standing the test of time. We’ve just had our second retest of $58K.
Never before has Bitcoin broken a new all-time high and had two retests instead of printing new highs. There is a chance this is a function of size, and more time in consolidation at these highs is required before a breakout. Nonetheless, this is still a sign of weakness, as usually Bitcoin would not look back.
So what is going on?
This issue, we will revisit the Bitcoin Top-Signals thread I published a in April 2024, and see if that can share some insights. I will compare each chart using the same method from then, to the data today, scoring each as bullish/bearish/neutral.
Brace yourself, it’s about to get bumpy…
Chart 1. Supply Delta + 90 Day CDD
These two metrics are great at identifying cycle tops. After they go vertical, watch for a rounded top in both metrics.
On the left is the chart I shared in the thread back in April, the right is how it looks today. After going vertical in April, a rounded top has printed locally on both metrics.
Score: Bearish
Watch it here: https://studio.glassnode.com/workbench/d411d52a-2d1d-4bb7-48c7-e76b49bfd203
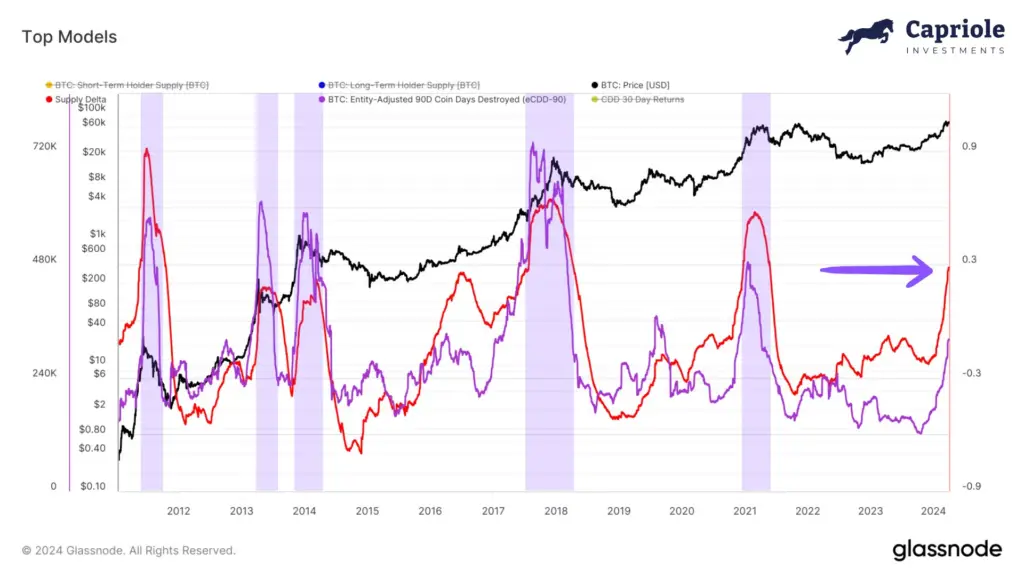
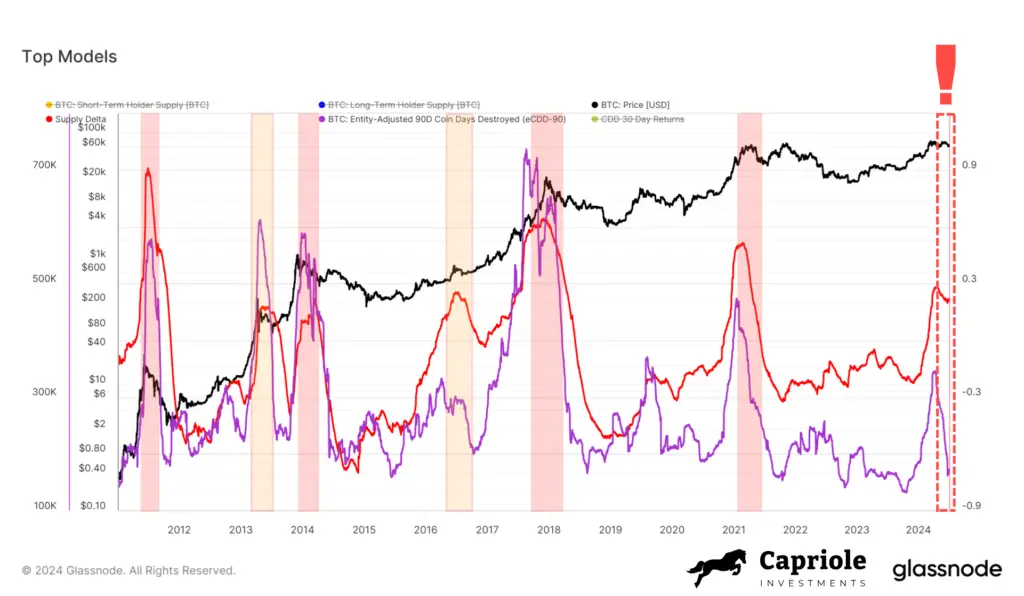
Chart 2. Long-term Holder Inflation Rate
In April I wrote: “At 0.5 today, we still have quite a bit of room until the 2.0 threshold hits which typically marks a high likelihood of the cycle top being in.”
At 1.9 today, we are too close to that level for my liking.
Score: Bearish
Watch it here: https://studio.glassnode.com/workbench/cded3cea-ee51-4689-4635-0b2995483297
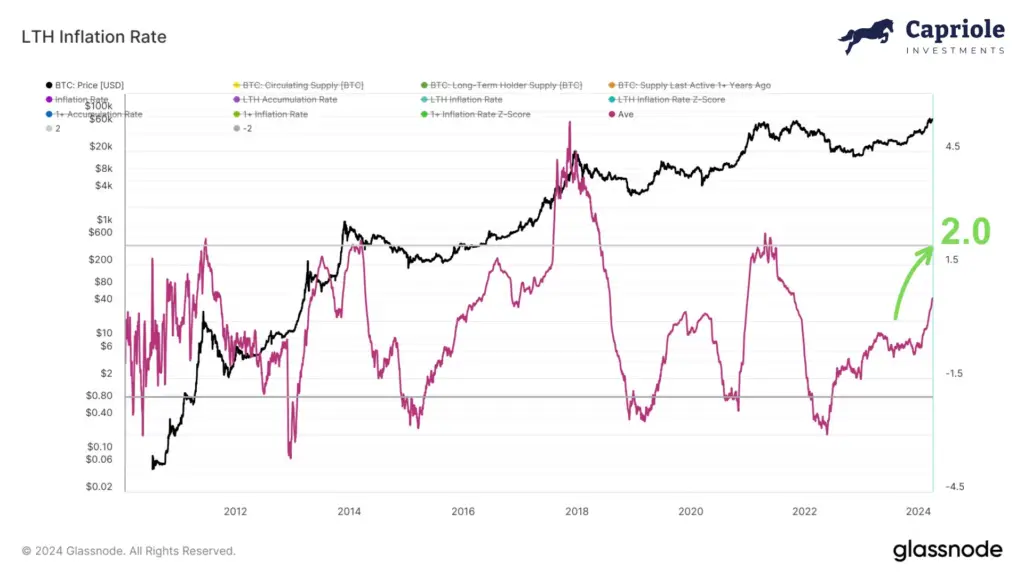
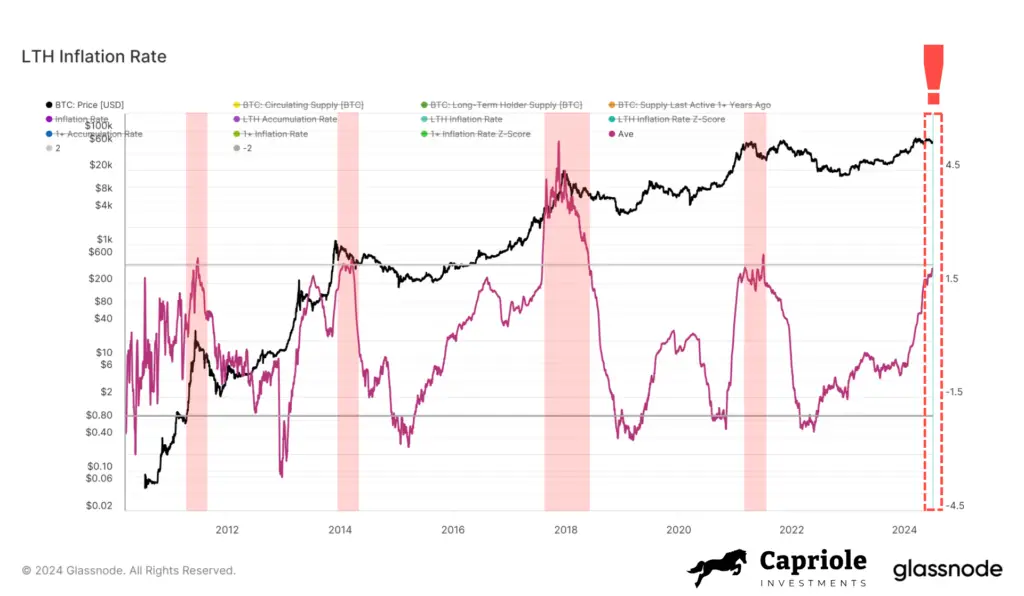
Chart 3. Hodler Growth Rate
This metric tops when Bitcoin’s diamond hands start selling into profit. That process has already begun. Cycle tops typically occur when HGR hasn’t made a new high in 6-9 months.
We are 6 months in today.
Score: Bearish
Watch it here: https://studio.glassnode.com/workbench/cdd5b4a1-9931-443b-63d4-9ce7e4bb8b46
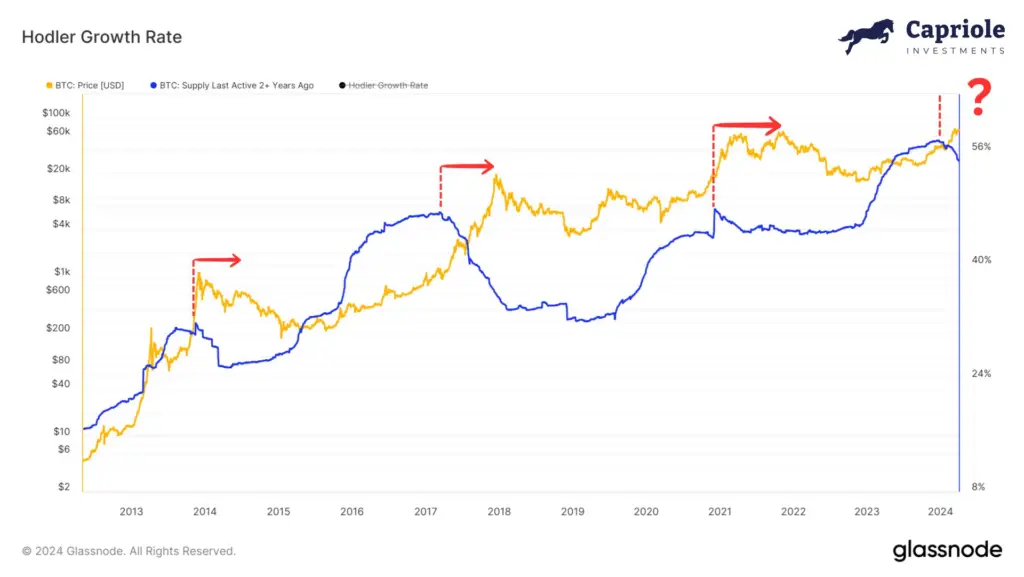
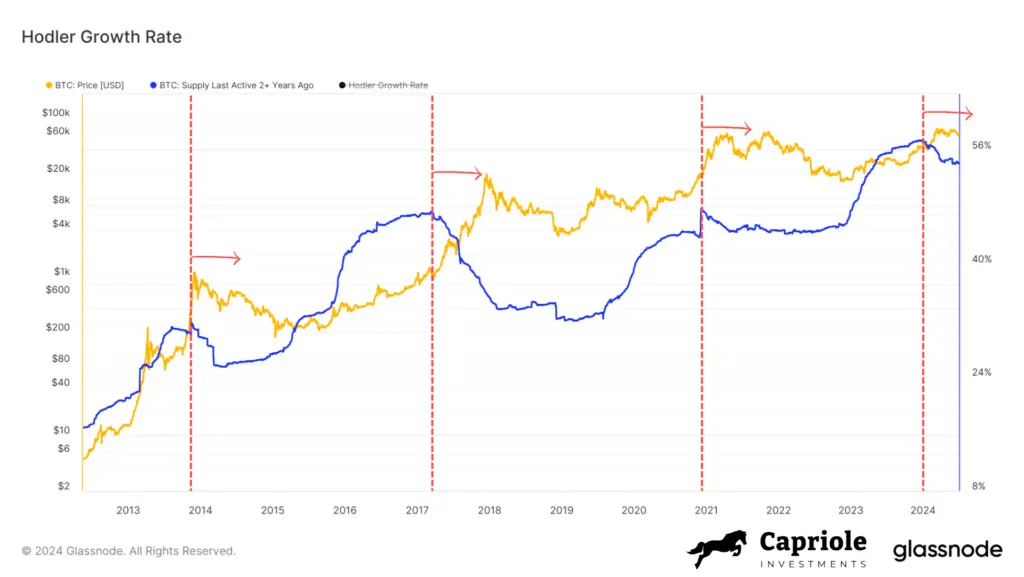
Chart 4. Bitcoin Heater
Extended periods of extreme funding/basis/options readings were a good warning sign last cycle.
Today, we are smack bang in the neutral zone. Nothing to write home about here.
Side note: We also have not seen any real new leverage enter the market this cycle. Check out the “Bitcoin OI / Market Cap” chart at the link below too. Both of these charts tell me there simply has not been the exuberance you would expect for a major market top to be in.
Score: Neutral
Watch it here: http://Capriole.com/Charts
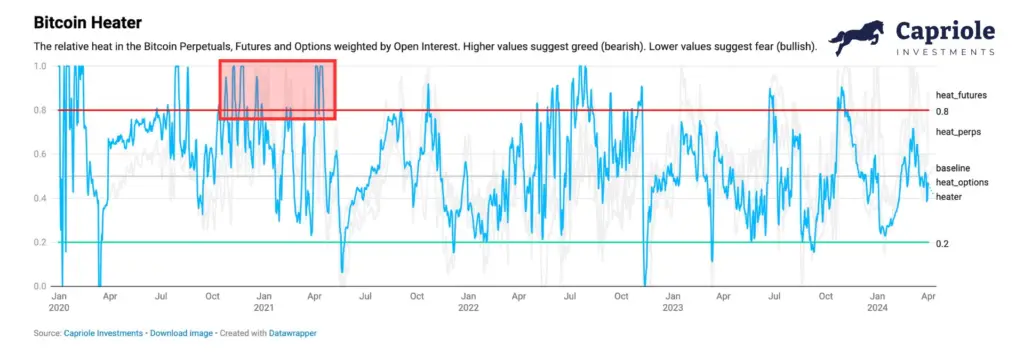
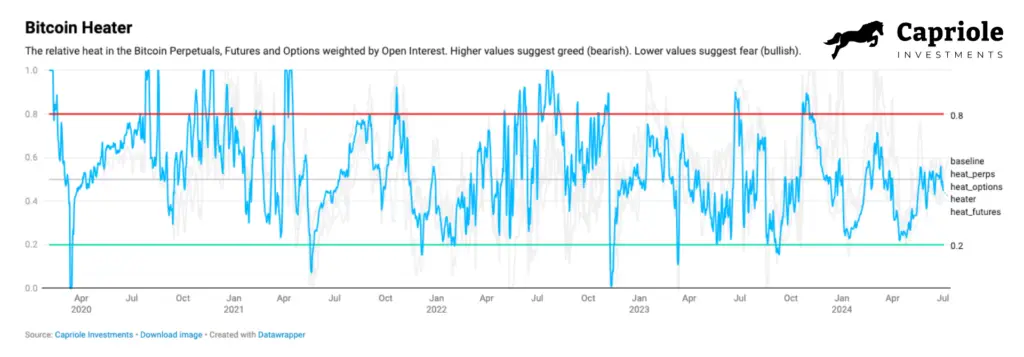
Chart 5. Dynamic Range NVT
Assesses the relative value of the network by comparing onchain transaction to Market cap. The good news: this metric is coming out of the value zone. A result of increased onchain transactions from Ordinals and Runes.
Score: Neutral
Watch it here: http://Capriole.com/Charts
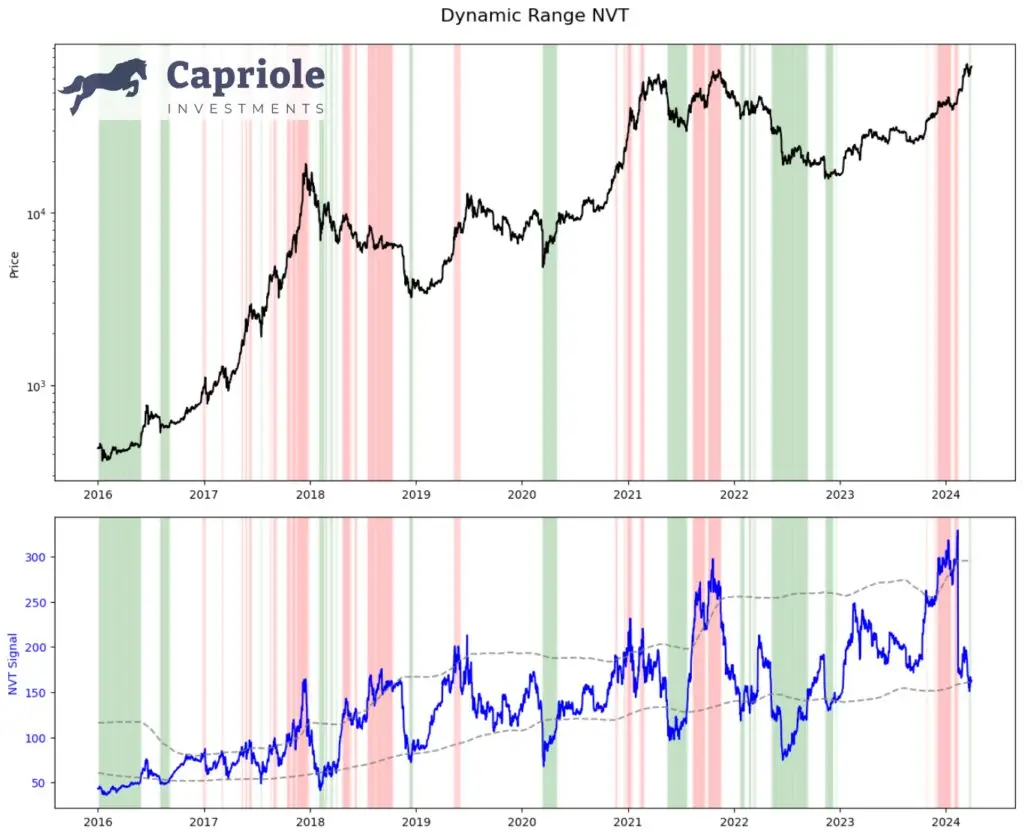
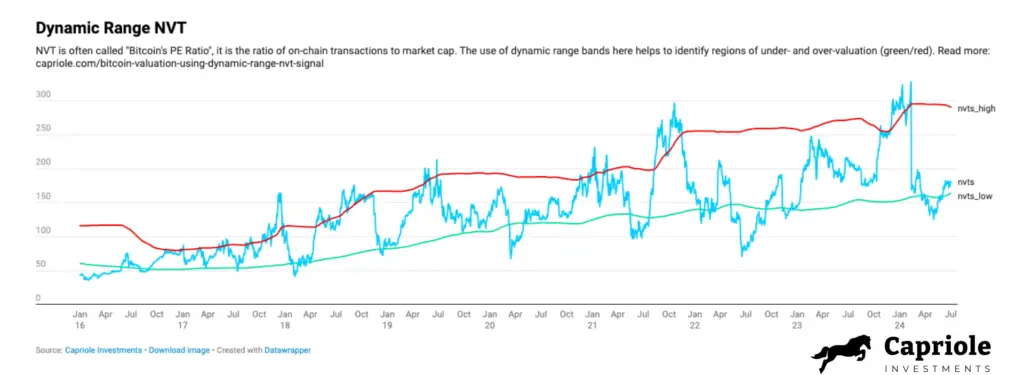
Chart 6. On-chain Transaction Fees
Periods of high transaction fees suggest a spike in demand. When the period of elevated fees then collapses back down for a period of time, it’s almost always just after the market peak.
In April I wrote: “The current fee decline today is not desirable. Worth monitoring closely.”
The situation today is quite similar. The trend definitely looks concerning, but some recent significant spikes suggest it’s probably best to check back here in 2-3 months and see how we are faring in Autumn.
Score: Neutral
Watch it here: https://studio.glassnode.com/metrics?a=BTC&category=&m=fees.VolumeMean
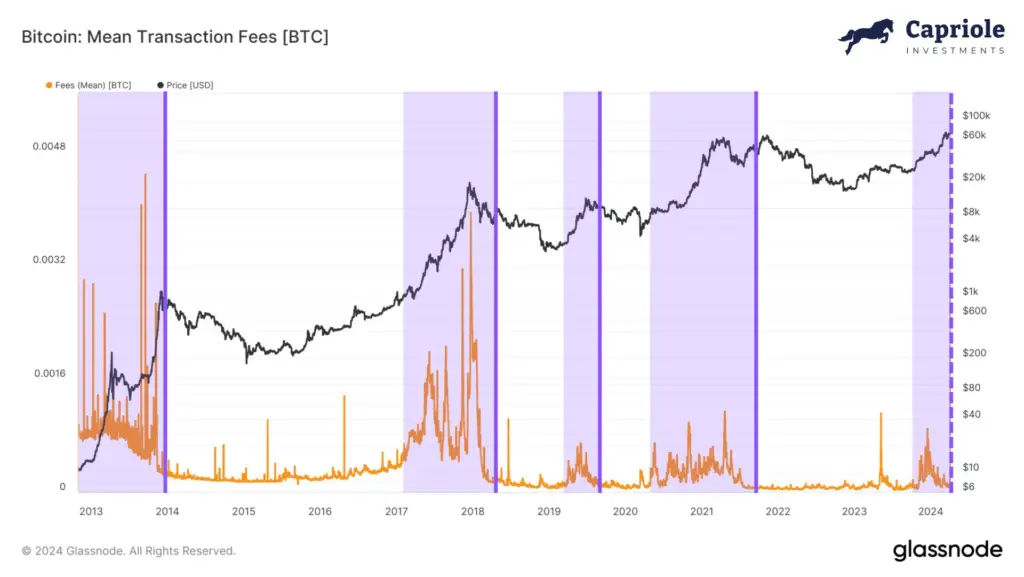
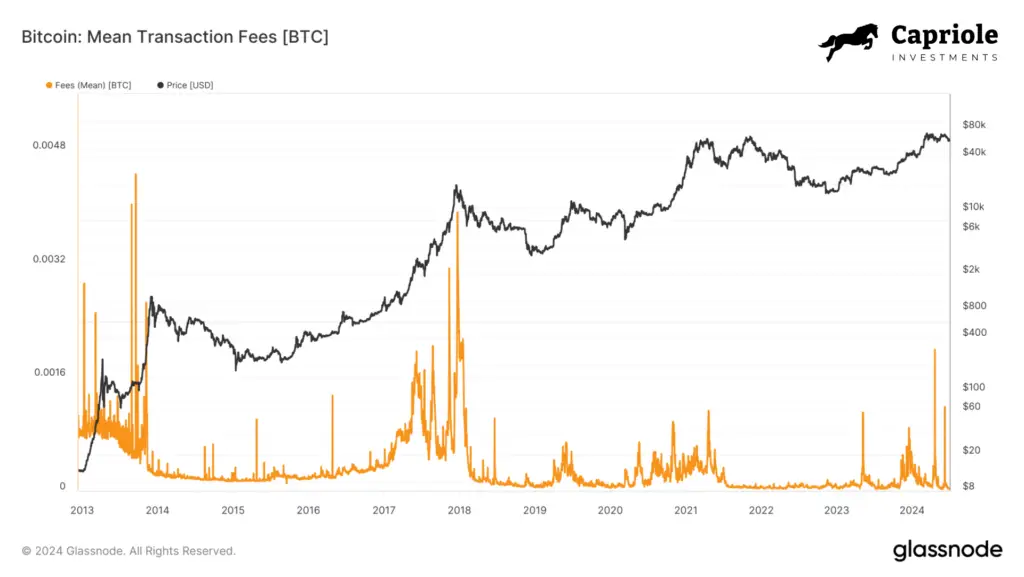
Chart 7. Net Unrealized PnL (NUPL)
NUPL in the “Euphoria” zone (more than 75% of participants in profit) is a classic marker for froth and a zone for increased caution.
We are (still) not there yet… but we did hit 74%. I would argue not enough for a top but also too close for comfort.
Score: Neutral
Watch it here: https://studio.glassnode.com/metrics?a=BTC&category=&ema=0&m=indicators.NuplMore155AccountBased&mAvg=7&mMedian=0
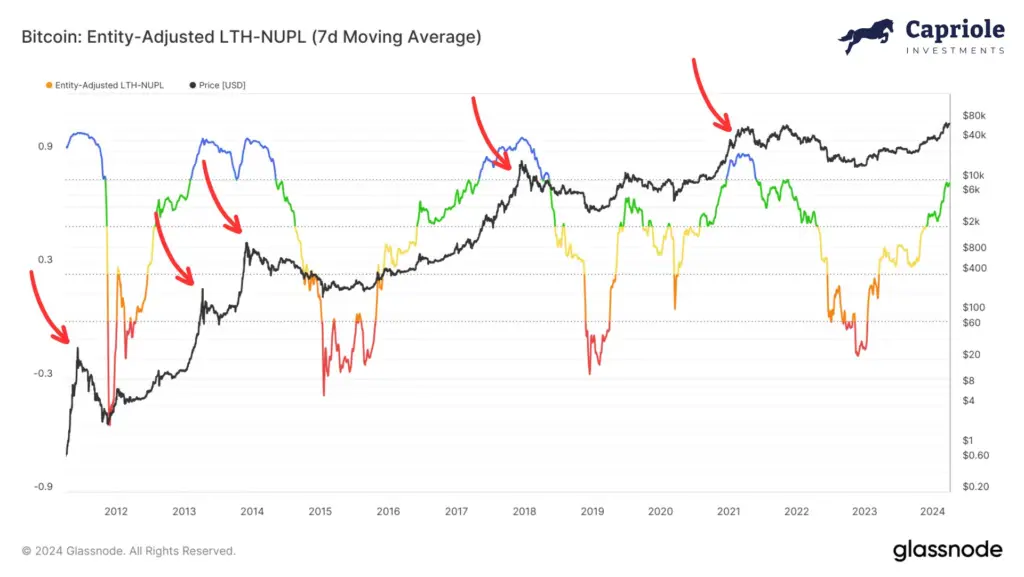
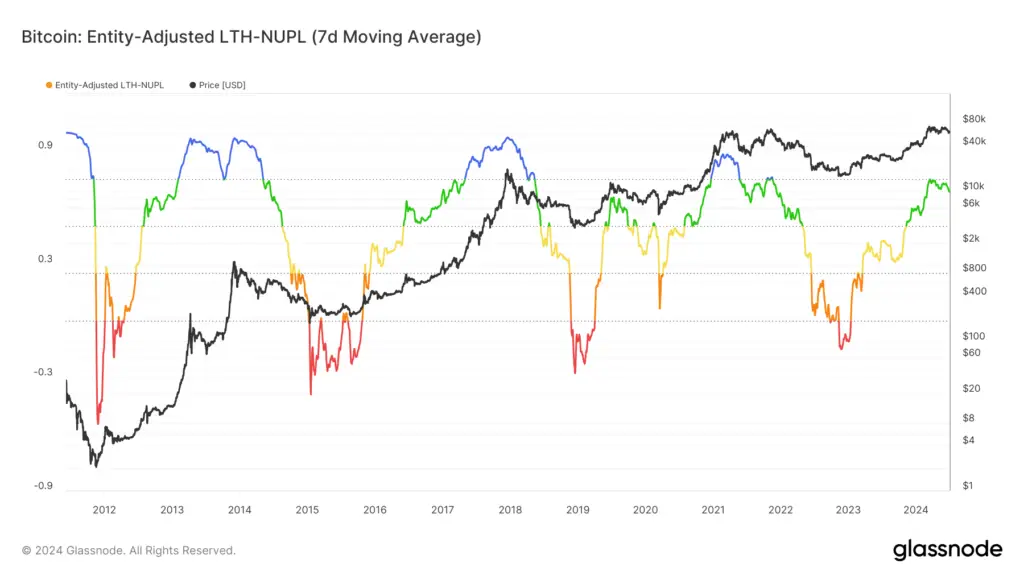
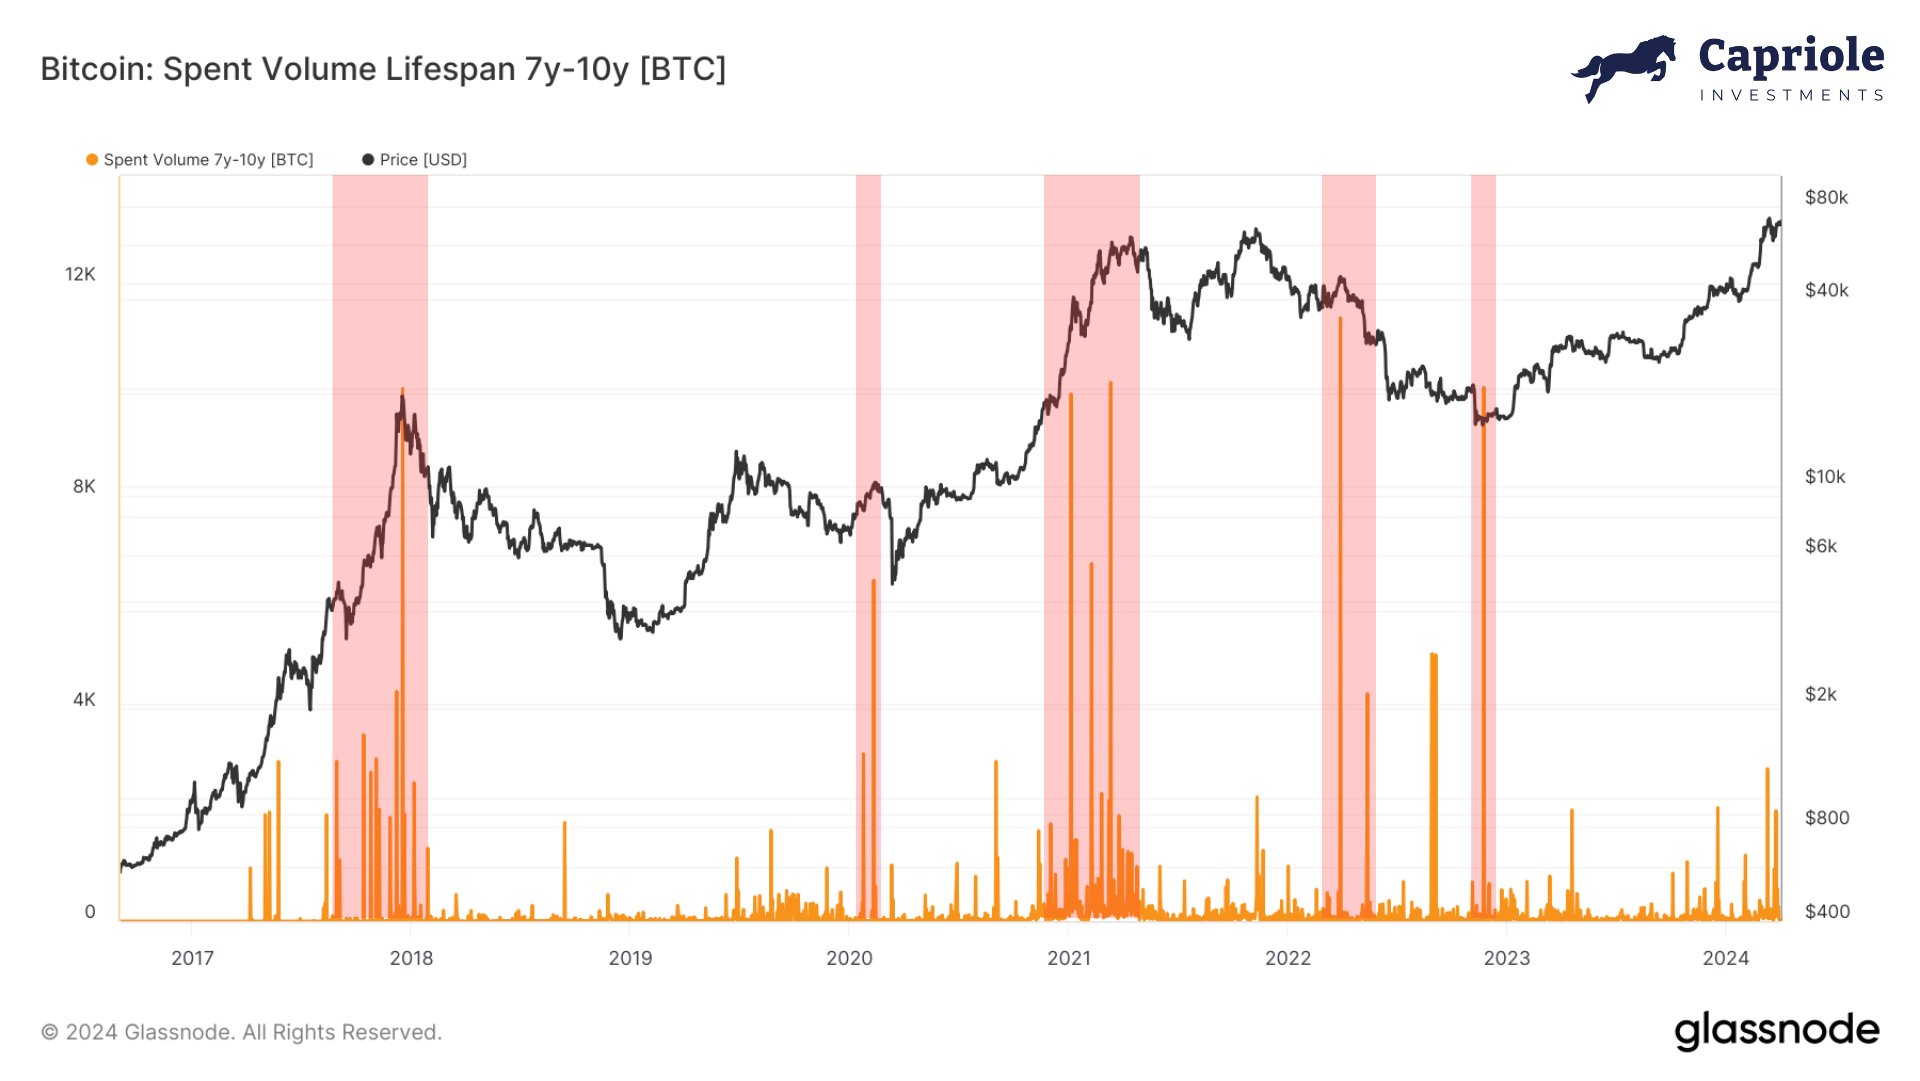
Chart 8. Spent Volume 7-10yr
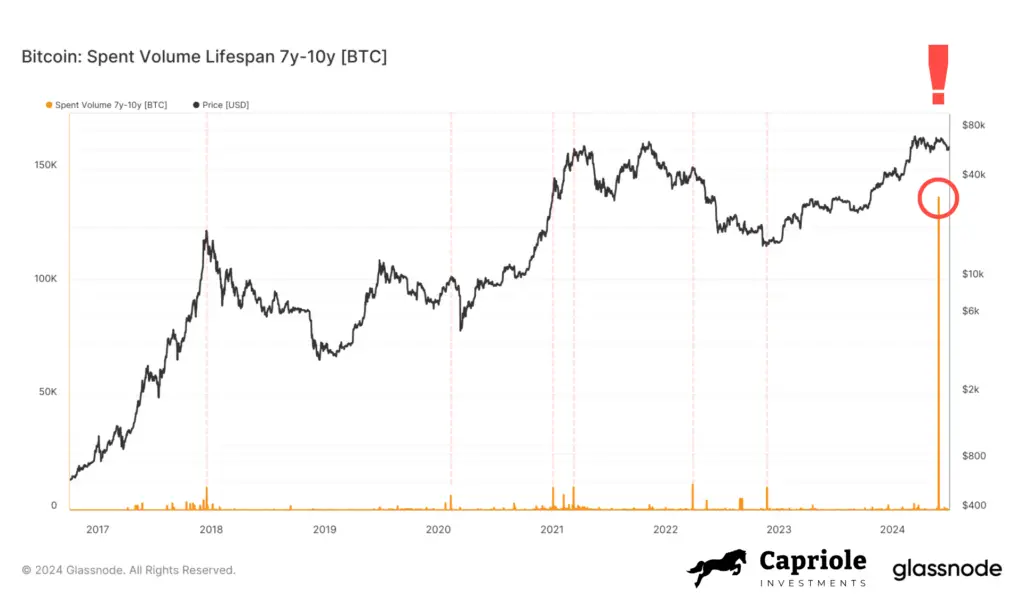
Whales typically unload around cycle tops. You can see growing clusters and spikes in Spent Volume to help guide areas of growing risk. Note the one false signal here when the FTX fraud was exposed. Also note, growing spent volume in 2024 suggests this cycle is progressing fast.
This chart is a banger this issue. The entire left hand side chart has disappeared in the updated chart today. An enormous amount of coins were moved on chain on 28 May, more than 10X more than the previous all time high, rendering all of Bitcoins onchain history as seemingly puny. 138K Bitcoin were moved. $9,000,000,000. But by who?
Mt. Gox.
It looks like those distributions really are coming.
Score: Bearish
Watch it here: https://studio.glassnode.com/metrics?a=BTC&category=&m=indicators.Svl7Y10Y
Chart 9. SLRV Ribbons
When SLRV Ribbons reaches an elevated point, and the slow moving average (red line) creates a rounded top, we have a bearish crossover, and you get the below four risk signals.
SLRV hasn’t yet gotten very elevated this cycle, and the slow moving average is still trending up suggesting the top may not be in. Nonetheless, As of May, it is in a bearish trend for the first time in 2024.
Score: Bearish
Watch it here: https://studio.glassnode.com/workbench/btc-slrv-ribbons
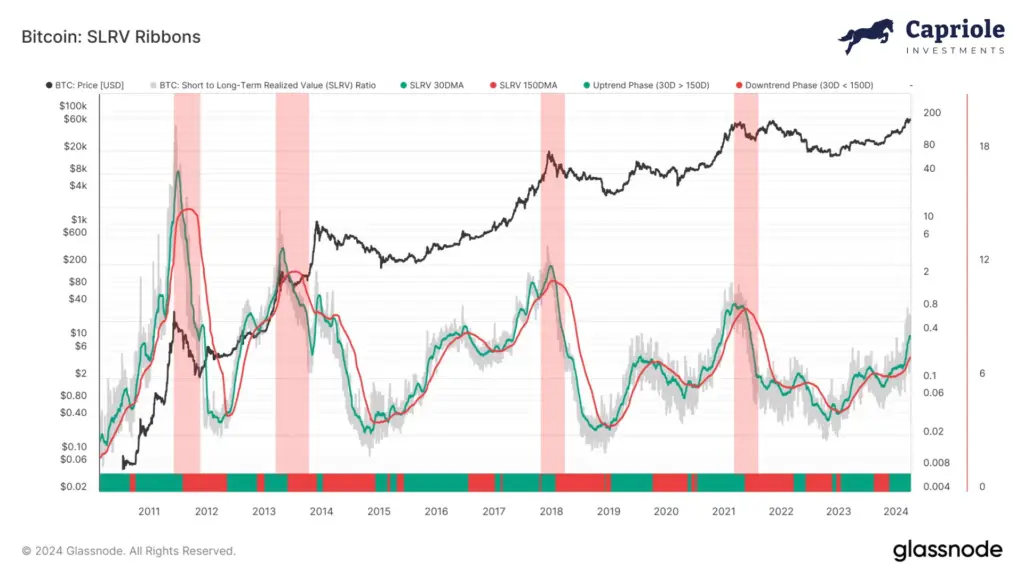
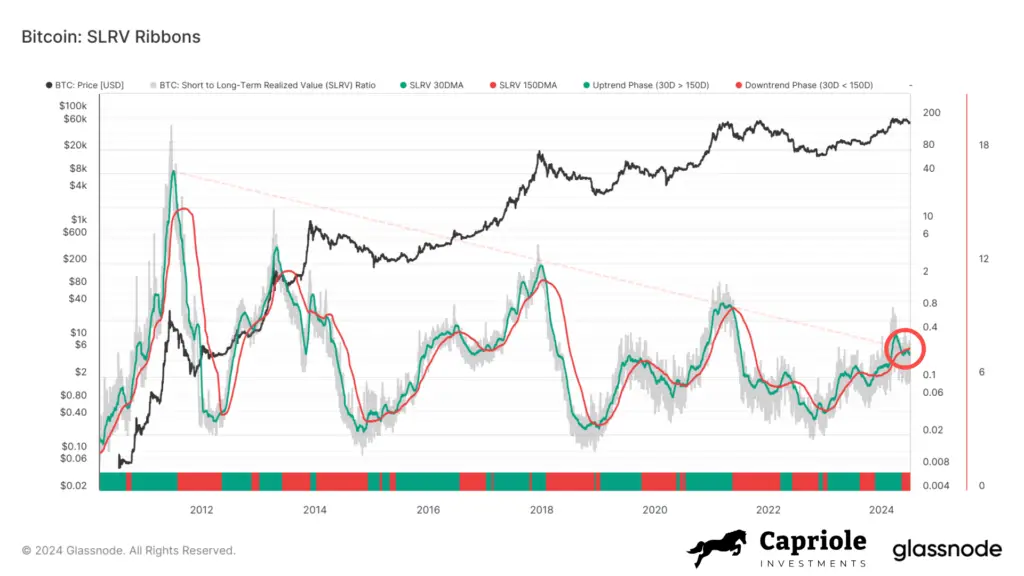
Chart 10. Dormancy Flow
In April I wrote: “Quite concerning today, Dormancy Flow has peaked significantly suggesting the average age of coins spent is significantly higher in 2024. Peaks in this metric (z-scored) typically see cycle tops just 3 months later.”
Well it’s now 3 months later. Price has only gone down and the Dormancy Z-Score peak remains in with a structure very comparable to the 2017 and 2021 tops.
Score: Bearish
Watch it here: https://studio.glassnode.com/workbench/44de4303-7adb-4527-5de0-f71cbaa7eff7
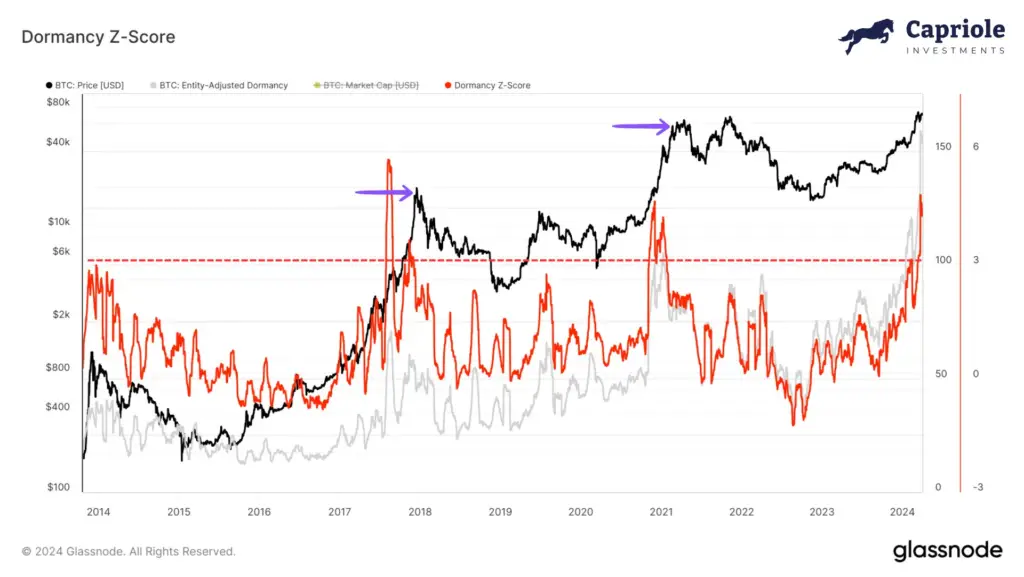
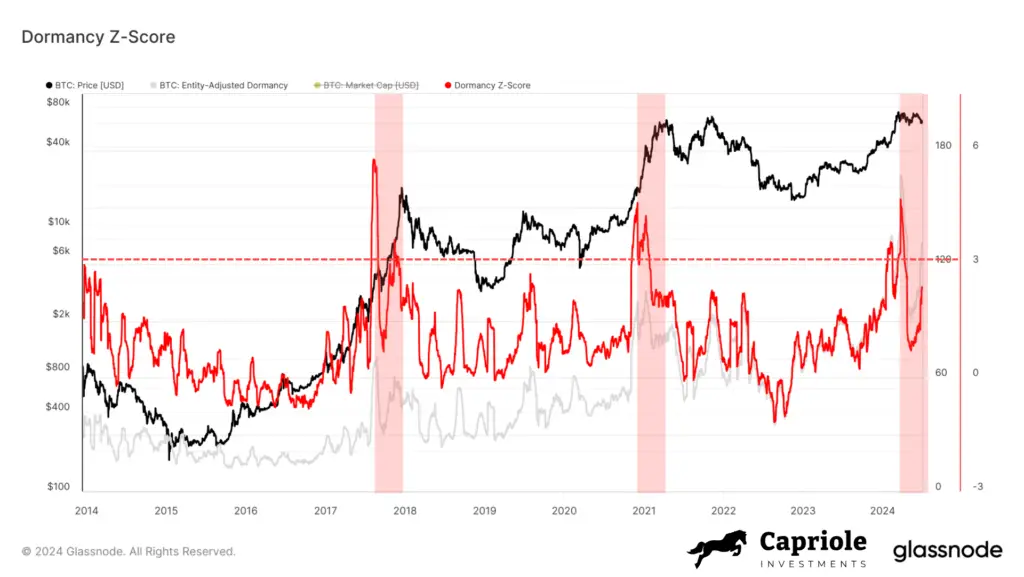
Chart 11. Percent Addresses in Profit
A more simple version of NUPL. There’s no fixed rule here, but the longer we have over 95% of addresses in profit, the more likely a cycle top is in. With price at new all time highs over the last month, this process has started. When this metric starts to drop down sharply, from 95%+, that’s the time to be concerned.
The chart speaks for itself.
Score: Bearish
Watch it here: https://studio.glassnode.com/metrics?a=BTC&category=&m=addresses.ProfitRelative
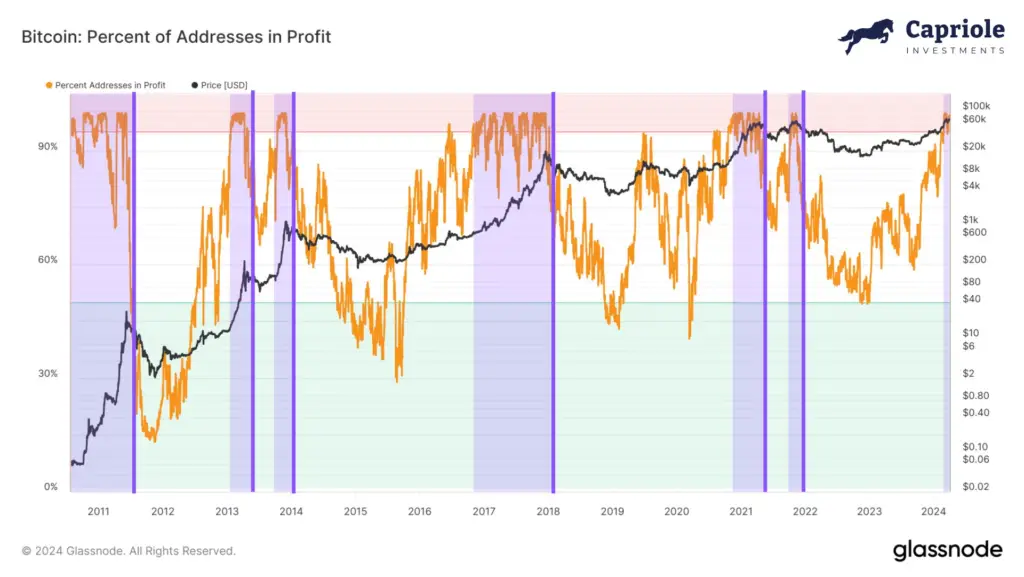
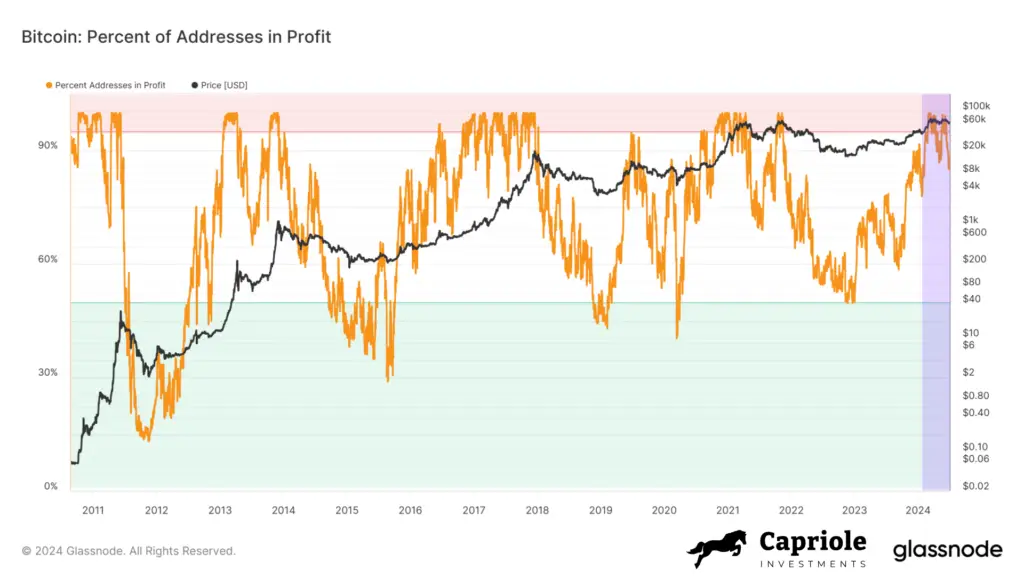
Chart 12. Mayer Multiple
Mayer Multiple readings over 2.5 have marked all the major Bitcoin cycle tops through history. Any reading above 2.0 brings growing risk of a cycle top. We peaked at 1.9 in March, and at 1.0 today, I tend to believe the top is not in on this classic metric.
Score: Neutral
Watch it here: https://tradingview.com/chart/VEriuguD/
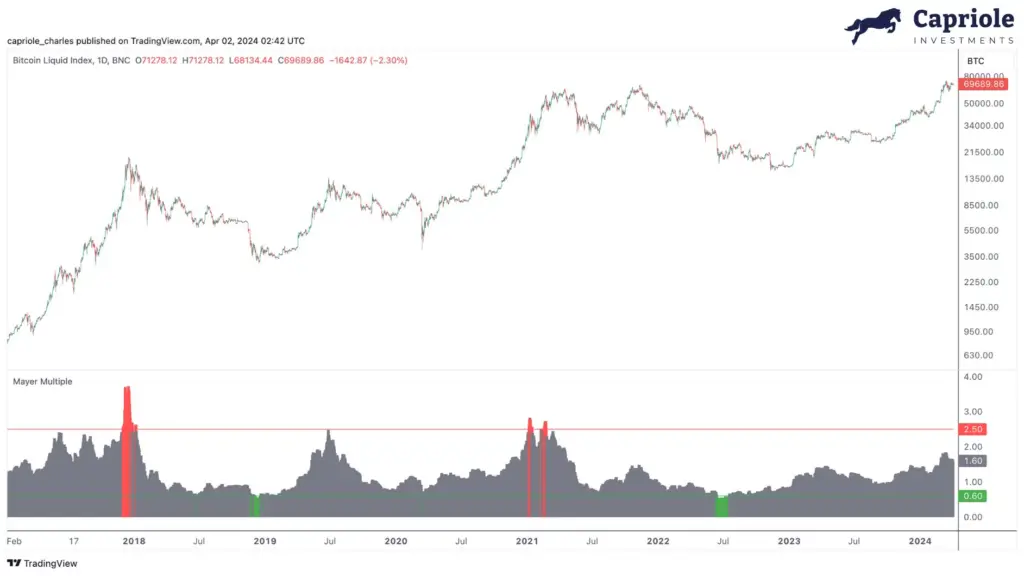
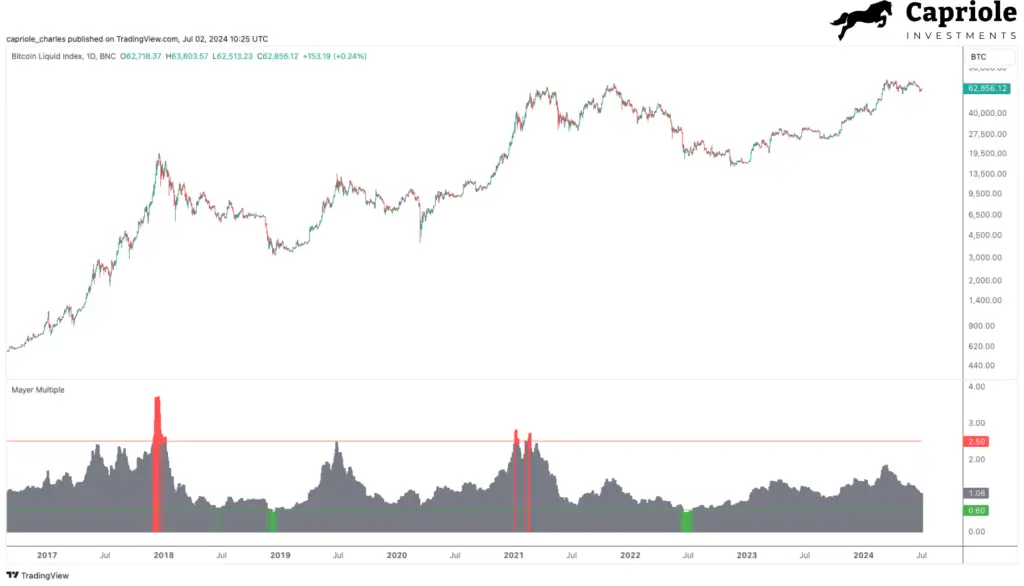
Chart 13. US Liquidity
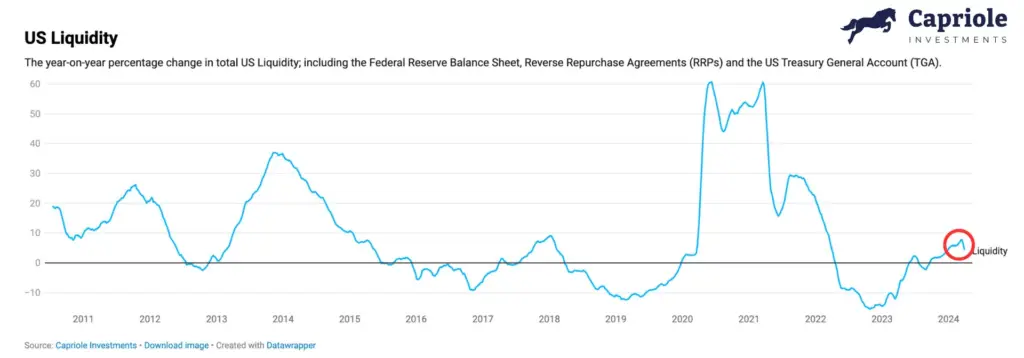
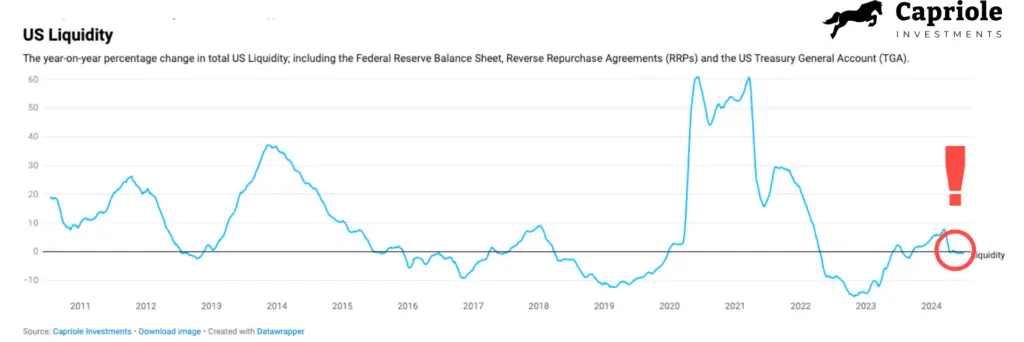
Liquidity drives markets. There’s a very strong correlation with this chart and Bitcoin’s price history. Up is good for Bitcoin, down is bad.
In April I wrote: “In the last two weeks we have possible signs of a (local) top. If this downtrend persists, that would be concerning.”
The downtrend did persist, and we have had negative liquidity growth for the last two months.
Score: Bearish
Watch it here: http://Capriole.com/Charts
Tally
It’s hard to sugar coat this. Just looking at the metrics in the Top Signals thread, we have a confluence for the cycle top being in with 62% of metrics being Bearish today:
- Bearish: 8
- Neutral: 5
Technicals
While the on-chain picture looks bleak, it’s important to note that the technicals are more mixed. We are still dancing above $58K support. As long as that holds, it’s technically bullish. We also have a possible Wyckoff Accumulation forming on the Daily timeframe. If the “top signals” data looked more neutral, I would find this an incredibly bullish setup. And it may still be, but we do not have confluence today and that means higher risk. Things could change quickly, in particular I will be looking to the Bitcoin Macro Index to start trending positively or for a Hash Ribbon Buy signal to fire to give renewed weight to the bull-case.
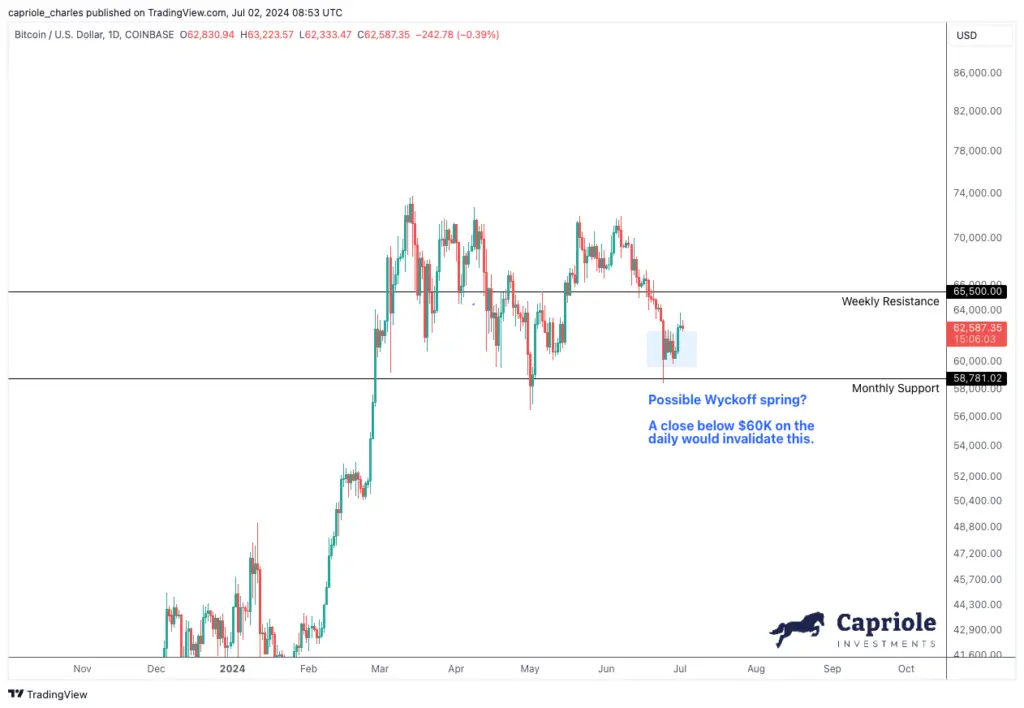
Monthly Support is intact and it’s usually unwise to get bearish at Support.
The Bottom Line
I won’t lie, I find this on-chain data hard to believe. I am surprised by the count of Bearish signals for being just two months post halving. While many of the 13 signals suggest the top is in, most also have not gone anywhere close to the level of extremity we saw in 2021 (though in 2021, this was also the case with reference to 2017).
It’s important to read this issue in context. Fundamentals look bearish, but technicals are still bullishly skewed. That leaves ambiguity here. All of the bearish Top Signals could be the result of typical summer months inactivity. Or perhaps this cycle will be a bit more like 2013 with a double top, or some hybrid mid-cycle grind that we must go through now given we are playing in the big league with the TradFi today.
As Bitcoin gets bigger, we shouldn’t expect the same level of extremities and signal clarity as past cycles. Flows are very different now with ETFs and it takes a lot more capital to move the needle as we enter the multi-trillions.
My gut tells me this is just an exceptionally bad summer period for Bitcoin on-chain activity, and we will see what is usually the best 12 month window for Bitcoin risk-adjusted returns post-Halving resume in Q4 and beyond.
I don’t think these Top signals should be ignored. Risk management in this region is justified. That said, a Daily (and better Weekly) price close below $58K (with all else equal) would certainly add technical confirmation and significant weight to a short-side case.
Until then, it doesn’t look great, but things could still restore onchain after the summer months.

Charles Edwards




2 Responses
from the last 2 cycles experience and subscribed multiple onchain data source and news letters. My conclusion? Using unchain is not very useful and accurate than TA. And when I am talking to TA, its not you and other “retail trader” level of TA, which is just drawing couple of lines and using RSI, MACD…. I am not using any indicators, just pure price action and doing fairly well.
Amazing as always Charles, Congrats.
I always learn so much from you. I also have my own on chain and classical t.a analysis , which even though are far from being as sophisticated as yours , it’s been signaling bearish and since yours are as well, I felt encouraged to share them here.
I’ve been able to identify retracement bottoms since 2019 fairly successfully, by “retracement bottoms” I mean pullbacks , and this time around I’m stuck at 40s, which oddly enough is somewhere around power law corridor stands..
Oh well, let’s see how it will play out , and if my rudimentary pullback signaling will actually fulfill in its 40s ..
Once again, thanks for your insights and takes.