Welcome to Capriole’s micro update. Where we consolidate the most important Bitcoin news, technicals and fundamentals into a 3-minute update. Two technical charts, two fundamental charts and our chart of the week.
Market Summary
Signs of life. The last week has seen the biggest improvements across Bitcoin technicals and fundamentals and the best long-side opportunities since June. Fittingly, just as we approach the latter stages of the typical seasonal summer market lull, with the October/November typically representing great allocation times for risk assets.
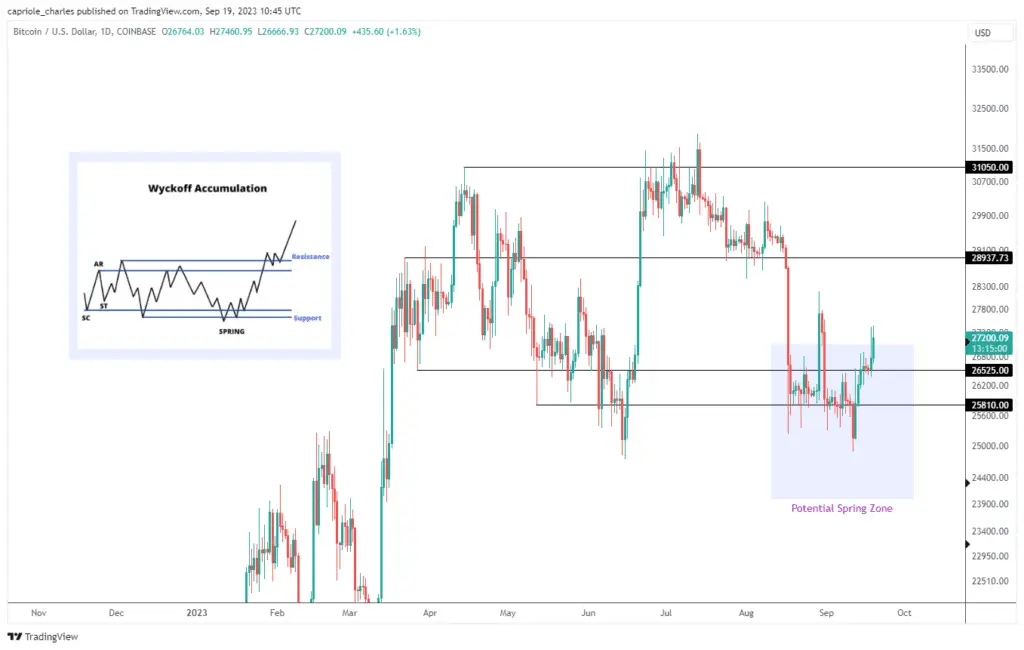
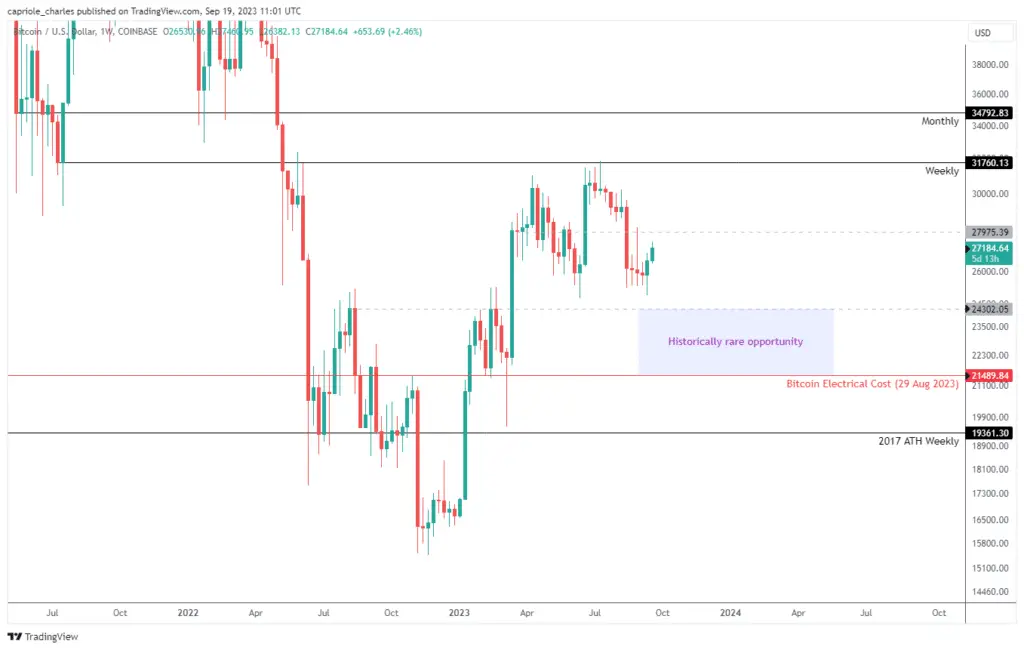
Bitcoin’s biggest weakness today are high timeframe technicals, which remain mid-range between weekly/monthly support and resistance. However, the last two weeks have continued to play to our Wyckoff schematic on the low timeframes, with a failed breakdown at $26K that we would consider locally bullish. Importantly, we also finally have improvement in on-chain fundamentals.
On top of that, the SEC has just suffered its third major legal hit in the last months as the courts dismissed its request to inspect Binance US, just days after Bitcoin again bottomed on exaggerated Twitter Binance FUD at $25K.
We are finally starting to see the early signs of bullish confluence across most Bitcoin metrics.
Technicals

Low Timeframe Technicals: we shared this chart in Update 4, and so far the spring zone is playing out exactly as you might expect. The failed breakdown below $26K giving the structure further weight. Looking for a break from support (a close above $28K) to confirm the continuation to at least $31K, at which point we will look for the Phase D consolidation at resistance to complete the Wyckoff structure and signal the next major move up. Interactive Chart here.

High Timeframe Technicals: Not much has changed, with price trading in no man’s land between major support/resistance levels. As such, we pay closer attention to the LTF technicals above. The ultimate confirmation (or failure) of the LTF Wyckoff structure will likely determine the major trend. As long as the $26K Wyckoff support holds, we lean towards a test of $31K (at the least) in the near-term. Interactive Chart here.
Fundamentals
Price is only half the picture. What about on-chain flows? What are retail and institutional investors doing with their capital? Is the mining network and security growing? How can we incorporate macroeconomic changes, equity market risk and broader market sentiment into Bitcoin? Finally, how do all these metrics compare on a relative basis to prior Bitcoin cycles?
We believe the full picture of fundamentals is best summarized by Capriole’s Bitcoin Macro Index.
Over 40 of the most powerful Bitcoin on-chain, macro market and equities metrics combined into a single machine learning model. This is a pure fundamentals-only value investing approach to Bitcoin. Price isn’t an input.
For the first time in two months we are seeing progress in Bitcoin’s fundamentals. The two month decline which precipitated the price decline from $29K has stopped. Suggesting we may well be at an important turning point. For sustainable price appreciation, Bitcoin’s fundamentals need to be improving, and we are seeing grass roots movement for a potential local bottom now.
Bitcoin Macro Index: The fundamental downtrend has stopped, we have signs of a potential local bottom in fundamental data which is very positive.
Chart Of The Week
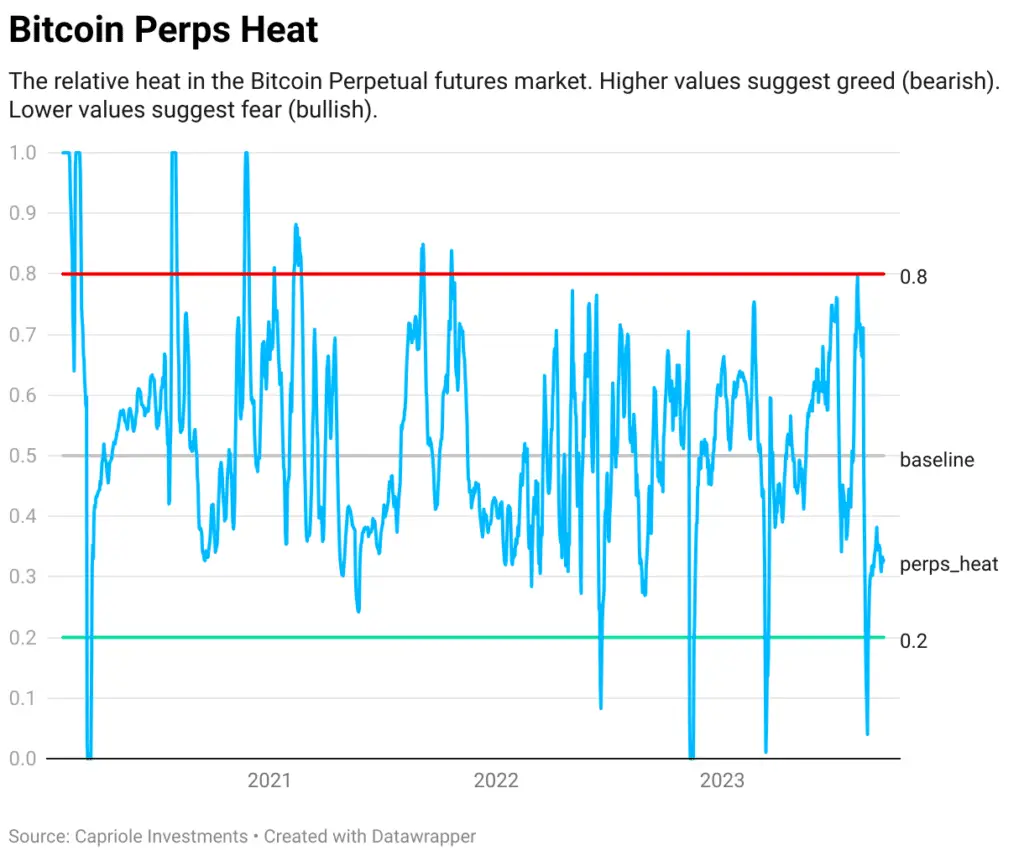
Introducing three new metrics, in the “Derivatives Heat” series; exclusive to Capriole.com, and you can track them live here: capriole.com/charts.
We have produced one metric for each of the major Derivatives markets:
- Perpetual Futures Heat
- 3-month Futures Heat
- Options Heat
In order of priority, these three metrics cover all of the most important derivatives markets in the crypto industry. These markets drive a lot of liquidity and price action.
Our proprietary calculation method for each of these metrics is slightly different, but all have been normalized between 0 and 1:
- A reading of 0: suggests extreme fear in how the market is pricing Bitcoin, which could potentially mark a local (or major) price bottom.
- A reading of 1: suggests extreme greed in the market, which could potentially mark a local (or major) price high or potential area for greater risk management.
In our opinion, these are high signal metrics, and the calculation logic used here is not available anywhere else.
We trade them all.

Bitcoin Perps Heat above is showing a historically measurable opportunity in $26-27K zone today. There have only been 5 times in the last 3 years that saw a similar opportunity in this metric.
Bottom-Line
We were hoping to snag a super rare opportunity in the $24K zone in our prior issue, but the data today is suggesting that is less likely to happen. While technicals have not changed significantly, we have since seen a failed breakdown (locally bullish) and solid improvement across fundamental data (more bullish). An improvement in fundamentals was one of our three criteria to consider long positions from Update 4, that criteria is now met.
Pending significant changes in this data, my expectation is continuation to at least $31K. My view will quickly change if $26K support fails, or Macro Index fundamentals deteriorate.

Charles Edwards
Founder
Capriole Investments Limited


