Welcome to Capriole’s Update #45. Where we consolidate the most important Bitcoin news, technicals and fundamentals into a 3-minute update.
Market Summary
Welcome to ETF Mania.
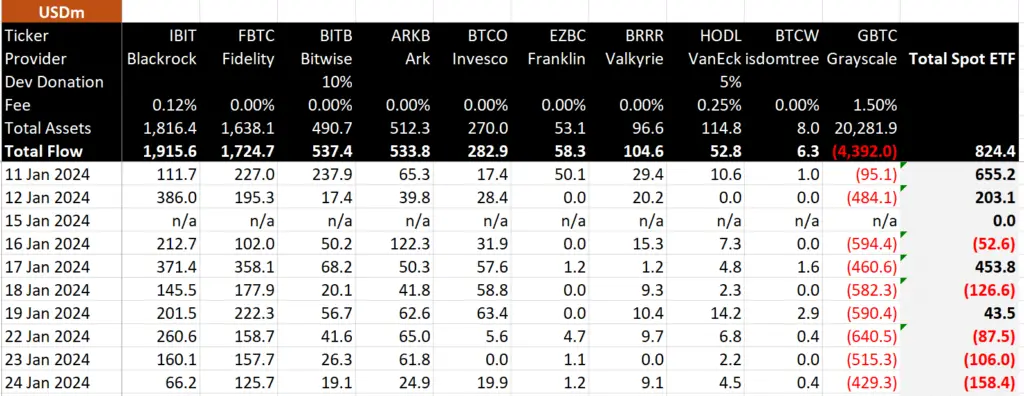
We now know with hindsight the ETF launch was a near-term sell the news event. A portion of this can be attributed to the Grayscale outflows of over $4B, approximately half of which was forced selling by the FTX bankruptcy estate and another couple billion likely to cover Grayscale’s debt obligations. I expect the current rate of outflow will drop to a more sustainable trickle over the next few weeks (after another few billion out). A menial outflow will then continue until Grayscale decides to drop their fees by 80% to match the market rates of the other nine ETFs. It’s important to note that the ETF launches also ended Grayscale’s multi-year lock-up period. So there are also quite a few investors that waited years for the opportunity to finally close their GBTC position at market prices today.
The more interesting figures to watch from here are the Blackrock and Fidelity ETFs which are now managing close to $2B each and are likely to take position as the defacto market leaders. The brand names of these two behemoths in the traditional asset management space means every billion they bring in, adds an order of magnitude more credibility (and therefore flows) into Bitcoin and crypto as a whole.

The Bitcoin ETF launch was the biggest in history. Today we continue to see large outflows driven by the Grayscale’s troubled counterparties which are expected to slow to a trickle over the coming weeks. Source: BitMEX Research
Technicals

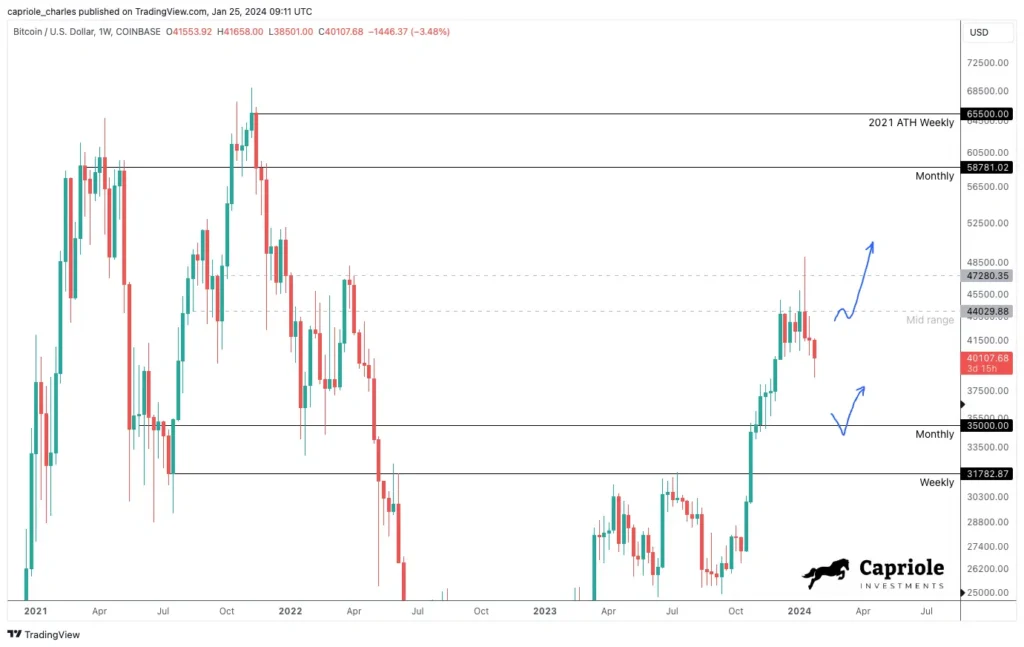
High Timeframe Technicals (HTF): The last two weeks saw a strong rejection on the ETF launch at mid-range resistance. The nearest HTF support at $35K would likely represent a great opportunity to get long for the 2024 Halving year (if we are lucky enough to get there). Alternatively, a strong close above $44K will likely see the trend continue to range highs ($60K). At this juncture, from a purely technical perspective, it makes sense to wait for one of these two triggers, the first being price-value orientated and the second a breakout trade opportunity.

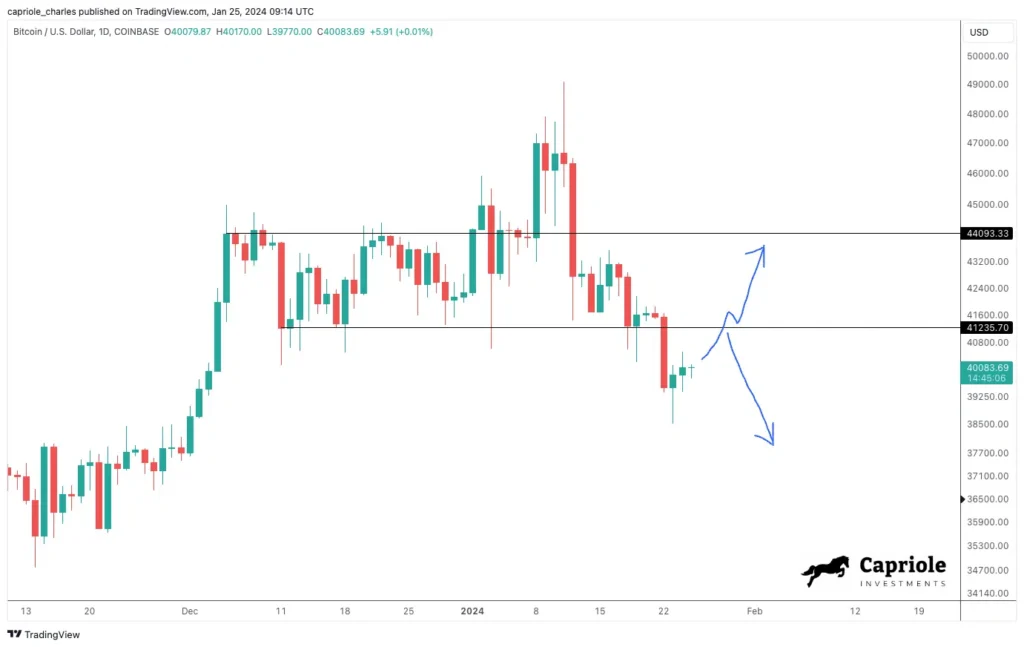
Low Timeframe Technicals (LTF): The lower timeframe (daily chart) offers more opportunities in the near-term for active traders. The December/January consolidation saw a $44K “fakeout” on the ETF launch (a breakout to $49K which quickly failed to the downside). Fakeouts often resolve in price movements to the other side of the range, as we saw. Therefore, the most interesting price point locally is $41K. A daily close above $41K would likely represent a downtrend fakeout and a swift return to range high at $44K (+). If we simply wick into $41K and start trending back down, that would be a great risk-off trigger for a potential move lower toward $35K HTF support.
Fundamentals
Fundamentals and on-chain data help us understand which way the probabilities are skewed at important inflections, and were critical to our navigation of this cycle and identification of the bottom at $16K.
We believe the full picture of fundamentals is best summarized by Capriole’s Bitcoin Macro Index, which we publish live with weekly updates here. This Index includes over 50 of the most powerful Bitcoin on-chain, macro market and equities metrics combined into a single machine learning model. This is a pure fundamentals-only value investing approach to Bitcoin. Price isn’t an input.
As we noted in our last update (when Bitcoin was at $46K), Fundamentals entered a period of slowdown which marked the near top at the ETF launch. That fundamental slowdown continues today with price down -20% from the highs in January so far. Once again, showing the importance of fundamental analysis and on-chain valuation methodologies in navigating the Bitcoin market.
Chart of the Week
This week we introduce two new charts to Capriole.com/Charts, classic metrics which measure strength in the S&P500 equities market.
The Advance-Decline (AD) Line is a classic measure of health in the S&P500 index.
The AD line is calculated as the cumulative sum through time of each days count of advances less declines, where an advance is a positive returning stock in the S&P500, and a decline is a negatively returning stock.
When the AD Line is trending upwards strongly, it suggests that most of the equities market is doing the same, and therefore there is underlying strength in the rally. If the S&P500 index is rising, but the AD Line is chopping sideways, it suggests a less sustainable rally which is likely being driven by a few big names (think FANG stocks).

Multi-year accumulation zones followed by breakouts in the AD Line, tend to be followed by multi-year rallies in the S&P500 without any meaningful dips. This strength in risk markets has a strong correlation with Bitcoin’s best performing years also. Today we are seeing the first such breakout since 2016.
Why should a crypto investor care?
In December 2023, the AD Line broke out from a 2.5 year consolidation which began mid-2021 (roughly when Bitcoin topped). Suggesting the current S&P500 rally has considerable underlying strength. Other times this occured in the past include January 2013 and July 2016, and what followed were massive, long-lasting risk asset rallies across equities. During these periods in 2013 and 2016, Bitcoin was also in a drawdown from all-time-highs (like today) and began two of its largest cyclical rallies in history.
Very good news for 2024.
The Bottom Line
With fundamentals in a downtrend, large ETF outflows continuing and technicals in a no man’s land, Bitcoin at $39-40K is not a screaming buy today. That said, in a matter of days and (likely at most weeks), this picture will be very different. The opportunity of the year likely awaits in the $32-35K region, which if we are lucky enough to see, will probably be the last time we ever see it. Pending that, we await patiently for a momentum breakout of $41K (aggressive) and $44K (conservative) for resumption of the meat of the primary 2024 trend. Up.

Charles Edwards
Founder


2 Responses
Great article as always, Charles! Is there any way to zoom in on your charts such as the macro index oscillator to see more details?
Hi Des, thank you. At present it’s just scroll over capability. Will consider a more enhanced charting solution in future.