Welcome to Capriole’s Update #44. Where we consolidate the most important Bitcoin news, technicals and fundamentals into a 3-minute update.
Market Summary
Today 11 Bitcoin ETFs launched and trading closed with over $4.3B in volume on day one. This puts the Bitcoin ETF launch as the most successful ETF launch in history, by a couple billion-dollars. An impressive feat. Especially when you consider that many major banks did not support the launch and disallowed trading today; including: Morgan Stanley, Vanguard, Citi, Merrill, Edward Jones and UBS. No doubt, exponential adoption will force their hand eventually, just as it did the SEC.
The significance of the Bitcoin ETF launch cannot be understated. The SEC seal of approval and the ease of access to Bitcoin via an exchange traded product is a major industry turning point. Some of the biggest businesses in the world including Blackrock and JP Morgan and their armies of broker-dealers are now highly incentivised to market Bitcoin and take crypto from a niche asset class to the mainstream financial industry. The Gold ETF launch in 2004 was followed by a 350% rally. Coming from a much smaller market capitalization base and given the success so far; Bitcoin’s will likely be greater.
For the above reasons, Bitcoin ETFs are demand expanding. But they also constrain supply. As the SEC only authorized cash subscriptions into the ETFs (not in-kind), the net effect will be taking billions of dollars of Bitcoin supply off the market over the coming months and years, as any ETF investment will result in a like-for-like purchase of spot Bitcoin.
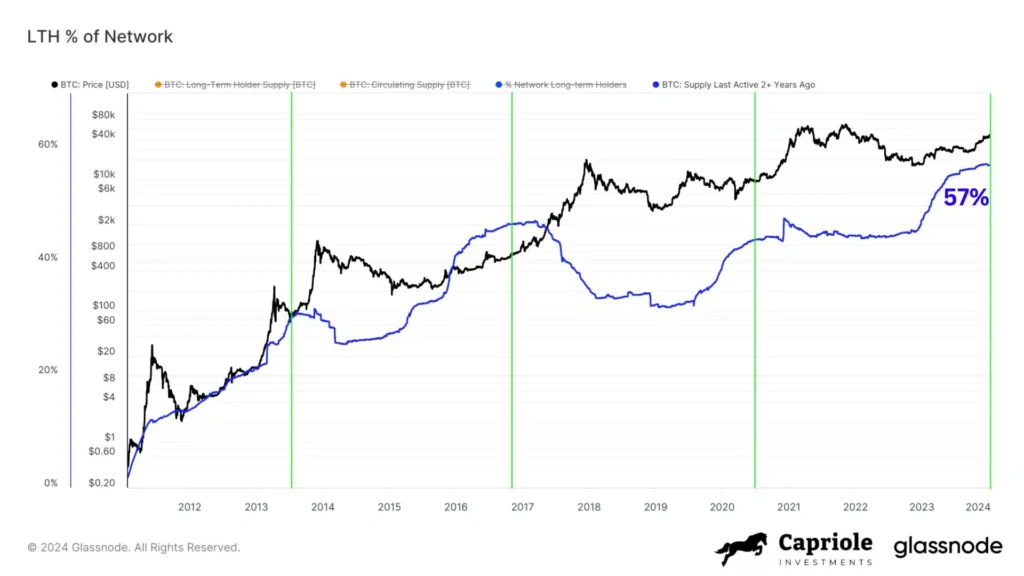
All of this is occuring in an already deeply supply constrained market. Bitcoin currently has an all-time-high percentage of circulating supply locked up in wallets that haven’t touched their assets in 2+ years. This is a powerful recipe for long-term price appreciation.
In the nearer-term, direction will be heavily guided by millions of eyeballs over-analyzing the ETF numbers.
Technicals

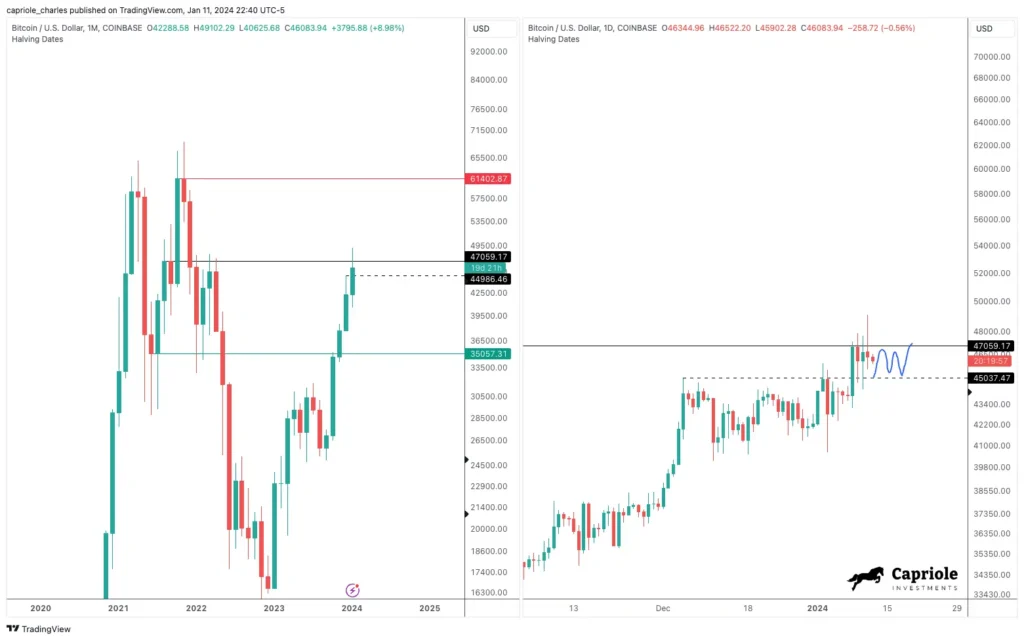
High + Low timeframe Technicals. We kept the technicals very minimalistic this issue, as the weight of the ETF flows will be the primary driver of price in the coming week. The LHS of the above chart identifies primary Monthly Resistance (red) and Support (green). We are a long way from both. Zooming in on the RHS we can see a consolidation pattern forming below the last (minor) resistance level before all-time-highs at $47K. $47K resistance is part of the mid-range cluster from $44K. It is not a major resistance level, and some time spent in the consolidation zone shown ($45-47K) would typically have a higher probability of a bullish breakout from here. Nonetheless, it will likely be news headlines on the 11 Bitcoin ETFs that determine direction of the break out from this consolidation. Today’s launch was strong, with over $4B volume traded; but the net AuM in the ETFs is to be determined, and could vary significantly over the coming days.
In short: the chart looks strong, but ETF numbers will be the deciding factor on the next 1-2 weeks trend from here.
Something to bear in mind is that when good news stops moving the market in the expected direction (up) it can be a major red flag. The same goes when bad news doesn’t push price down further (eg. December 2022). So if the ETF launch is the success we think it was, we should expect price to continue to advance from here, if it doesn’t soon that would be a bearish signal.
Fundamentals
Fundamentals and on-chain data help us understand which way the probabilities are skewed at important inflections, and were critical to our navigation of this cycle and identification of the bottom at $16K.
We believe the full picture of fundamentals is best summarized by Capriole’s Bitcoin Macro Index, which we publish live with weekly updates here. This Index includes over 50 of the most powerful Bitcoin on-chain, macro market and equities metrics combined into a single machine learning model. This is a pure fundamentals-only value investing approach to Bitcoin. Price isn’t an input.
Over the last week, Bitcoin fundamentals entered a period of slowdown (minor contraction). Generally this is not a great sign and tempers some of our strategy positioning. Interestingly, Ethereum is experiencing the opposite – strong growth. Plateaus in fundamentals can go either way. This could be a temporary period of consolidation, or it could be a more significant turning point. I tend to believe in the former (though my opinion will change if we are still trading below $47K in a few days time).
The market reduced exposure and was less aggressive over the last 7 days as we awaited the big confirmatory news from the SEC. ETFs were likely already seeded and that may have resulted in a pause in on-chain growth that we are currently seeing. As per the technicals, the ETF data over the coming weeks will likely strongly impact the fundamentals, as strong ETF buying will see more coins taken off market.
In short: we will have to wait and see. Sometimes time is just required to determine direction.
Chart of the Week
57% of all Bitcoin is locked up with investors that haven’t touched it in 2+ years. This creates a massive supply squeeze for Bitcoin and peaks in this chart have preceded all major Bitcoin bull-runs. This will be a fascinating chart to follow over the coming 12 months. Normally at this point in the cycle we would expect it to trend down as price goes up. This may happen, but given the ETF supply dynamic noted above it would be equally likely for this trend to establish a higher baseline. I expect this line will be quite a bit higher in a few years.

Bottom Line
This week was one of, if not the, biggest weeks in Bitcoin history. It’s a step change in Bitcoin and crypto adoption and from the data we have for the day one launch, it was a great success. Long-winded uncertainty in the air from the SEC has finally been cleared and the floodgates have opened for institutional adoption at a level this asset class has never before seen. At the very least, this event can be considered as a second “Halving” for Bitcoin in 2024, a long-term bullish catalyst.
Locally, the market is treading cautiously, still trying to weigh up if this is a ‘sell the news’ event, or if the level of ETF demand has not yet been priced in. Technicals look decent, but we need to clear this mid-range cluster to show strength out of such a big event like this. Without which, the current plateau in on-chain fundamentals could devolve into a bearish trend.
Generally speaking, I would like to see strength above $47K sooner rather than later after an event of this magnitude. If we are still at the same price point (or lower) a week from now, it is very likely that the early ETF results were not as sharp as the market was hoping, and we could see a typical and healthy 20-30% correction that has evaded the market for so long.
That said, any daily close above $48K and its likely game on to $60K+.
Happy new year!

Charles Edwards
Founder


