Welcome to Capriole’s micro update. Where we consolidate the most important Bitcoin news, technicals and fundamentals into a 3-minute update. Two technical charts, two fundamental charts and our chart of the week.
Market Summary
Since our last update, Bitcoin dived from $29K to $26K. The technical breakdown we documented in Update#2 has seen volatility kick in and the bearish scenario expected by our technical and fundamental readings played out. The collapse saw a sizable leverage flush out as Bitcoin futures open interest collapsed and funding rates went into negative territory. A healthy cleanse.
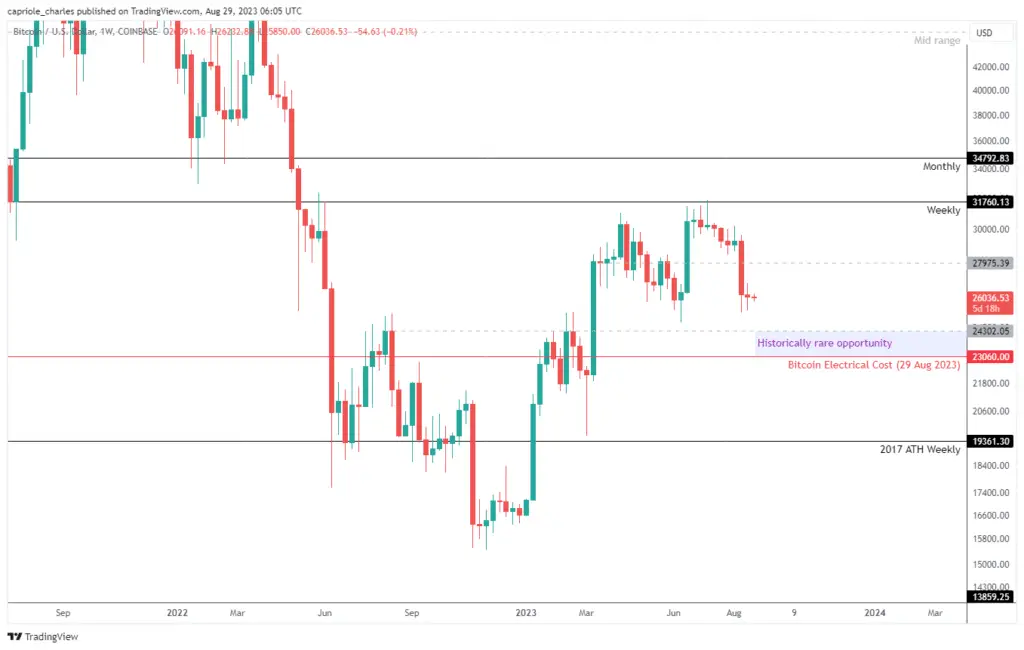
Today, while technicals and fundamentals both remain in a bearish trend, the relative risk-reward for long-term trades is increasing with technical weekly support at $24K and Bitcoin’s Electrical Price at $23K. We discussed Bitcoin’s Electrical price last update, it’s a historically hard price floor and level with a 100% long hit rate. You can monitor the chart live here. Together these price points give very strong confluence from a fundamental and technical perspective to the opportunity that $23-24K presents, should we get there.
Technicals

High Timeframe Technicals: The trend remains bearish but we are approaching weekly support ($24.3K) and the historical price floor of Bitcoin’s Electrical Cost at $23.1K Interactive Chart here.

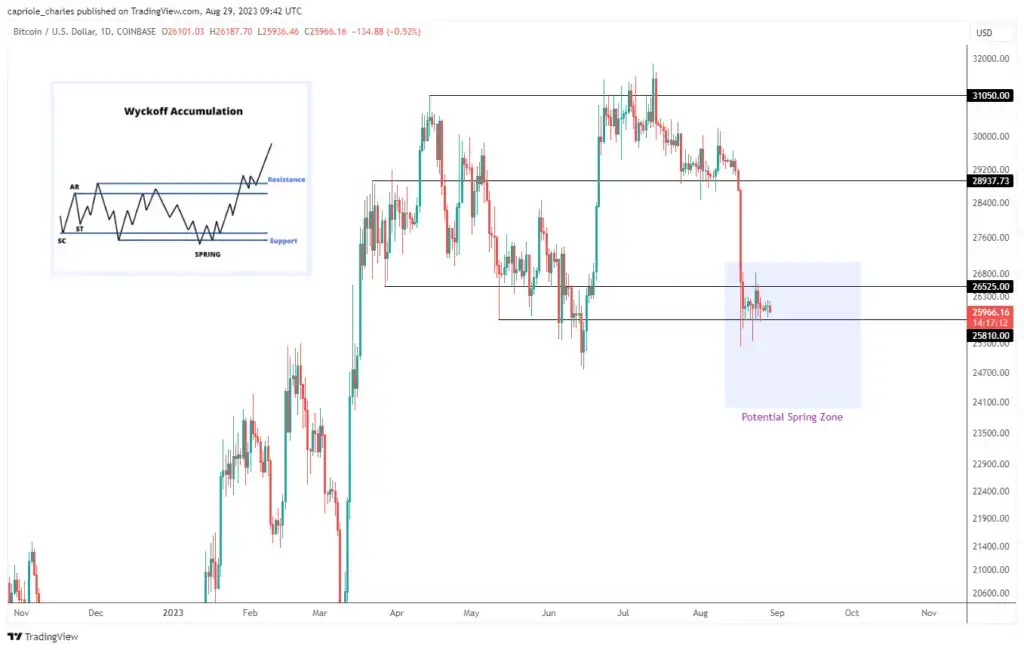
Low Timeframe Technicals: The drop has started to form a potential Wyckoff Reaccumulation (TBC) on the Daily timeframe. Price between $23-26K would represent the spring. Price closing back above $29K and ultimately above resistance gives progressively greater confidence to this structure completing. Wyckoff Accumulations typically result in expansion trends of similar magnitude to the prior move, so we would be looking at a breakout taking us into the $40Ks (a circa $10K move). Interactive Chart here.
Fundamentals
Price is only half the picture. What about on-chain flows? What are retail and institutional investors doing with their capital? Is the mining network and security growing? How can we incorporate macroeconomic changes, equity market risk and broader market sentiment into Bitcoin? Finally, how do all these metrics compare on a relative basis to prior Bitcoin cycles?
We believe the full picture of fundamentals is best summarized by Capriole’s Bitcoin Macro Index.
Over 40 of the most powerful Bitcoin on-chain, macro market and equities metrics combined into a single machine learning model. This is a pure fundamentals-only value investing approach to Bitcoin. Price isn’t an input.
Unfortunately today, the trend in fundamentals is still strongly to the downside, as it has been for the last month. This is the primary bearish factor today in what is otherwise cyclically a great long-term opportunity at what also appears to be a technically good zone. Sometimes the fundamentals can be quite late in turning around though, as this data by its nature responds slower to fast changes. Something to bear in mind.
Bitcoin Macro Index: The Macro Index today remains in a contractive downtrend but has re-entered a substantial value zone for this stage of the Bitcoin cycle.
Chart of the Week
Introducing the crypto Speculation Index.
This chart tracks the percentage of altcoins which have outperformed Bitcoin over the last 90 days. It gives us a good indication where we are in the hype cycle.
If speculation is high (60-80% of altcoins are outperforming Bitcoin) it probably pays to be conservative.
On the other hand, lower readings of speculation (sub 15%), suggest the market has seen broad capitulation and there has also historically has been an increased likelihood of altcoins outperforming in the near-term.
The speculation index today is at a low 11%. You can track it live here: capriole.com/charts.
The Speculation Index shows we are in the value stage of the cycle.
Bottom-line
Last update we reiterated the importance of awaiting technical confirmation. That didn’t come and the bearish price breakdown expanded. This is why it’s so important to define your triggers and risk management and only act accordingly. This update, there is a more robust technical argument to start building a long position for the long-term investors. The opportunity at Electrical Cost ($23K) is historically extraordinary, so the opportunity at $26K is probably also very good. Nonetheless, I would sit more comfortable entering measurable long positions with one of the following occurring first:
- Price above $29K (Wyckoff resistance), or
- Price below $24K (Electrical Value and technical support), or
- Fundamentals trending back up

Charles Edwards
Founder
Capriole Investments Limited


