Welcome to Capriole’s Update #46. Where we consolidate the most important Bitcoin news, technicals and fundamentals into a 3-minute update.
Market Summary
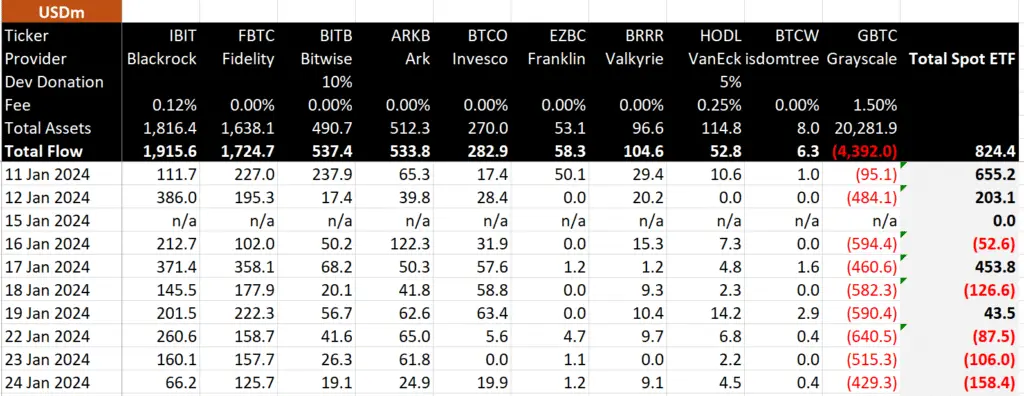
Two months of chop and ETF readings under the microscope appears to be resolving to the upside as of writing. The initial ETF launch “sell the news” momentum came to a halt this week, as Grayscale Bitcoin ETF outflows fell significantly, as we suspected may start to occur in Update 12. At the same time we have seen Blackrock and Fidelity’s Bitcoin ETFs (IBIT and FBTC) devour over $6B in assets in under a month, making Bitcoin the most successful ETF launch in history by a very wide margin.

Bitcoin is the most successful ETF launch in history, taking the top ranks of the leading 25 ETFs by assets after 1 month on the market (out of 5,535 total launches in 30 years). Source: Eric Balchunas
Now that we have confirmed the Bitcoin ETF launch was a huge success, it’s become next to impossible for any major bank or asset management firm to ignore the writing on the wall.
This week, Fidelity incorporated Bitcoin as a standard holding in their “All-in-One Conservative ETF”, which is designed to offer a balanced investment approach with a mix of approximately 40% equities, 59% fixed-income ETFs and now with an added 1% in cryptocurrencies. This is a huge milestone. Bitcoin is finally being acknowledged in traditional investment vehicles for the massive portfolio diversification benefits and outsized risk-adjusted rewards it adds. It is very likely that most major ETFs will add a 1-5% allocation to Bitcoin in the next 12-24 months, or avoid being left behind.
All this is to say, significant demand is coming, and all into a the biggest Bitcoin Halving ever.
Technicals

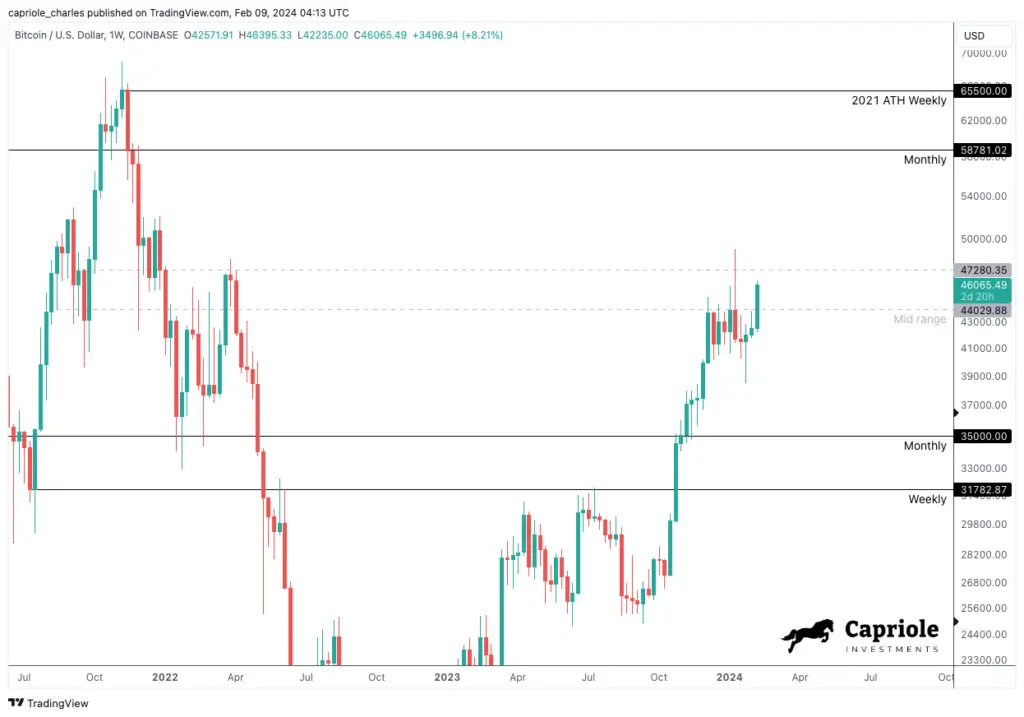
High timeframe technicals: Of the two high- and low-timeframe scenarios discussed last issue, the bullish one prevailed. With $44K cleared on both high- and low-timeframes, there is good probability this move will continue toward major resistance. The Weekly closing above $47K mid-range bound on Sunday would give a great technical confirmation of a new bullish trend.

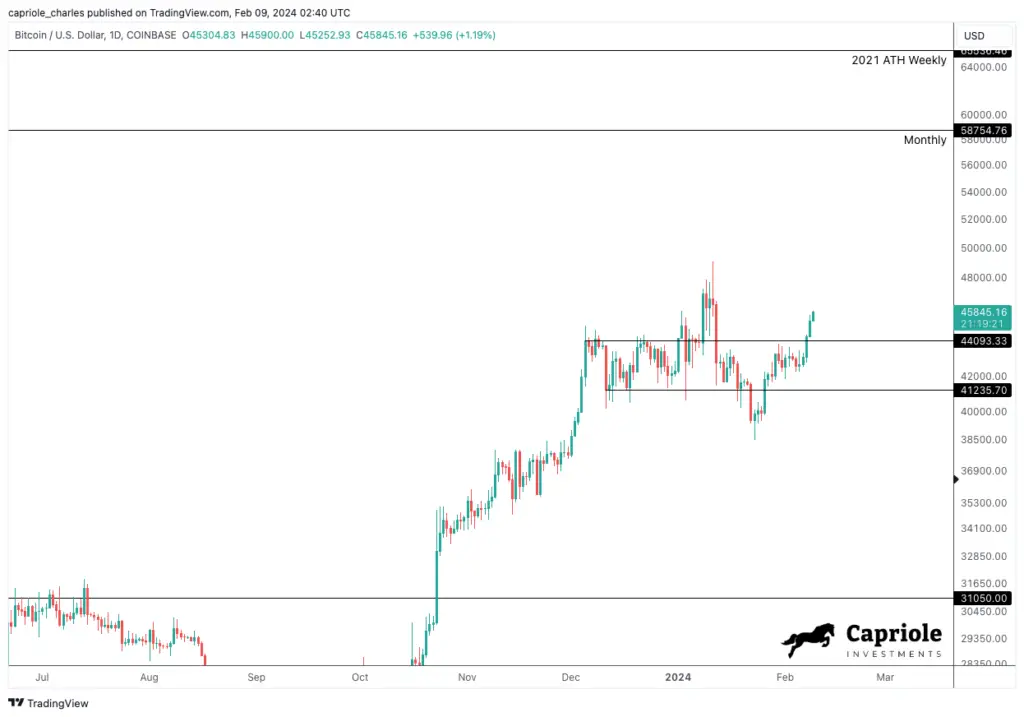
Low timeframe technicals: A clean breakout on the daily timeframe of the $44K resistance, suggestive of a measured move to Monthly resistance. This is a good R:R setup. “Risk” can be easily managed (a close back into the range at $44K would be a logic stop) with “Reward” 3-4X higher at $58-65K.
Fundamentals
Fundamentals and on-chain data help us understand which way the probabilities are skewed at important inflections, and were critical to our navigation of this cycle and identification of the bottom at $16K.
We believe the full picture of fundamentals is best summarized by Capriole’s Bitcoin Macro Index, which we publish live with weekly updates here. This Index includes over 50 of the most powerful Bitcoin on-chain, macro market and equities metrics combined into a single machine learning model. This is a pure fundamentals-only value investing approach to Bitcoin. Price isn’t an input.
The fundamental uptrend resumed on Wednesday which is also supportive of continuation of the technical move. We want to see on-chain fundamental growth continue with price to support confirmation of this mid-range breakout. Monday’s reading will be particularly important.
Chart of the Week
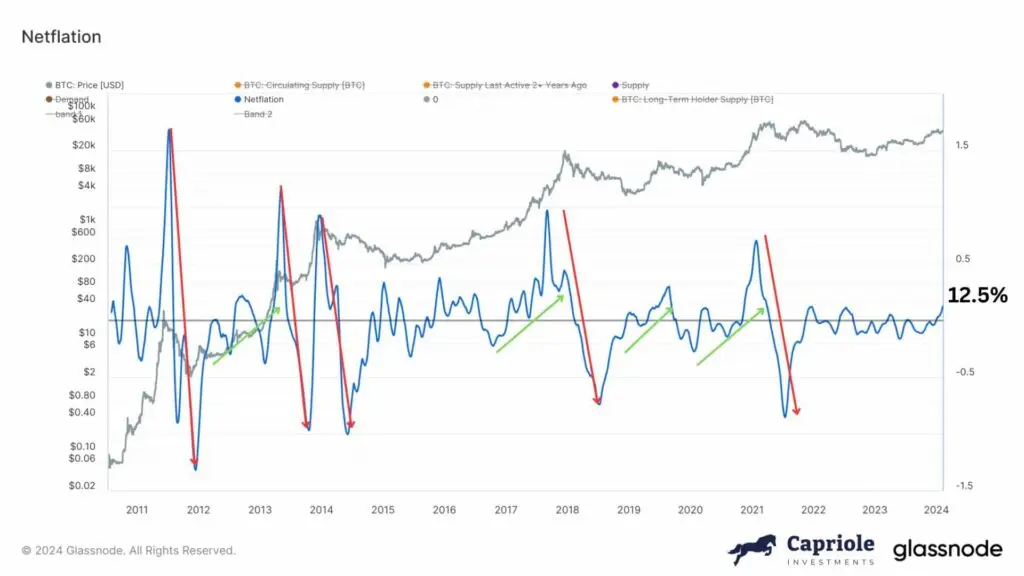
Introducing a new Bitcoin metric, “Netflation“. This captures a holistic measure for Bitcoin’s current inflation rate, netting off both market supply and demand dynamics.
Netflation = [monthly percent_change(Bitcoin’s Circulating Supply) – monthly percent_change(Long-term holder Supply)] * 12
We net off supply inflation (the growth in Bitcoin’s circulating supply from mining), with demand inflation (the reduction in Bitcoin’s marketable supply from long-term holder acquisition). This gives us a gauge for Bitcoin’s market inflation rate, something which is more likely to impact price dynamics than considering the supply growth rate of circulating supply only. Long-term holders are wallets that have been identified on-chain as likely to hold their Bitcoin for the long-term (as defined on Glassnode here).
As you can see below some interesting dynamics emerge from this metric.
Netflation peaks near cycle tops (when long-term holders tend to sell into profit). This climax in selling sees Netflation collapse in a sharp sudden fashion that typically marks the start of the bear market. At 12.5% today, we are starting to see Netflation trend up as would be expected in the early stages of a Bull market.

The Bottom Line
ETF FUD cleared. A Technical breakout on the daily timeframe and onchain fundamentals transitioning into growth. A strong start to February.

Charles Edwards


2 Responses
Please share the netflation workbench link. Really appreciate your work and ideas
Sure here it is: https://studio.glassnode.com/workbench/50f1105c-fa58-43be-6185-48d9910d1051?s=1307223845&u=1709596800&zoom=