3fm

The Three Factor Model

90% of the S&P500 returns over the last half century can be explained by a simple three factor macroeconomic model. GDP, money supply and interest rates. These three metrics alone explain almost all the performance of the stock market.

In this short article, we present a simple 3 factor model to determine the fair value of the S&P500.

The Three Factor Model

What drives equities markets fair value and price inflation?

When you boil it down, it’s very few factors.

  1. How much money the government printing. If it’s a lot, money loses value and therefore the price of goods, services and the stock market goes up.
  2. How much innovation is occurring. We need to consider an innovation factor to help explain technology improvement, population growth and a general increasing output in human productivity. For this we chose GDP.
  3. How costly is capital. Finally, the baseline cost of capital is very important. When interest rates are high, it’s expensive to borrow and less enticing for people and businesses to invest in future output expansion. Treasury rates are one of the primary de facto inputs in investment banking models for determining the ‘cost of capital’ and determining the net present value of equities. The 2Y treasury is a great yard-stick for short to mid-term capital costs.

The Three Factor model presented here is very simple. We calculate the daily effective rates of return of each of these three metrics and add them all together as follows.

3FM = Daily effective rate of return of: GDP plus M2 Money Supply less 2Y Treasury Rates.

When you compound those daily 3FM returns through time from 1965 you get the following chart.

Voilà
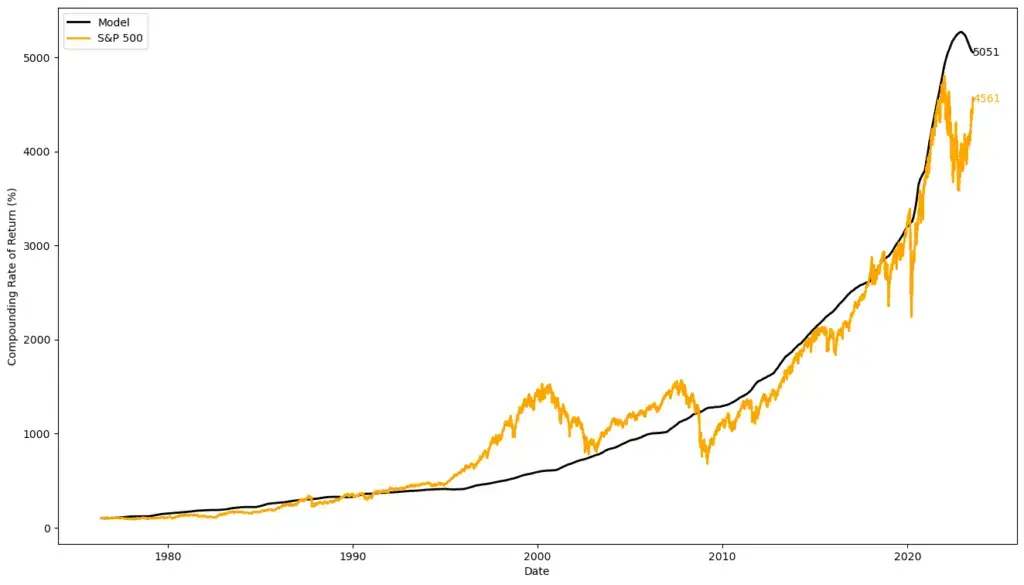
Modelling the S&P500 with Three Macro Factors. Visually we can see a great 50+ year fit.

Fitting

Our data source is the Federal Reserve Bank of St. Louis (FRED). Most of these data sources start in 1965.

The R2 ratio of our Model to the S&P500 is 0.905, suggesting about 90% of the S&P500 cumulative returns over the last 60 years can be explained by this model.

Zooming in, we can see the fit holds well over the most recent decade of extraordinary events.
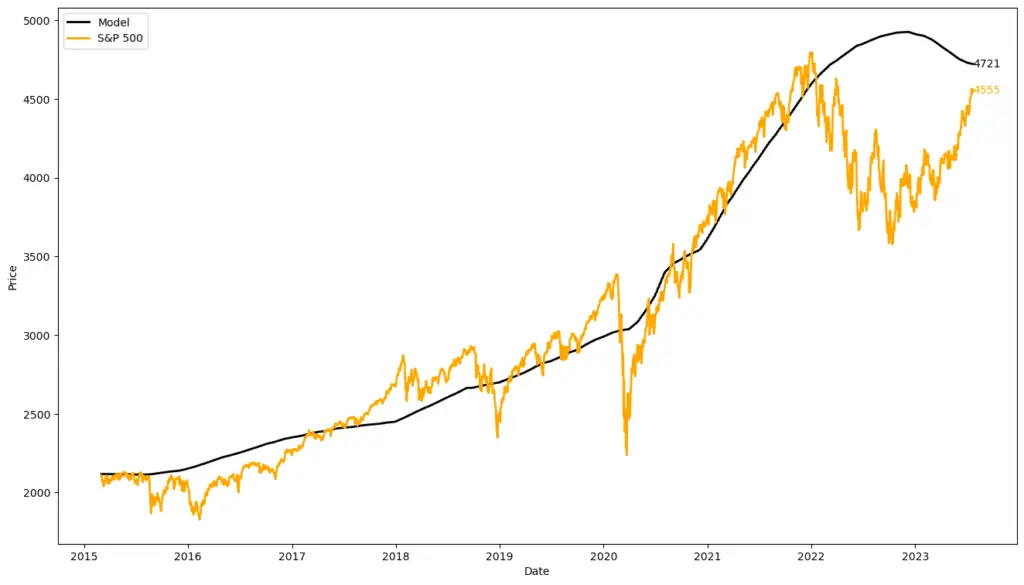
A strong fit persists in the last decade. In this chart we have normalized both lines to the S&P500 price.

Use Cases

This is an ultra high timeframe model. Some of the data inputs like GDP are only updated quarterly and with a lag, so we need to be careful how we use it. Nonetheless we can use this model as a broad market barometer to very logically explain where market value lies on a relative basis. In the shorter term, there are many other factors that play into market value that we don’t consider here; including more granular data points, expected future market conditions and more.

Relative Value

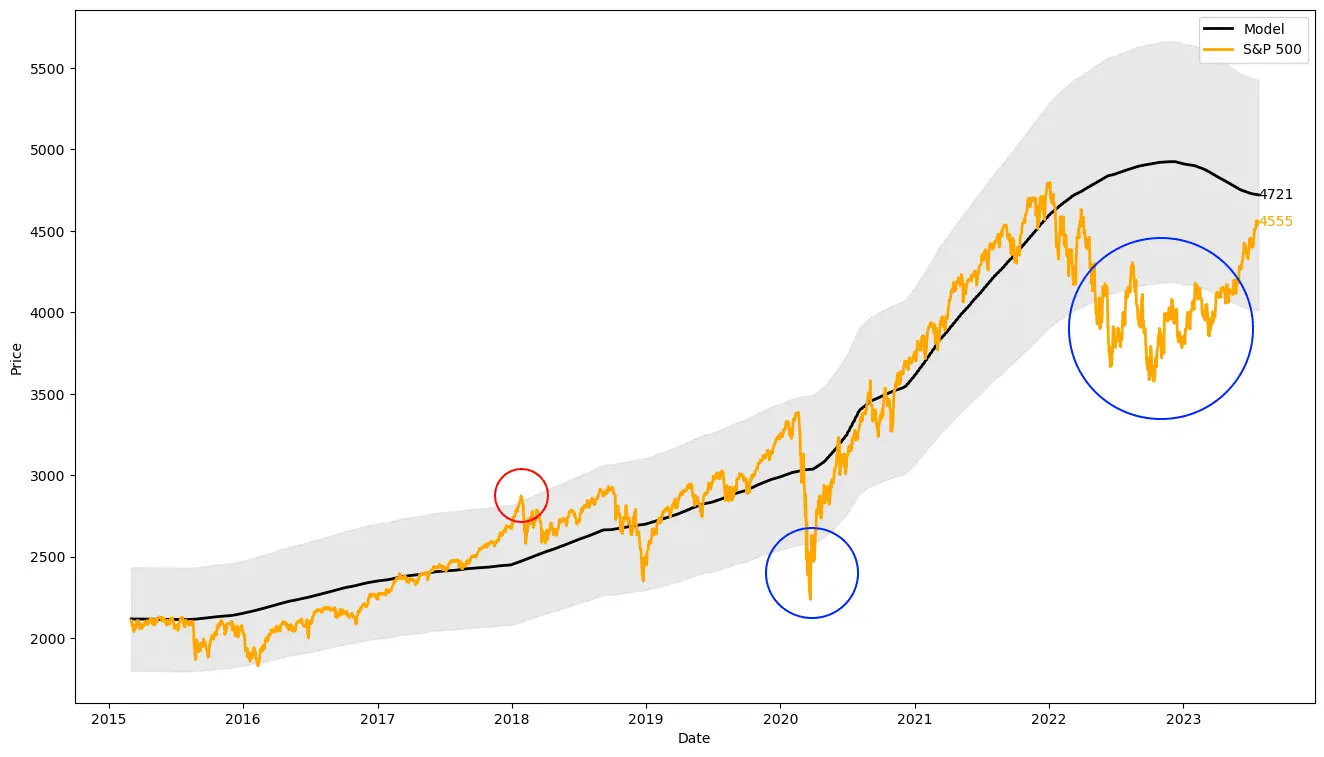
If we are to use the 3FM model for valuation, a generous tolerance band of 15% either side makes sense. Using this, relative periods of market fear and greed become much more pronounced and we can see market returns below and above the fair value band. In the below chart we have normalized to S&P500 prices for easier interpretability.
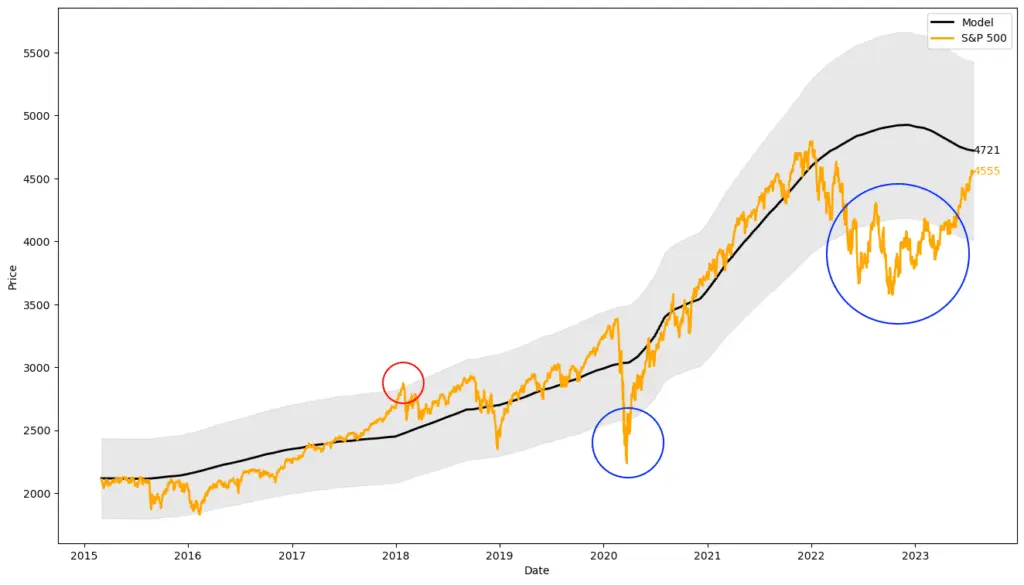
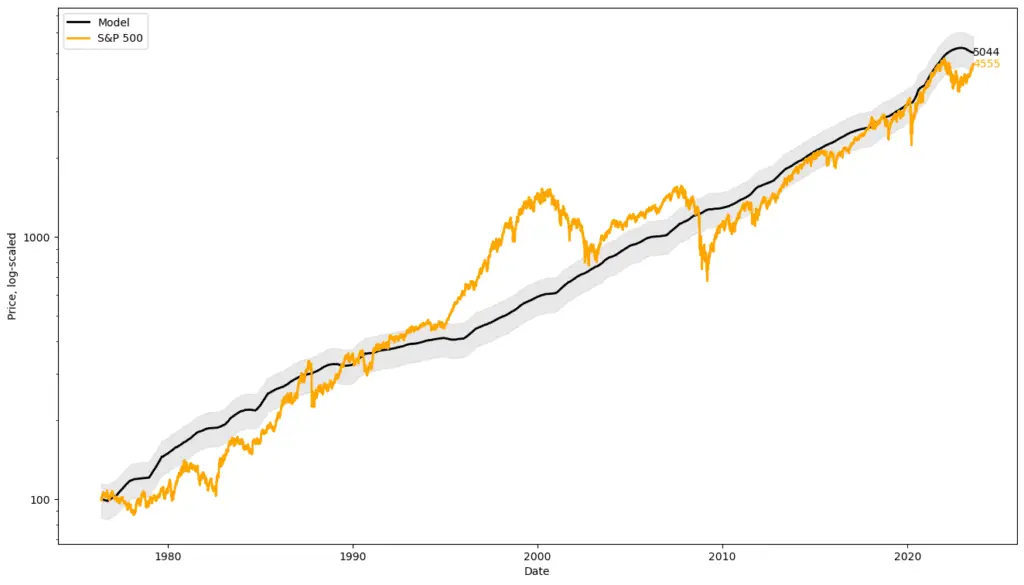
Recent relative value and risk opportunities circled when the S&P500 moves outside of the fair value bands. Source: Capriole Investments
Over the long-term, you would have done well buying during the periods of market panic when price dropped below model fair value bands. Source: Capriole Investments

Note the mid-1990s exceptional ramp up in price to value. This period can be somewhat explained by the 400% increase in real earnings growth rates from 1995 onward, as we discussed here. With this we also saw the additional speculative mania from the tech bubble into 2000, and then the housing bubble in 2008.

Live Market Interpretation

When we understand that the market is driven primarily by these three factors, it also gives us the capability to act with conviction on the day-to-day level when we witness measurable macro changes; such as the Fed’s change of regime from zero rates to tightening, the massive stimulus packages (QE) of 2020 and when we see potential leading indicators of bottom-line under- or over-performance from the tech giants (FANG+) earnings. We are able to more easily interpret how these big events will impact each element of GDP, Money supply and rates, and correspondingly estimate how markets will react in the coming 6-12 months and position accordingly.

Conclusion

Three simple metrics; GDP, money supply and interest rates can be used to build a robust long-term valuation model of the S&P500 market. Simple is good. In this case, three factors alone explain 90% of the last half centuries market prices.

Today, the 3FM model tells us markets are fairly valued, despite the 20% rally that occurred this year.

Interestingly, we have never seen a decline in the model’s fair value in the last 60 years to the degree that we are seeing today. Though the 3FM model is starting to flatten out today, we are in uncharted waters from what is now the most aggressive Federal Reserve monitory tightening regime in history.

The Capriole Fund

The Capriole Fund has one goal: outperform Bitcoin.

We are open to professional investors, but the fund has limited spaces.

Share the Post:

2 Responses

Leave a Reply

Your email address will not be published. Required fields are marked *

Disclaimer

The information contained here is provided to you solely for informational purposes only. Opinions and projections included are provided as of the date of publication, may prove to be inaccurate, and are subject to change without notice. This information does not constitute an offering. Prospective investors should not treat these materials as advice regarding legal, tax, or investment matters. No recommendations are made to invest in Capriole Investments Limited nor any other investment. An offering may be made only by delivery of a confidential offering memorandum to appropriate investors. Past performance is no guarantee of future results. Investing in digital assets in general involves risk. Digital asset risks include, but are not limited to, exchange risk, legal risk, hacking risk, market risk, liquidity risk, trading risk and default risk. As with any investment, investing in digital assets could result in loss of investment. Additional digital asset risks are outlined at www.capriole.com/legal. Decisions or actions based on the information provided are at the reader’s own account and risk.

Related Posts

Update #54

Don't trust on-chain data. A lot of metrics have been manipulated in...

Charles Edwards

Update #53

Bitcoin is under pressure. But the most comparable asset to Bitcoin, at...

Charles Edwards

Update #52

Is the cycle top in? This issue, we will revisit the Bitcoin...

Charles Edwards

Update #51

Hash Ribbons is back. Perhaps the best long-term Bitcoin buy signal there...

Charles Edwards

Update #50

Is Bitcoin's longest winning streak finally coming to an end?...

Charles Edwards

Update #49

A dive on the forth Bitcoin Halving, Runes, Onchain valuations and macroeconomic...

Charles Edwards

Update #48

Welcome to Bitcoin price discovery, it's been a long time coming. With...

Charles Edwards

Update #47

The era of deep value is over. Bitcoin is fairly valued for...

Charles Edwards

Update #46

With the big Fidelity news, Bitcoin is finally being acknowledged in traditional...

Charles Edwards

Update #45

The brand names of these two behemoths in the traditional asset space...

Charles Edwards

Update #44

Today's Bitcoin ETF launch was the most successful launch in history and...

Charles Edwards

Update #43

ETF fever is coming to a head with approvals expected within the...

Charles Edwards

Update #42

Two major and positive events just unfolded in the Bitcoin space. According...

Charles Edwards

Update #41

Bitcoin is heating up, in both opportunity and across derivatives markets. And...

Charles Edwards

Issue #40

A new major trend has formed. We now have the biggest asset...

Charles Edwards

Issue #39

We have historically rare risk-asset signals appearing, amidst a period of Bitcoin's...

Charles Edwards

Issue #38

The last week has seen the biggest improvements across Bitcoin technicals and...

Charles Edwards

Issue #37

Bitcoin is pricing as a better-and-better inflation hedge. It is rapidly skewing...

Charles Edwards

Issue #36

The Fed is Building a War Chest. A macroeconomic deep dive to...

Charles Edwards

Issue #35

We are seeing some promising and rare structures form on Bitcoin which...

Charles Edwards

Issue #34

All else equal, Bitcoin is like a beach ball submerged underwater. Nonetheless,...

Charles Edwards

Issue #33

Last update technicals and fundamentals told us to be cautious with Bitcoin....

Charles Edwards

The Three Factor Model

90% of the S&P500 returns over the last half century can be...

Charles Edwards

Issue #32

Welcome to Capriole’s micro update #1. Where we consolidate the most important...

Charles Edwards

Issue #31

At $29K, Bitcoin’s on-chain fundamentals are not too hot and not too...

Charles Edwards

Issue #30

The failures of the Federal Reserve in managing the value of money...

Charles Edwards

Issue #29

This newsletter explores a taboo topic. The idea of the impossible, a...

Charles Edwards

Issue #28

Bitcoin’s deep value is slipping away and in its place a new...

Charles Edwards

Issue #27

We believe the 2020s will be the decade of hard money, much...

Charles Edwards

Why markets are not as overvalued as you might think.

Charles Edwards

Issue #26

The crypto world was shaken to the core in November as top...

Charles Edwards

Bitcoin Miner Sell Pressure

Charles Edwards

The Bitcoin Yardstick

Charles Edwards

Issue #25

We crack open the rarest of Bitcoin value metric readings you can...

Charles Edwards

Everything you need to know about yield curves

Charles Edwards

Issue #24

This month we deep dive into the macro and make the case...

Charles Edwards

SLRV Ribbons

Charles Edwards

Issue #23

Fear struck the market again with a blunt Fed speech. The broader...

Charles Edwards

Issue #22

This issue we deep dive into the many Bitcoin and macro metrics...

Charles Edwards

Issue #21

Today, we now find ourselves in a special juncture in the crypto...

Charles Edwards

The Digital Asset Thesis

Charles Edwards

The Capriole Macro Index

Charles Edwards

Issue #20

The S&P500 and Bitcoin showcased a strong recovery recently and today both...

Charles Edwards

Issue #19

Traditional markets have been taking a beating. Our February Newsletter and analysis...

Charles Edwards

Issue #18

The first quarter of 2022 is coming to a close. War in...

Ryan McCoy

Issue #17

For the past few months, Bitcoin has been driven by macro events...

Yassine Zrigui

Issue #16

Last month was mostly dominated by macro news much like December, namely...

Mick Herfkens

Capriole’s 2022 Market Outlook

A year ago, we published our “Christmas Special” newsletter. We wrote the...

Charles Edwards

Issue #15

If you have been around the cryptospace long enough, you have probably...

Ryan McCoy

Issue #14

Bitcoin started the month of November strong with a new all time...

Mick Herfkens

Issue #13

Bitcoin is up over 30% to date in October, reaching as high...

Charles Edwards

A Simple Metric to Identify Bitcoin Tops

Charles Edwards

Issue #12

Last issue, at $47K we noted some concerning metrics, but noted the...

Charles Edwards

Issue #11

Last issue we noted the improving fundamentals for Bitcoin...

Charles Edwards

Issue #10

Last issue we reviewed the China’s crypto exodus and argued why we...

Charles Edwards

Issue #9

These are unprecedented times. The Bitcoin network has just experienced the biggest...

Charles Edwards

Issue #8

Bitcoin is trading at more than 40% below the all-time high for...

Jan Uytenhout

Issue #7

Every month we write a short update on the market. We try...

Charles Edwards

Issue #6

Every month we write a short update on the market. Last issue,...

Jan Uytenhout

Issue #5

Every month we write a short update on the market. We try...

Charles Edwards

Issue #4

Every month we write a short update on the market. We try...

Jan Uytenhout

Issue #3

Every month we write a short update on the market. We try...

Charles Edwards

Issue #2

We try to release our newsletters when we see key opportunities. Today...

Jan Uytenhout

What is Money?

Charles Edwards

Issue #1

This newsletter provides our airplane view of the Bitcoin market. It summarises...

Charles Edwards

The Energy Standard

Charles Edwards

Bitcoin Energy-Value Equivalence

Charles Edwards

Bitcoin’s Production Cost

Charles Edwards

Hash Ribbons & Bitcoin Bottoms

Charles Edwards

Metcalfe’s Law Says Bitcoin is Overvalued

Charles Edwards

Bitcoin Valuation using Dynamic Range NVT Signal

Charles Edwards

The Next Resession

Charles Edwards

Bitcoin Bottom Fishing with Miner Capitulation

Charles Edwards