

We are excited to announce that Capriole Charts is the first and only platform in the world that you can now track granular analytics on Bitcoin Treasury Companies. These publicly listed entities are hoovering up Bitcoin in 2025. We view these companies as the most important driver of the 2025 Bitcoin cycle and we suspect these analytics are most important data to monitor for direction and risk management purposes over the next 2+ years.
Let’s step through the first nine charts of Capriole’s Tranche 1 release. The last charts in particular are wild.
Thanks for reading! Subscribe for free to receive new posts and support my work.
Alpha inside.
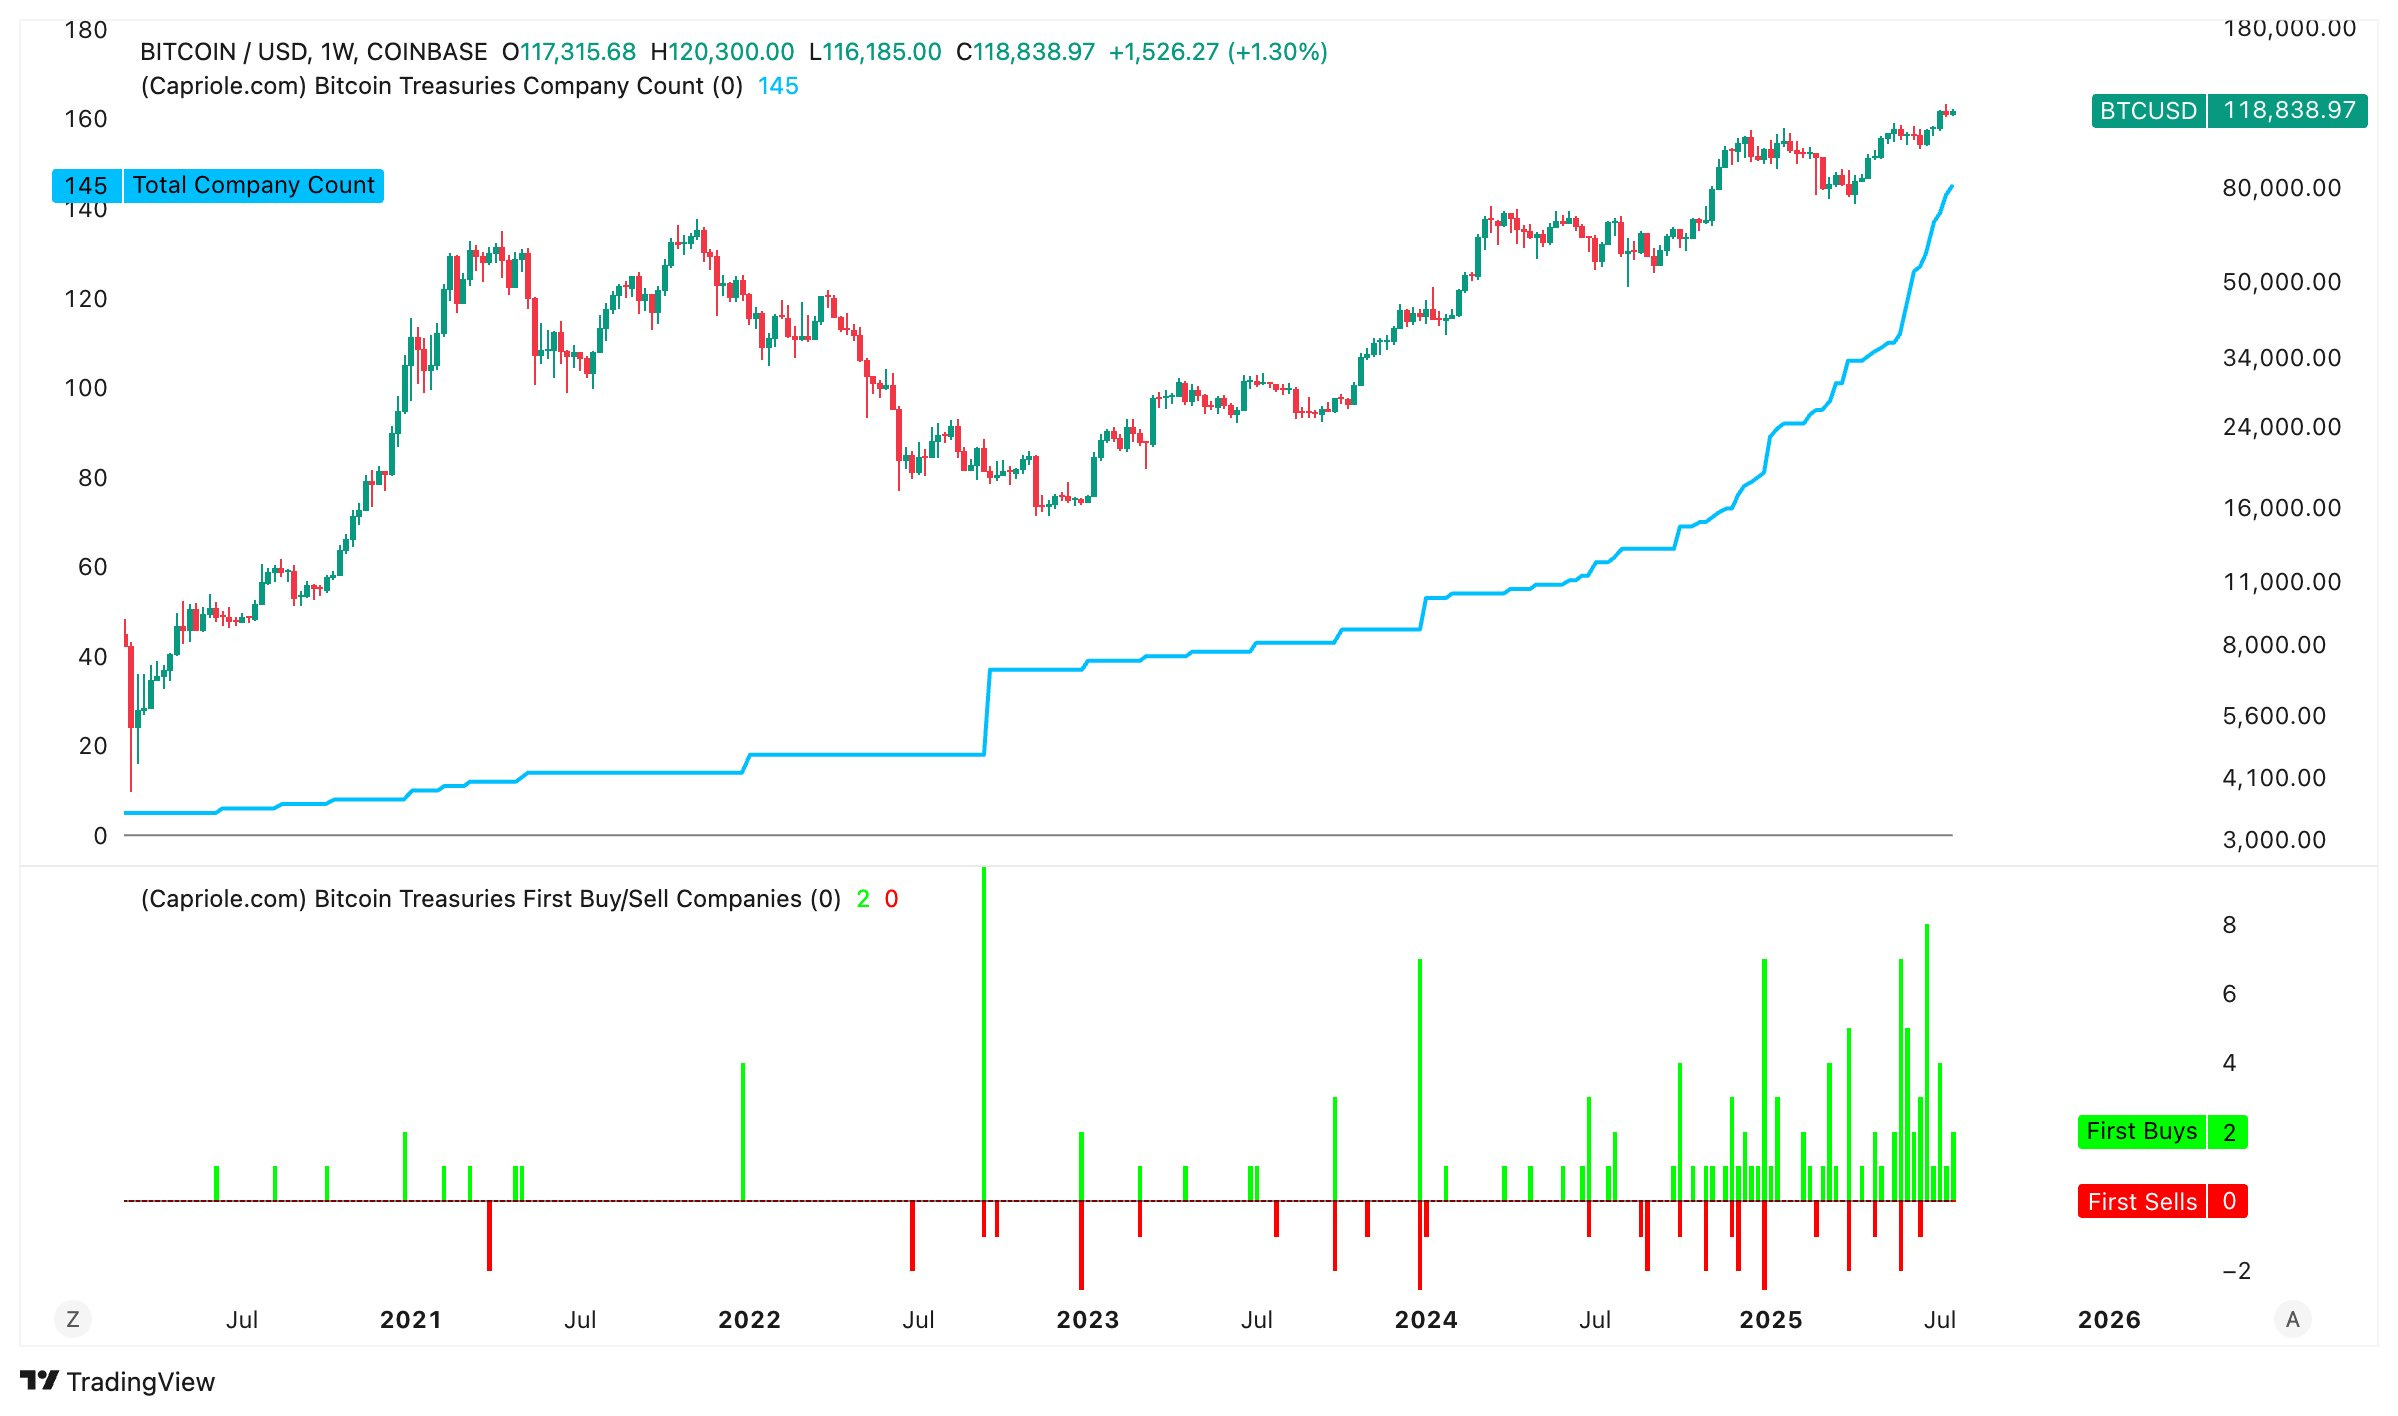
1/ Treasury Company Count
First up we have the count of all public companies that have Bitcoin on their balance sheet. This chart also tracks the count of companies’ first Bitcoin purchases (and sells). As you can see, the chart is trending up exponentially while the number of first time sellers is relatively flat.
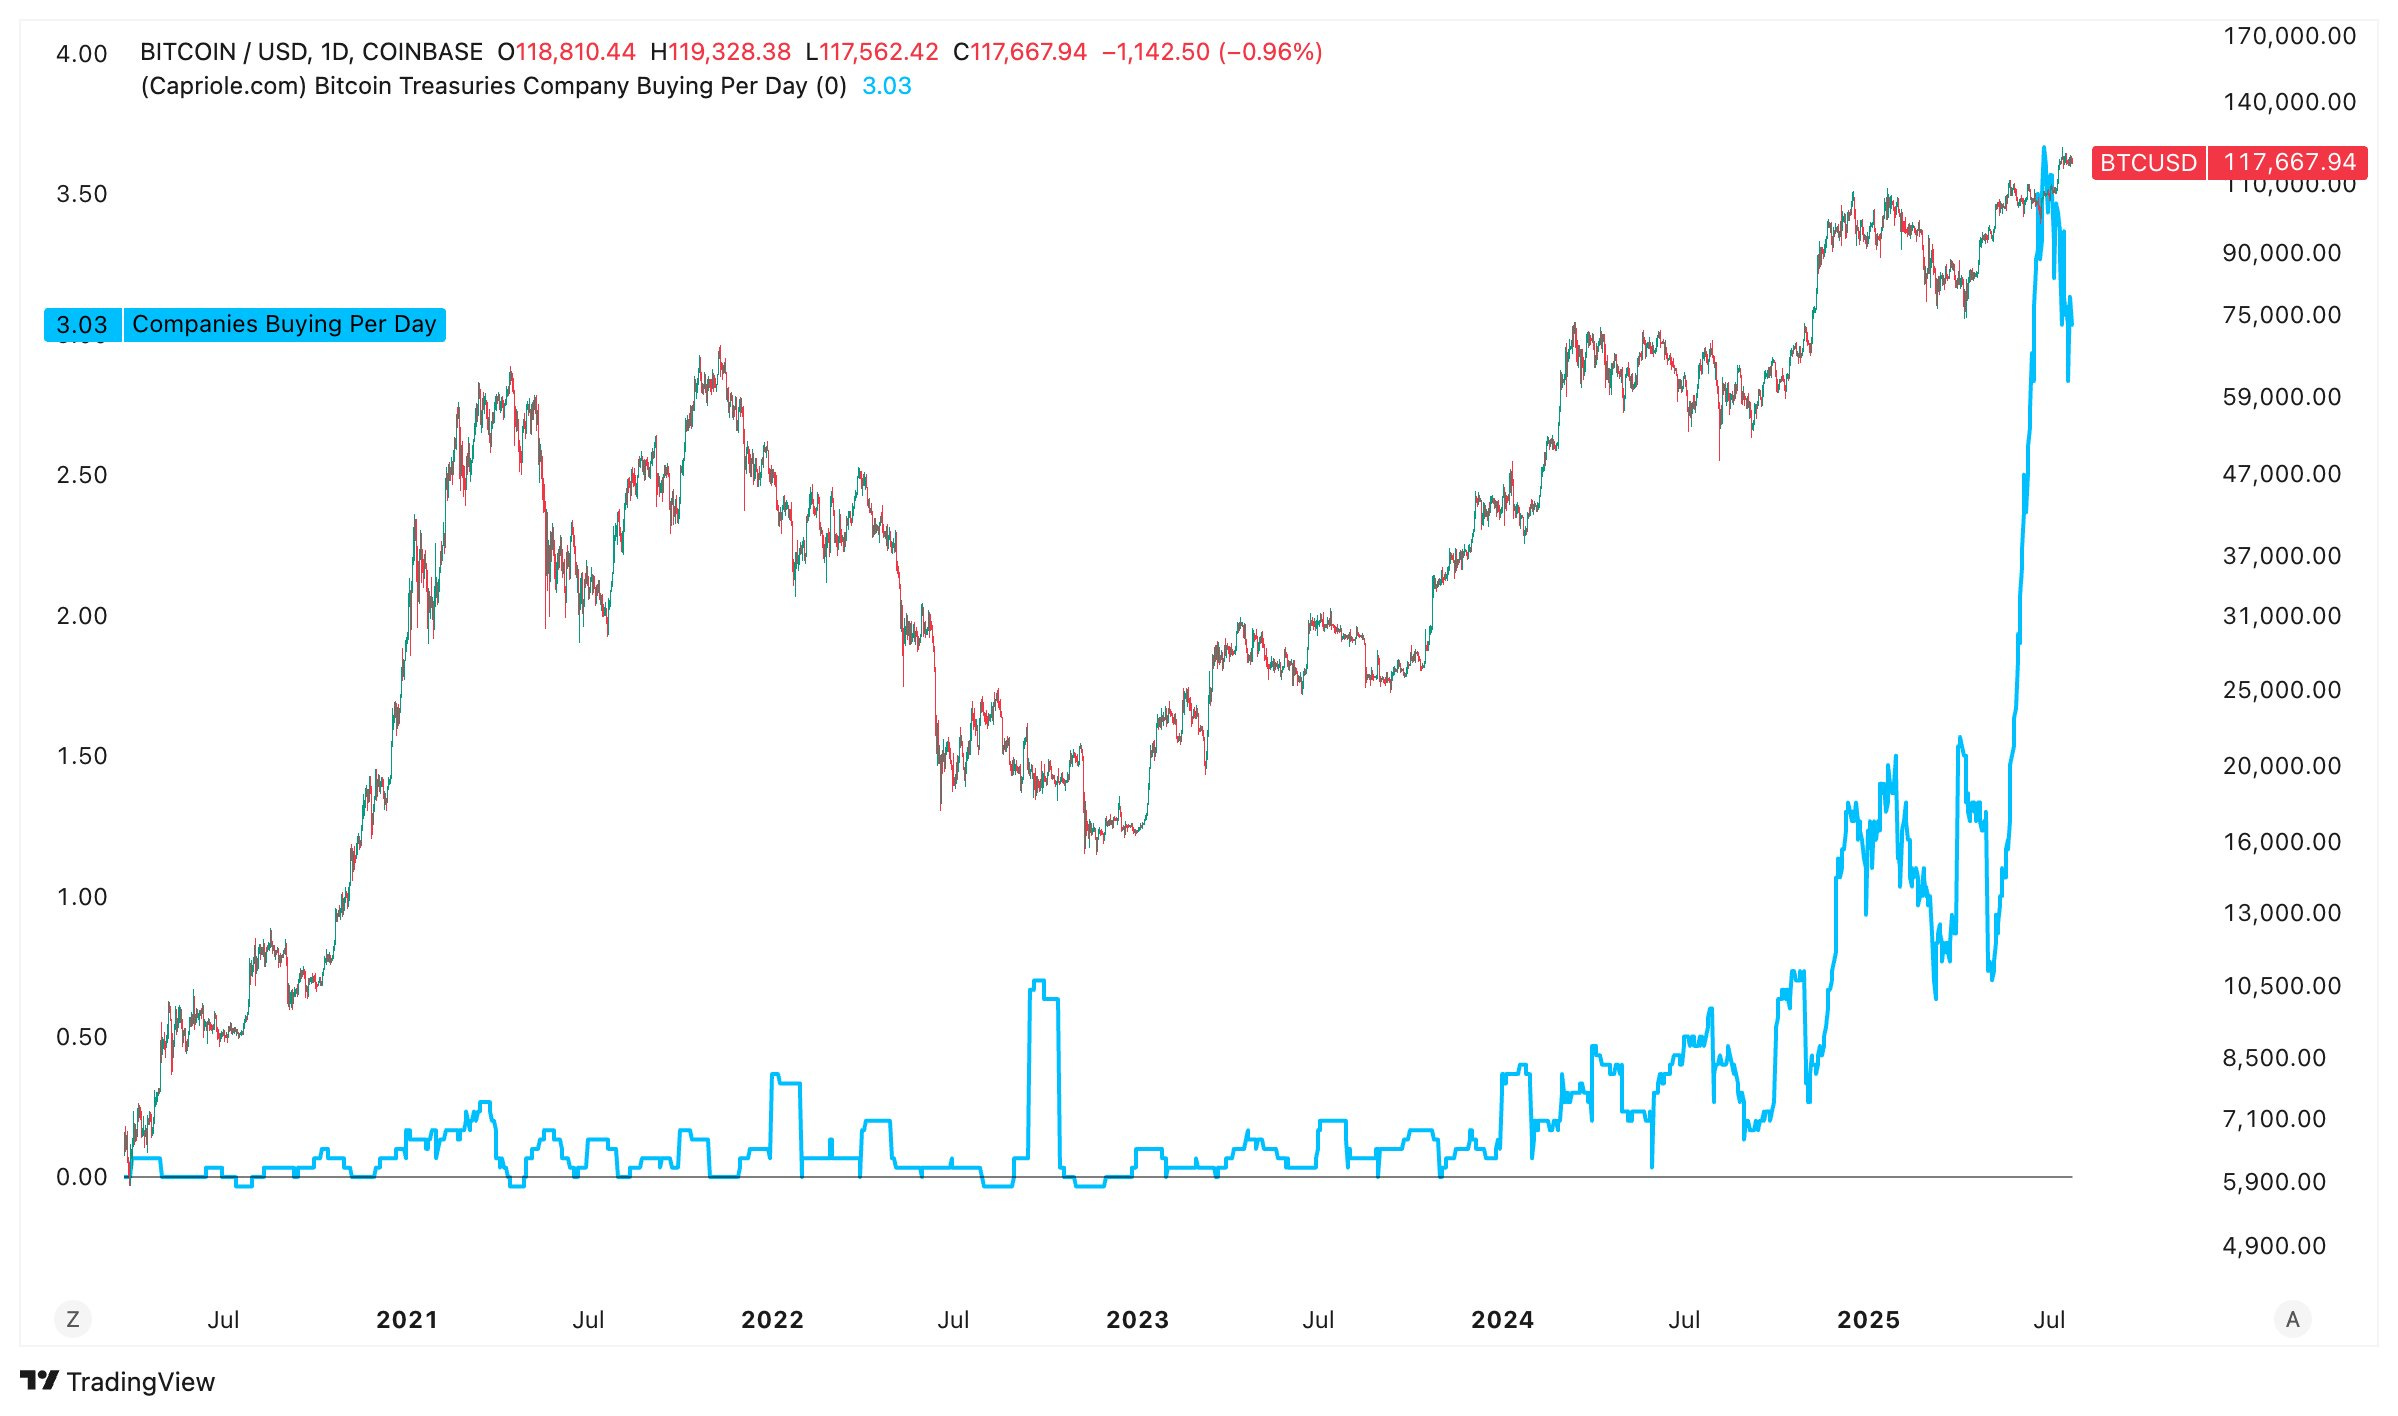
2/ Treasury Buyers Per Day
This is the average count of companies in the world that are buying Bitcoin each day. In the last 6 weeks it’s taken off, with more than three companies buying Bitcoin every single day.
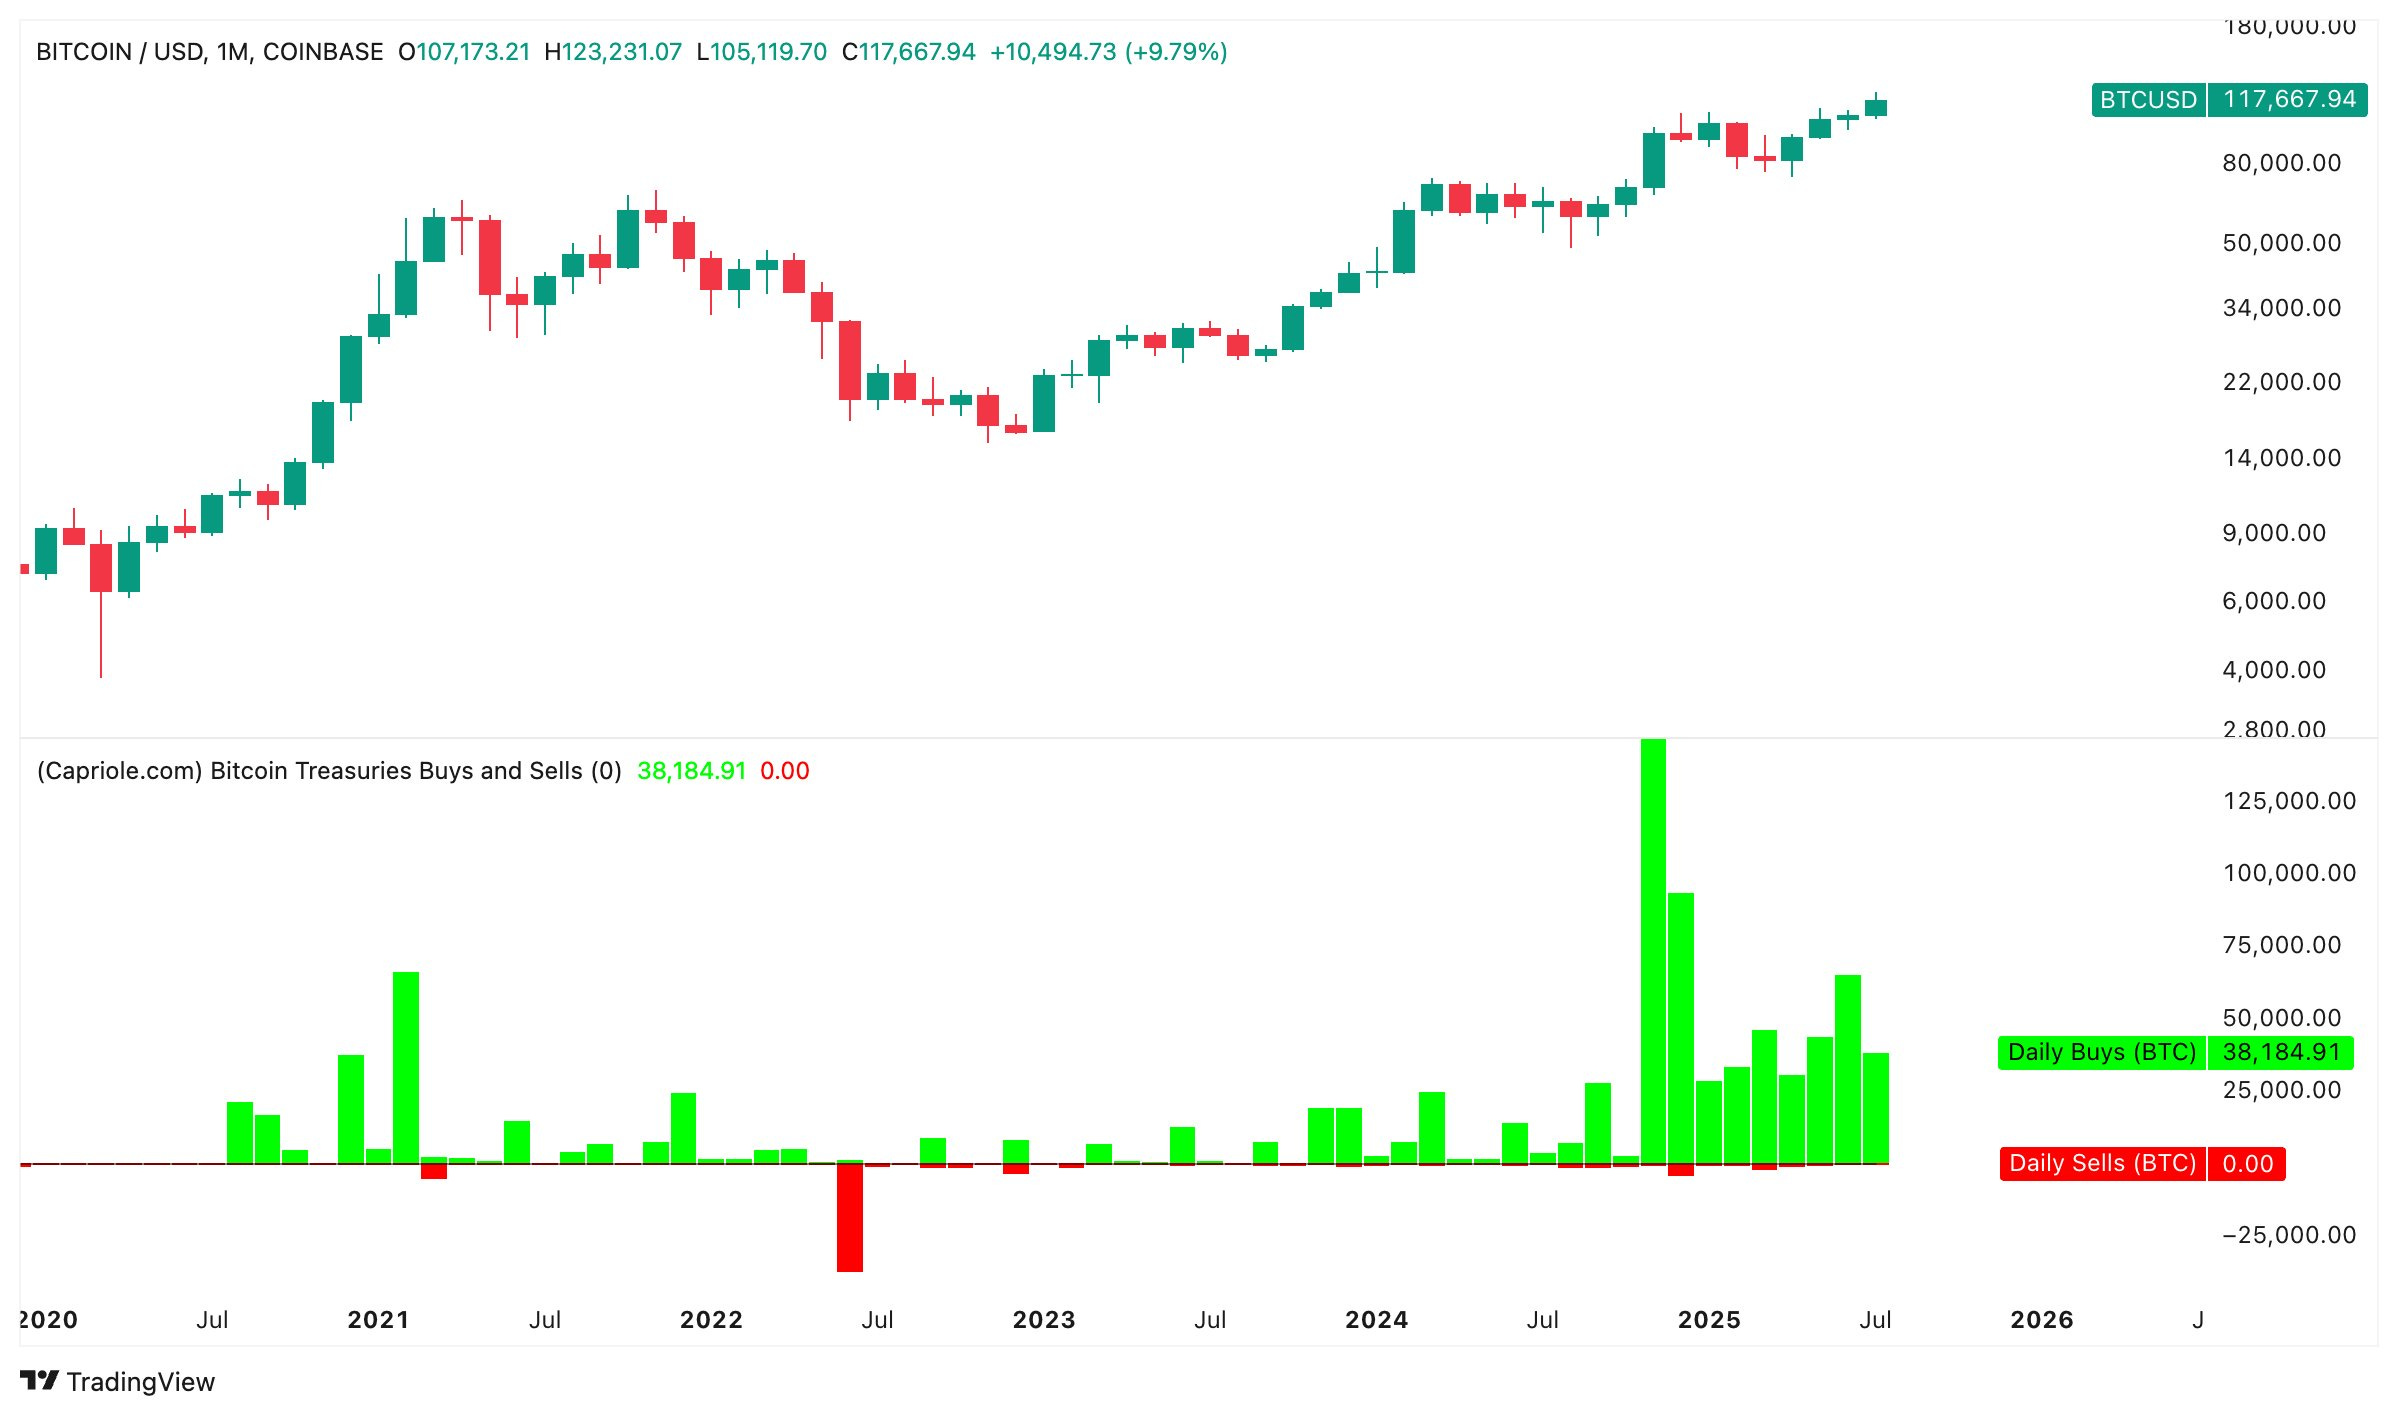
3/ Treasury Buys and Sells
Here you can track the sum of Bitcoin bought versus sold by Treasury companies (in BTC or USD) on all timeframes. There’s currently over 100:1 buyers vs sellers per month.
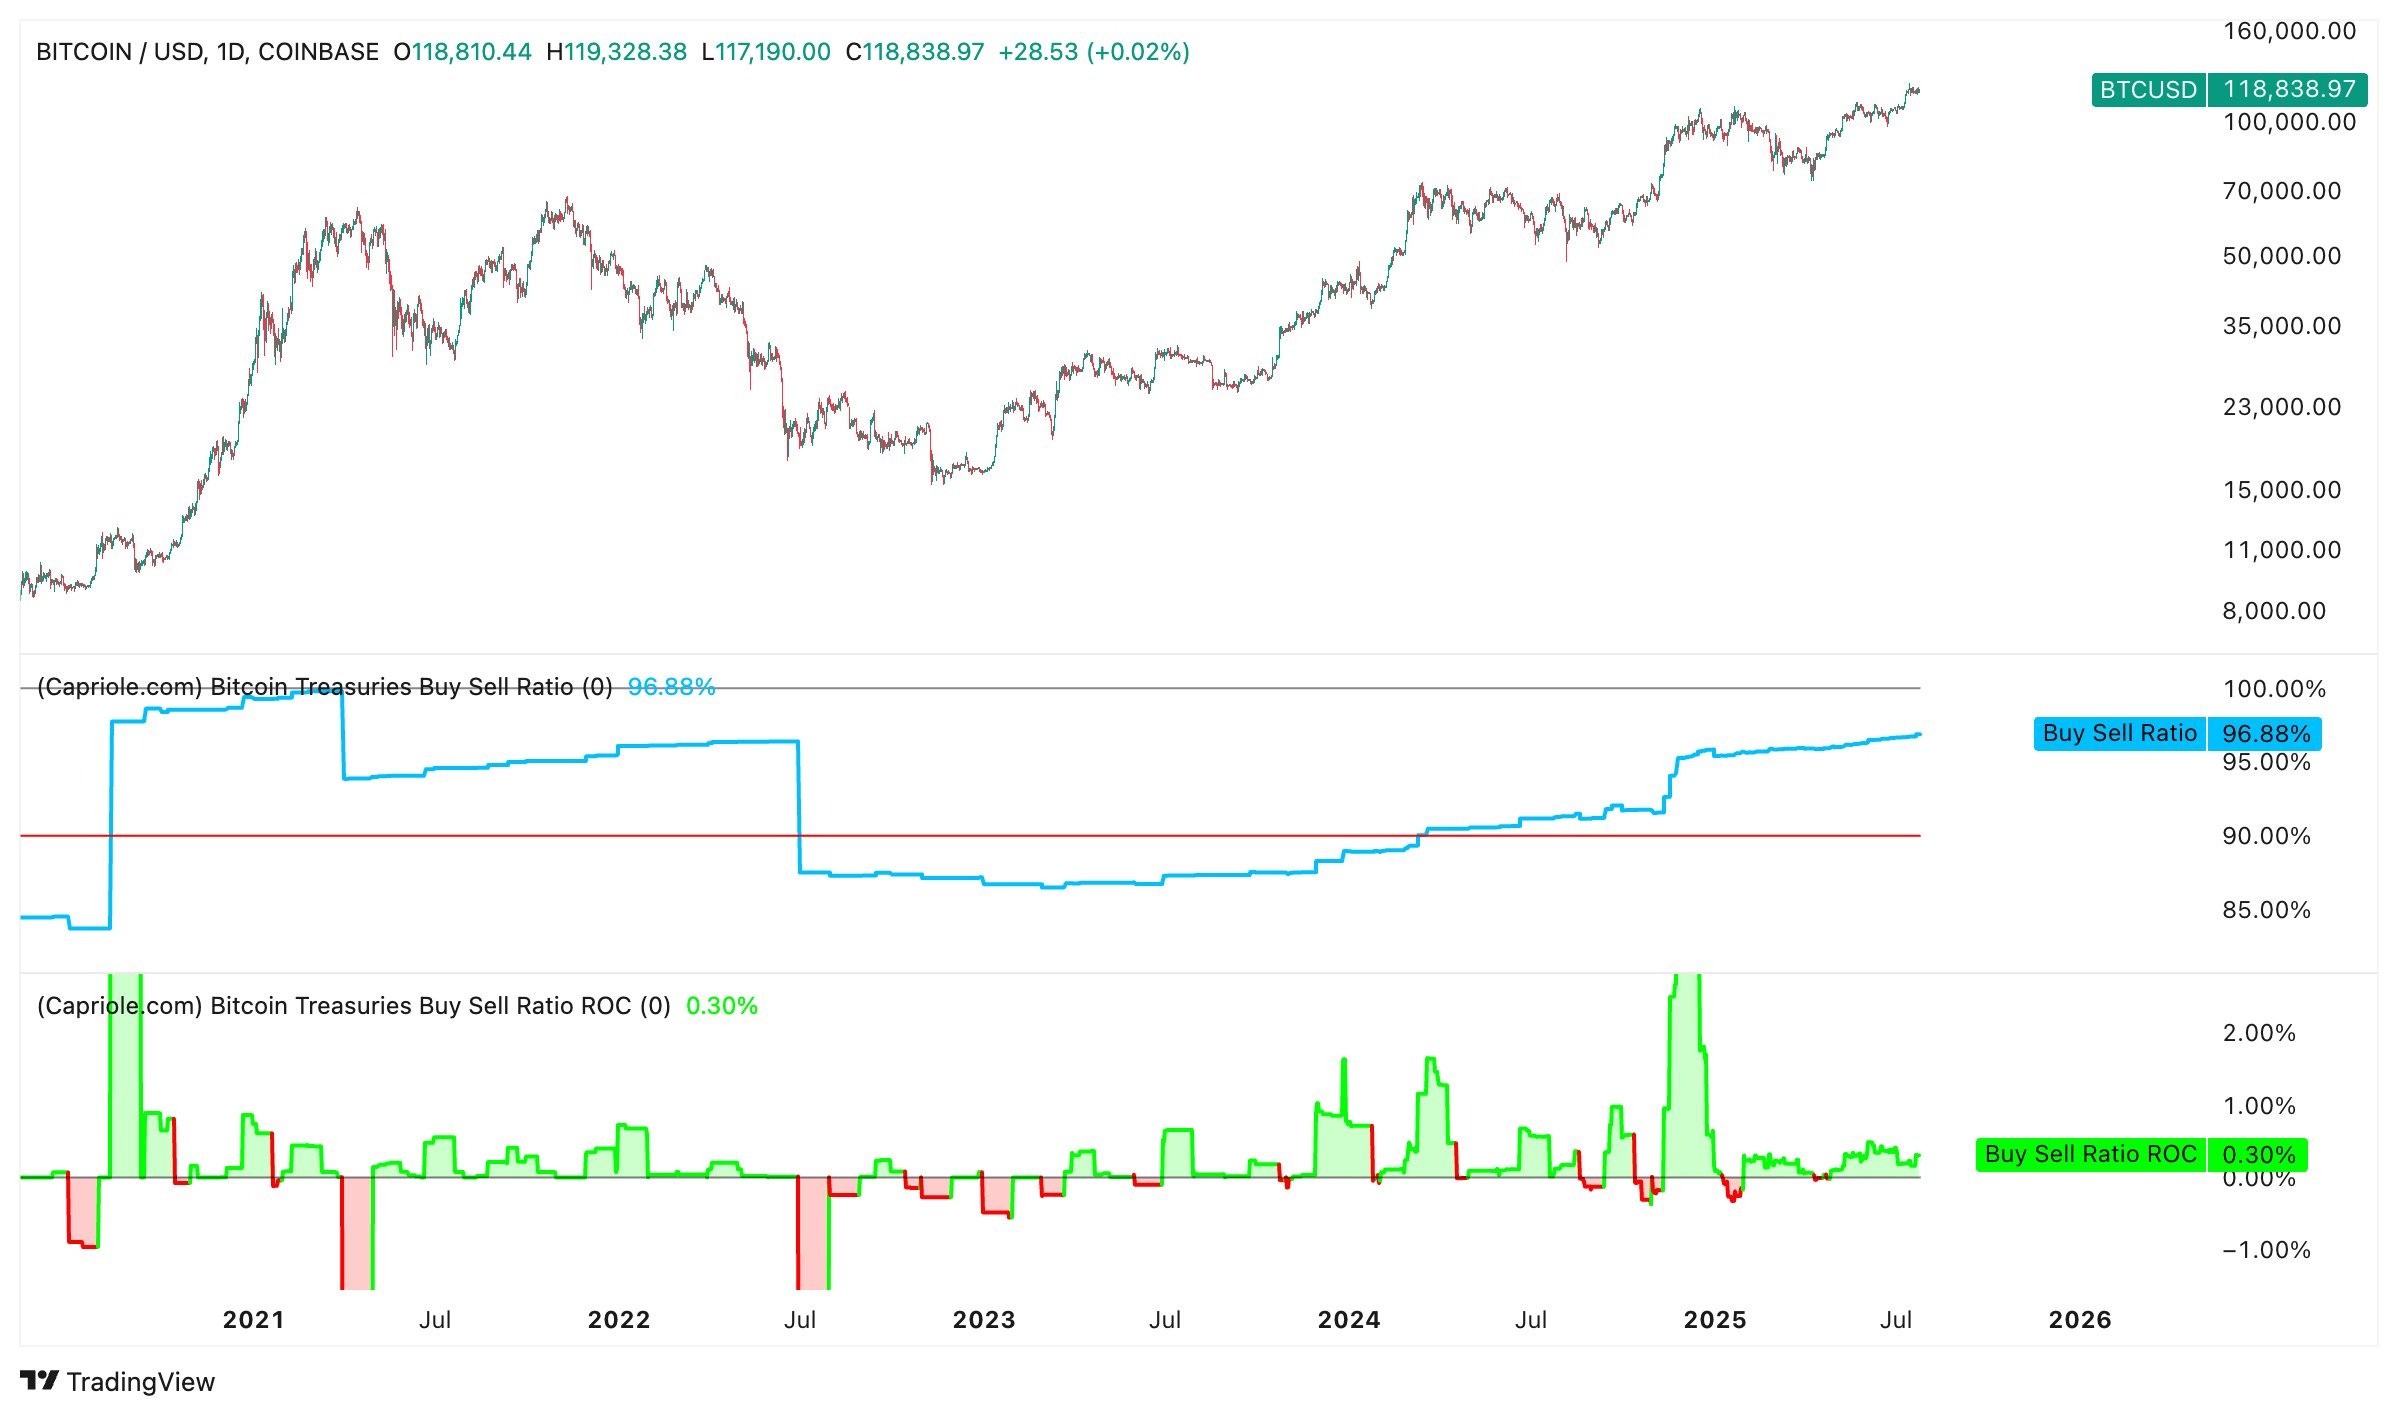
4/ Treasury Buy-Sell Ratio
Very important for risk management. This metric tracks the relative portion of cumulative treasury buying to selling. Trends down in this metric have historically been bearish, while trends up tend to be bullish as supply is extracted from the market. A sudden drop would be a warning sign. You can read more about the potential risks in Update #65.
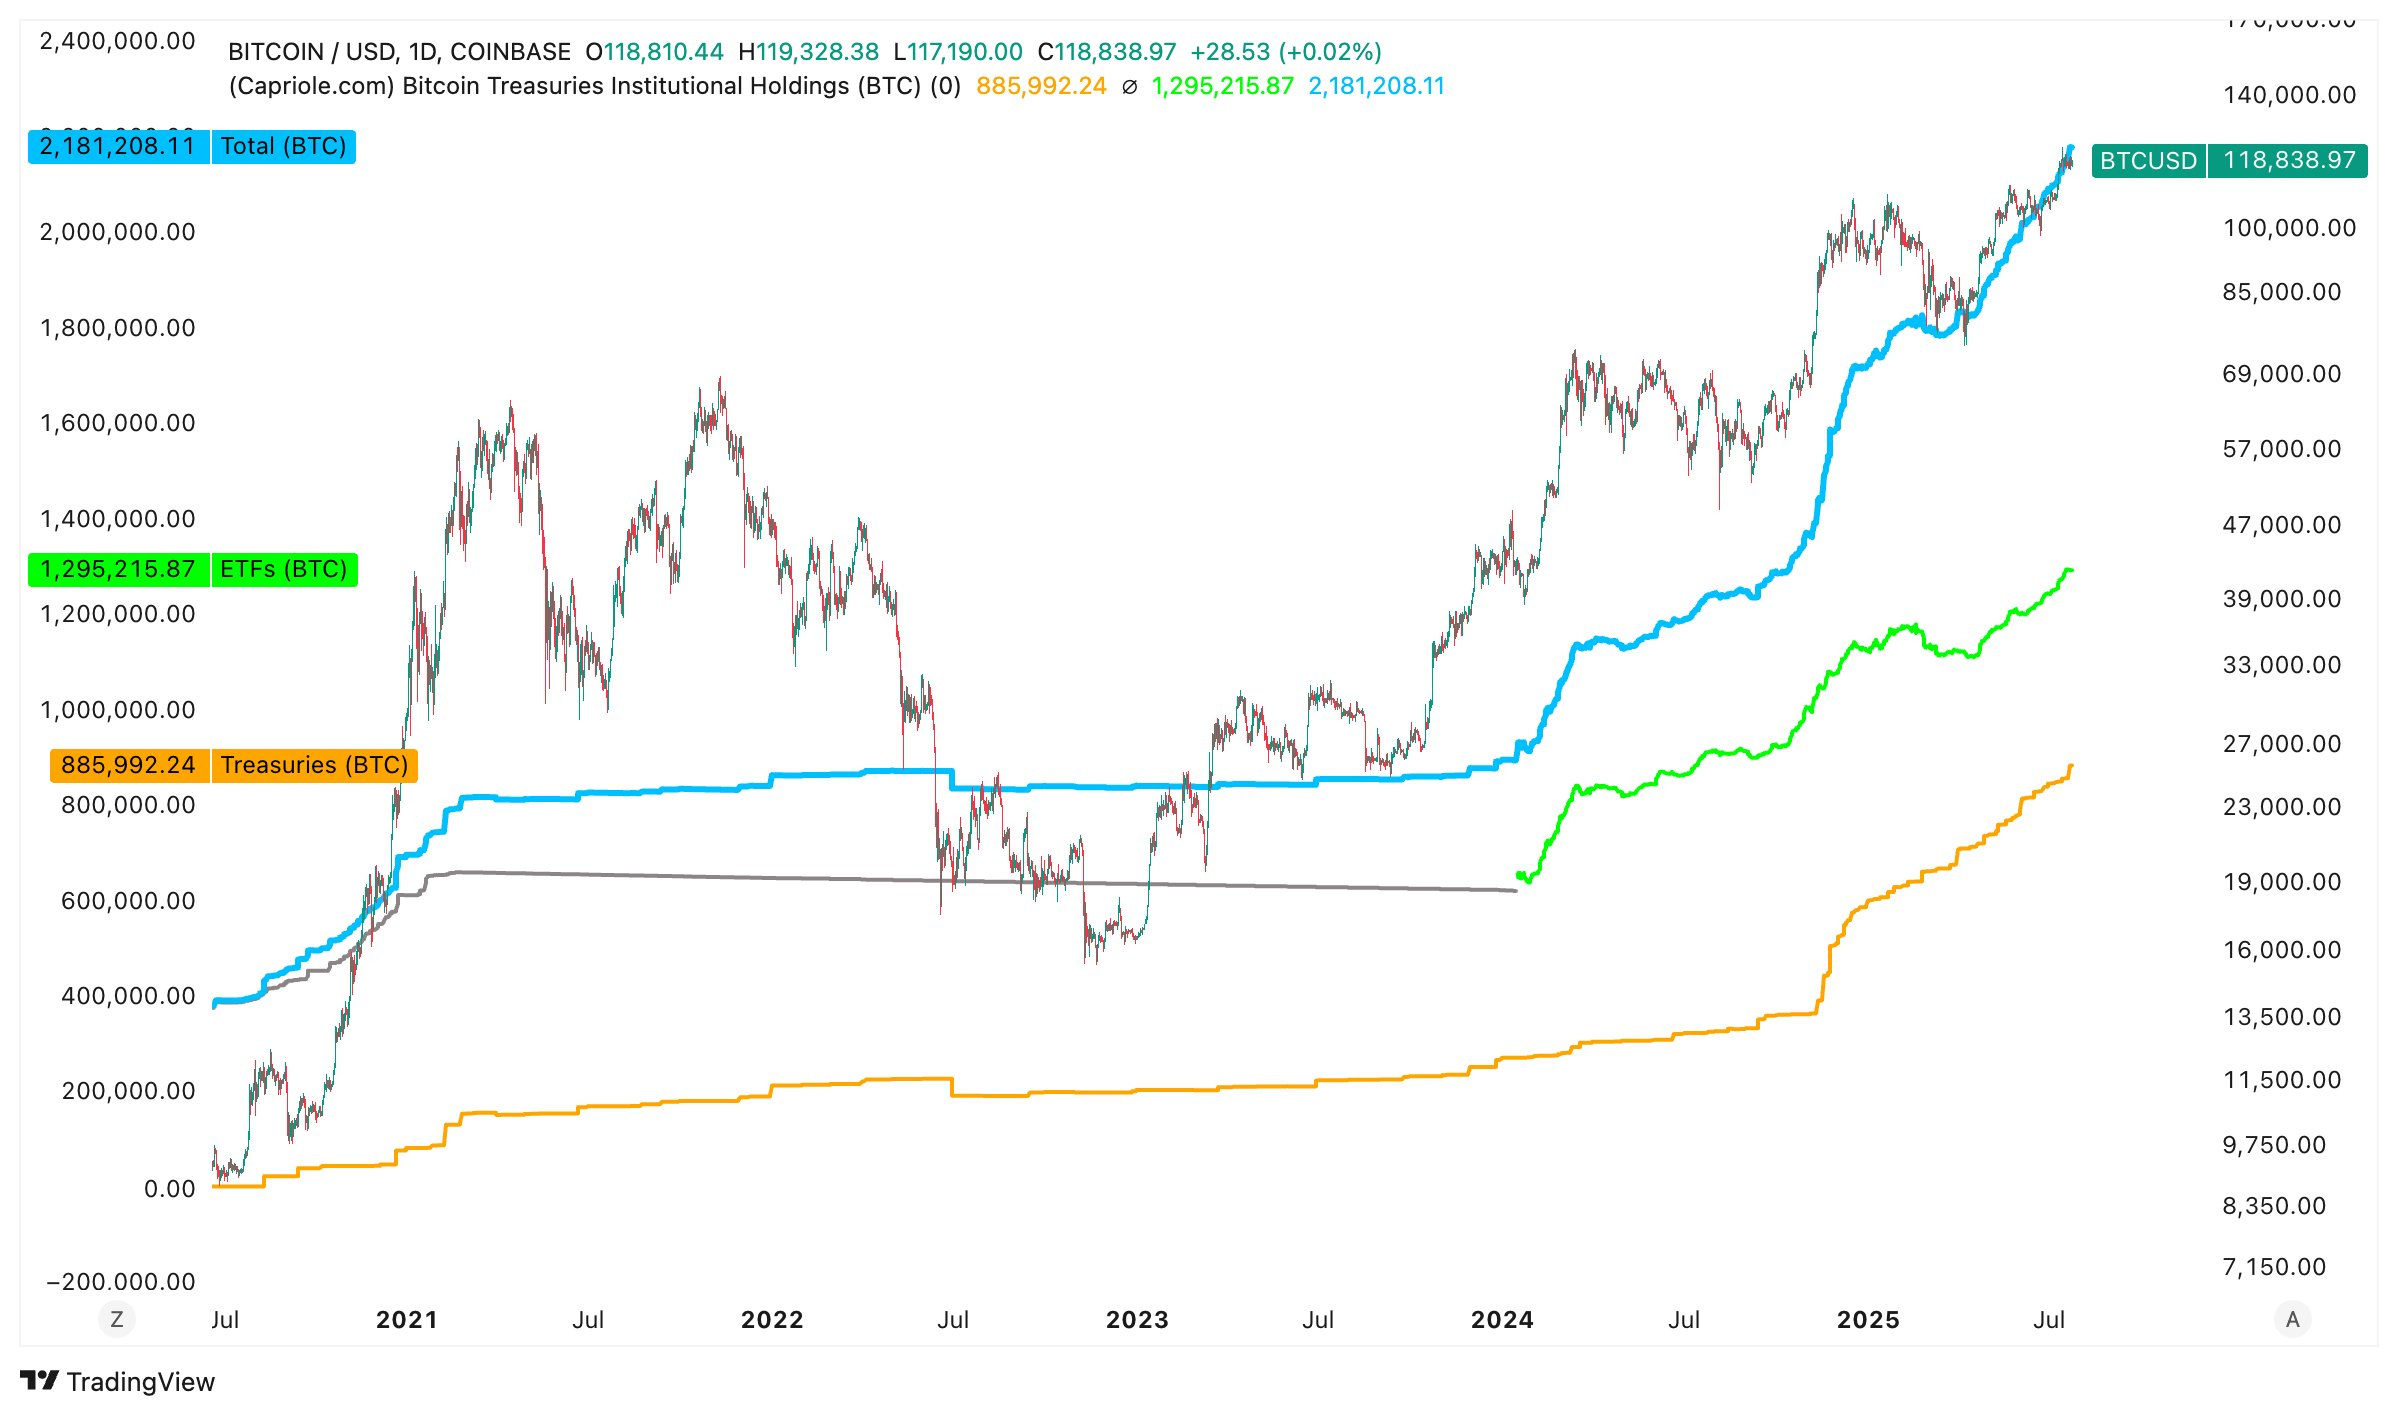
5/ Institutional Holdings (BTC)
Here we track the total Bitcoin held by all institutions, including public treasury companies, ETFs and the Grayscale Trust. Are you starting to see a relationship with price? Keep reading, it gets better.
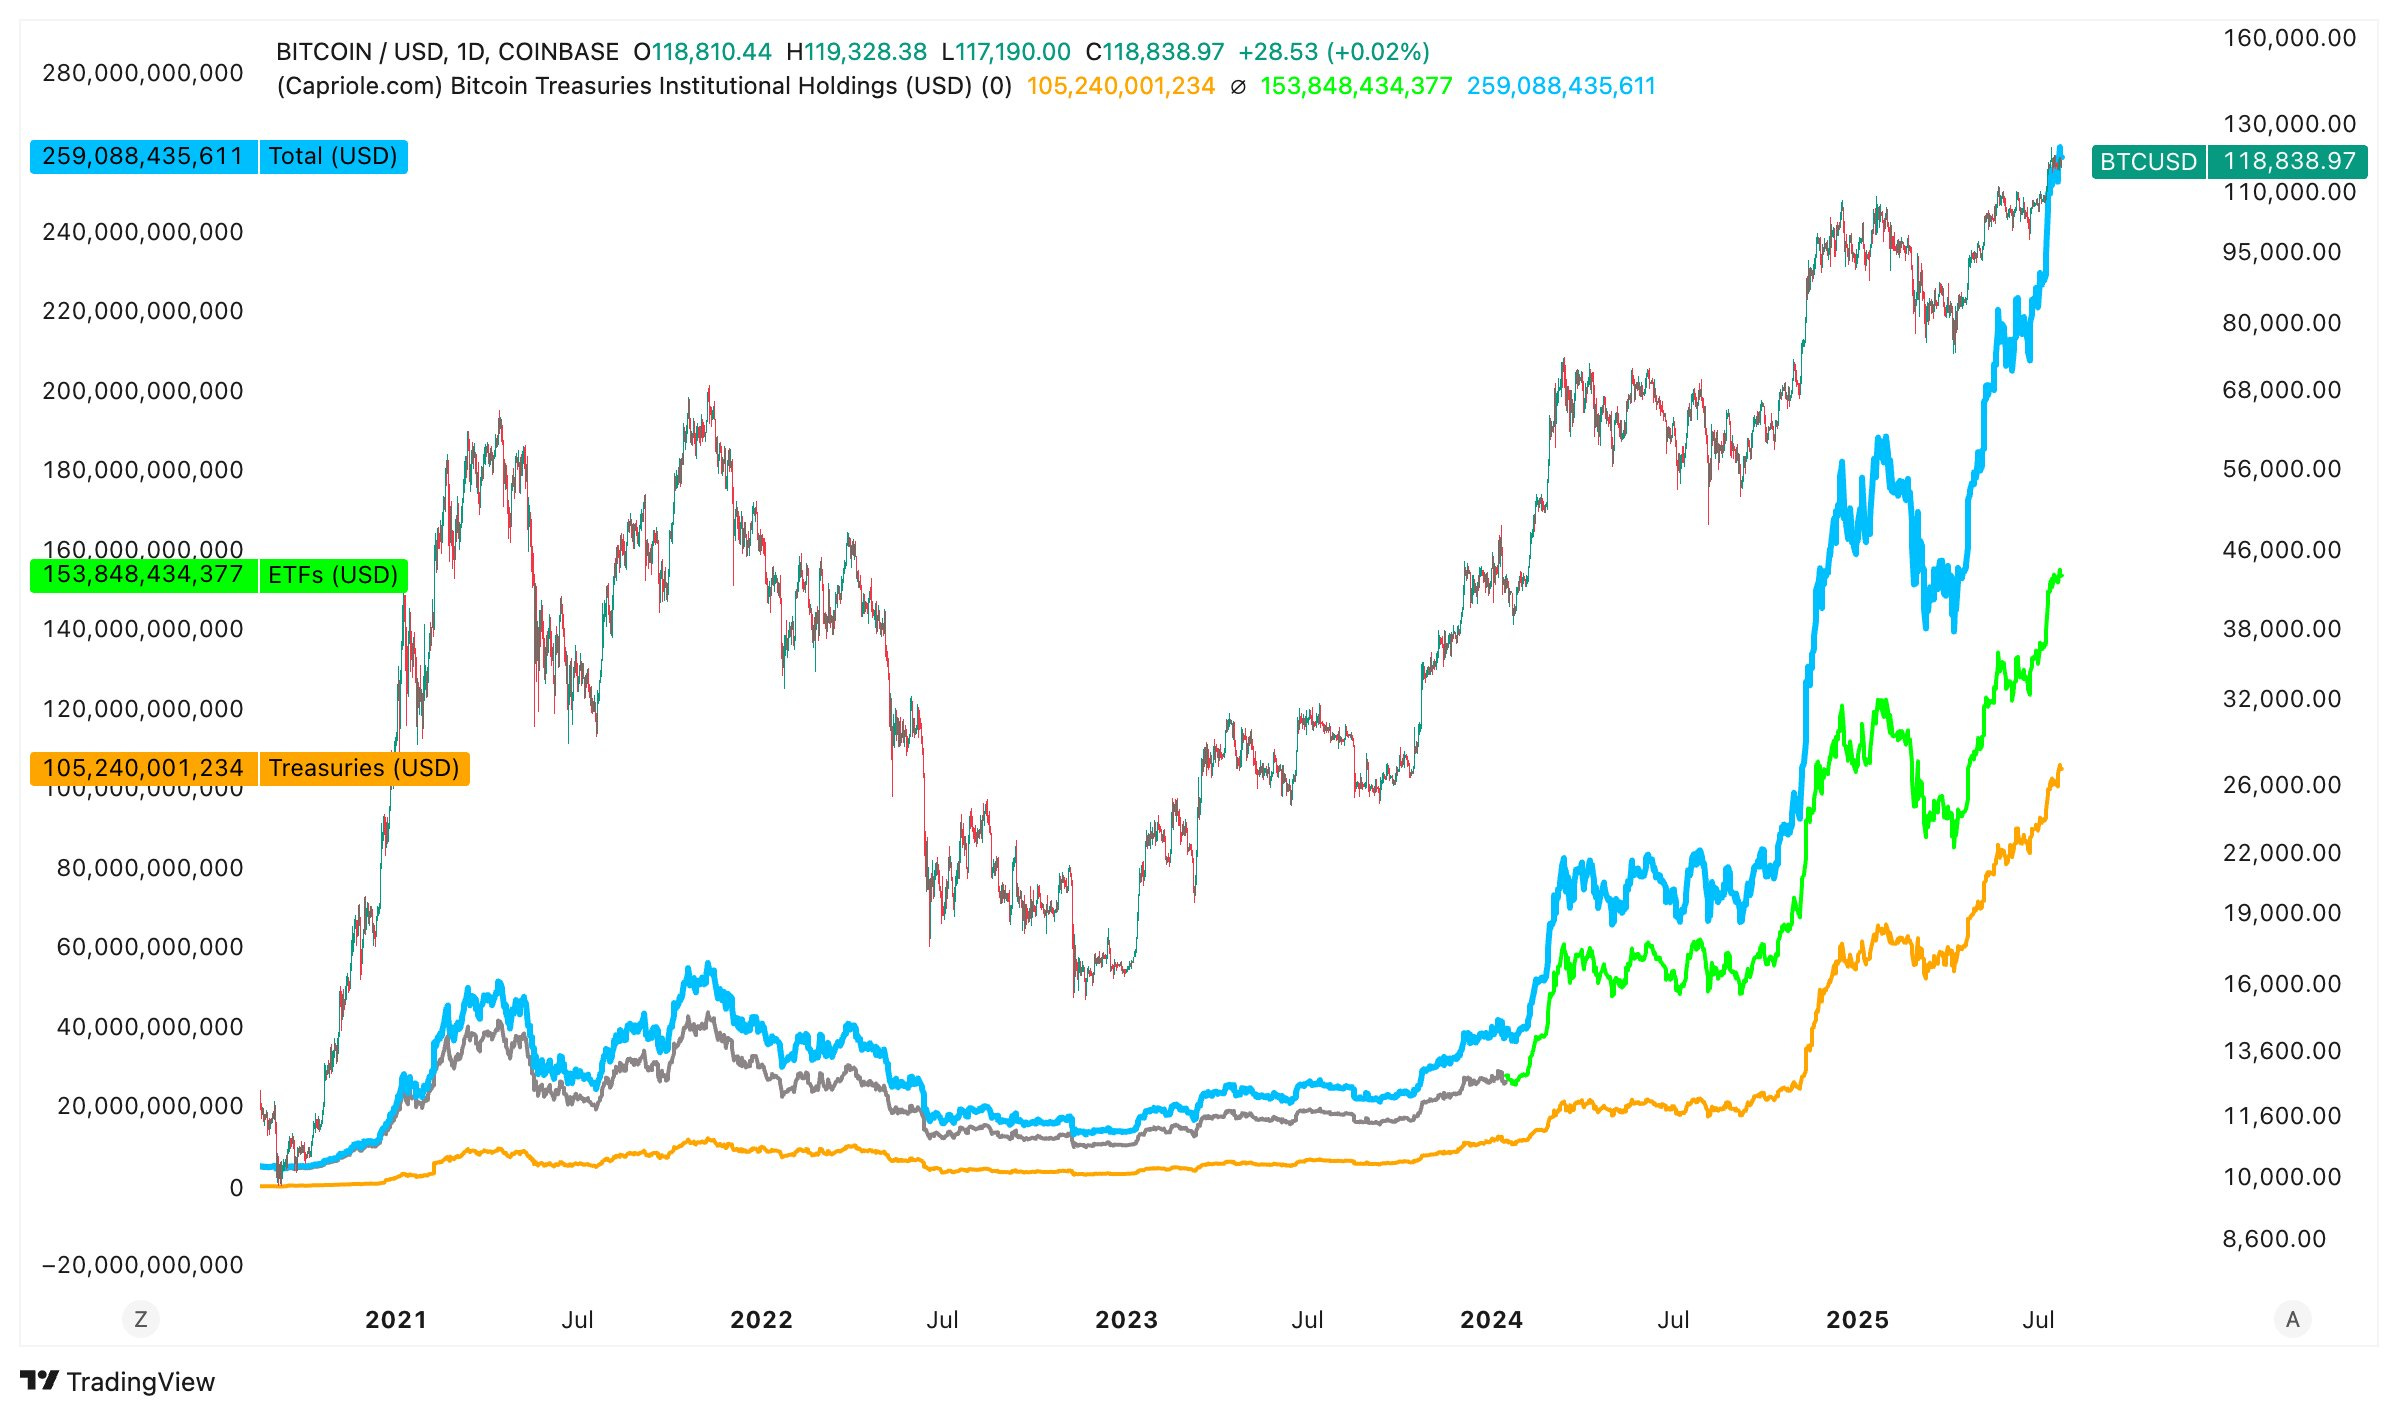
6/ Institutional Holdings (USD)
Nothing to see here… just a measly ¼ Trillion United States Dollars have now been parked in Bitcoin by institutions.
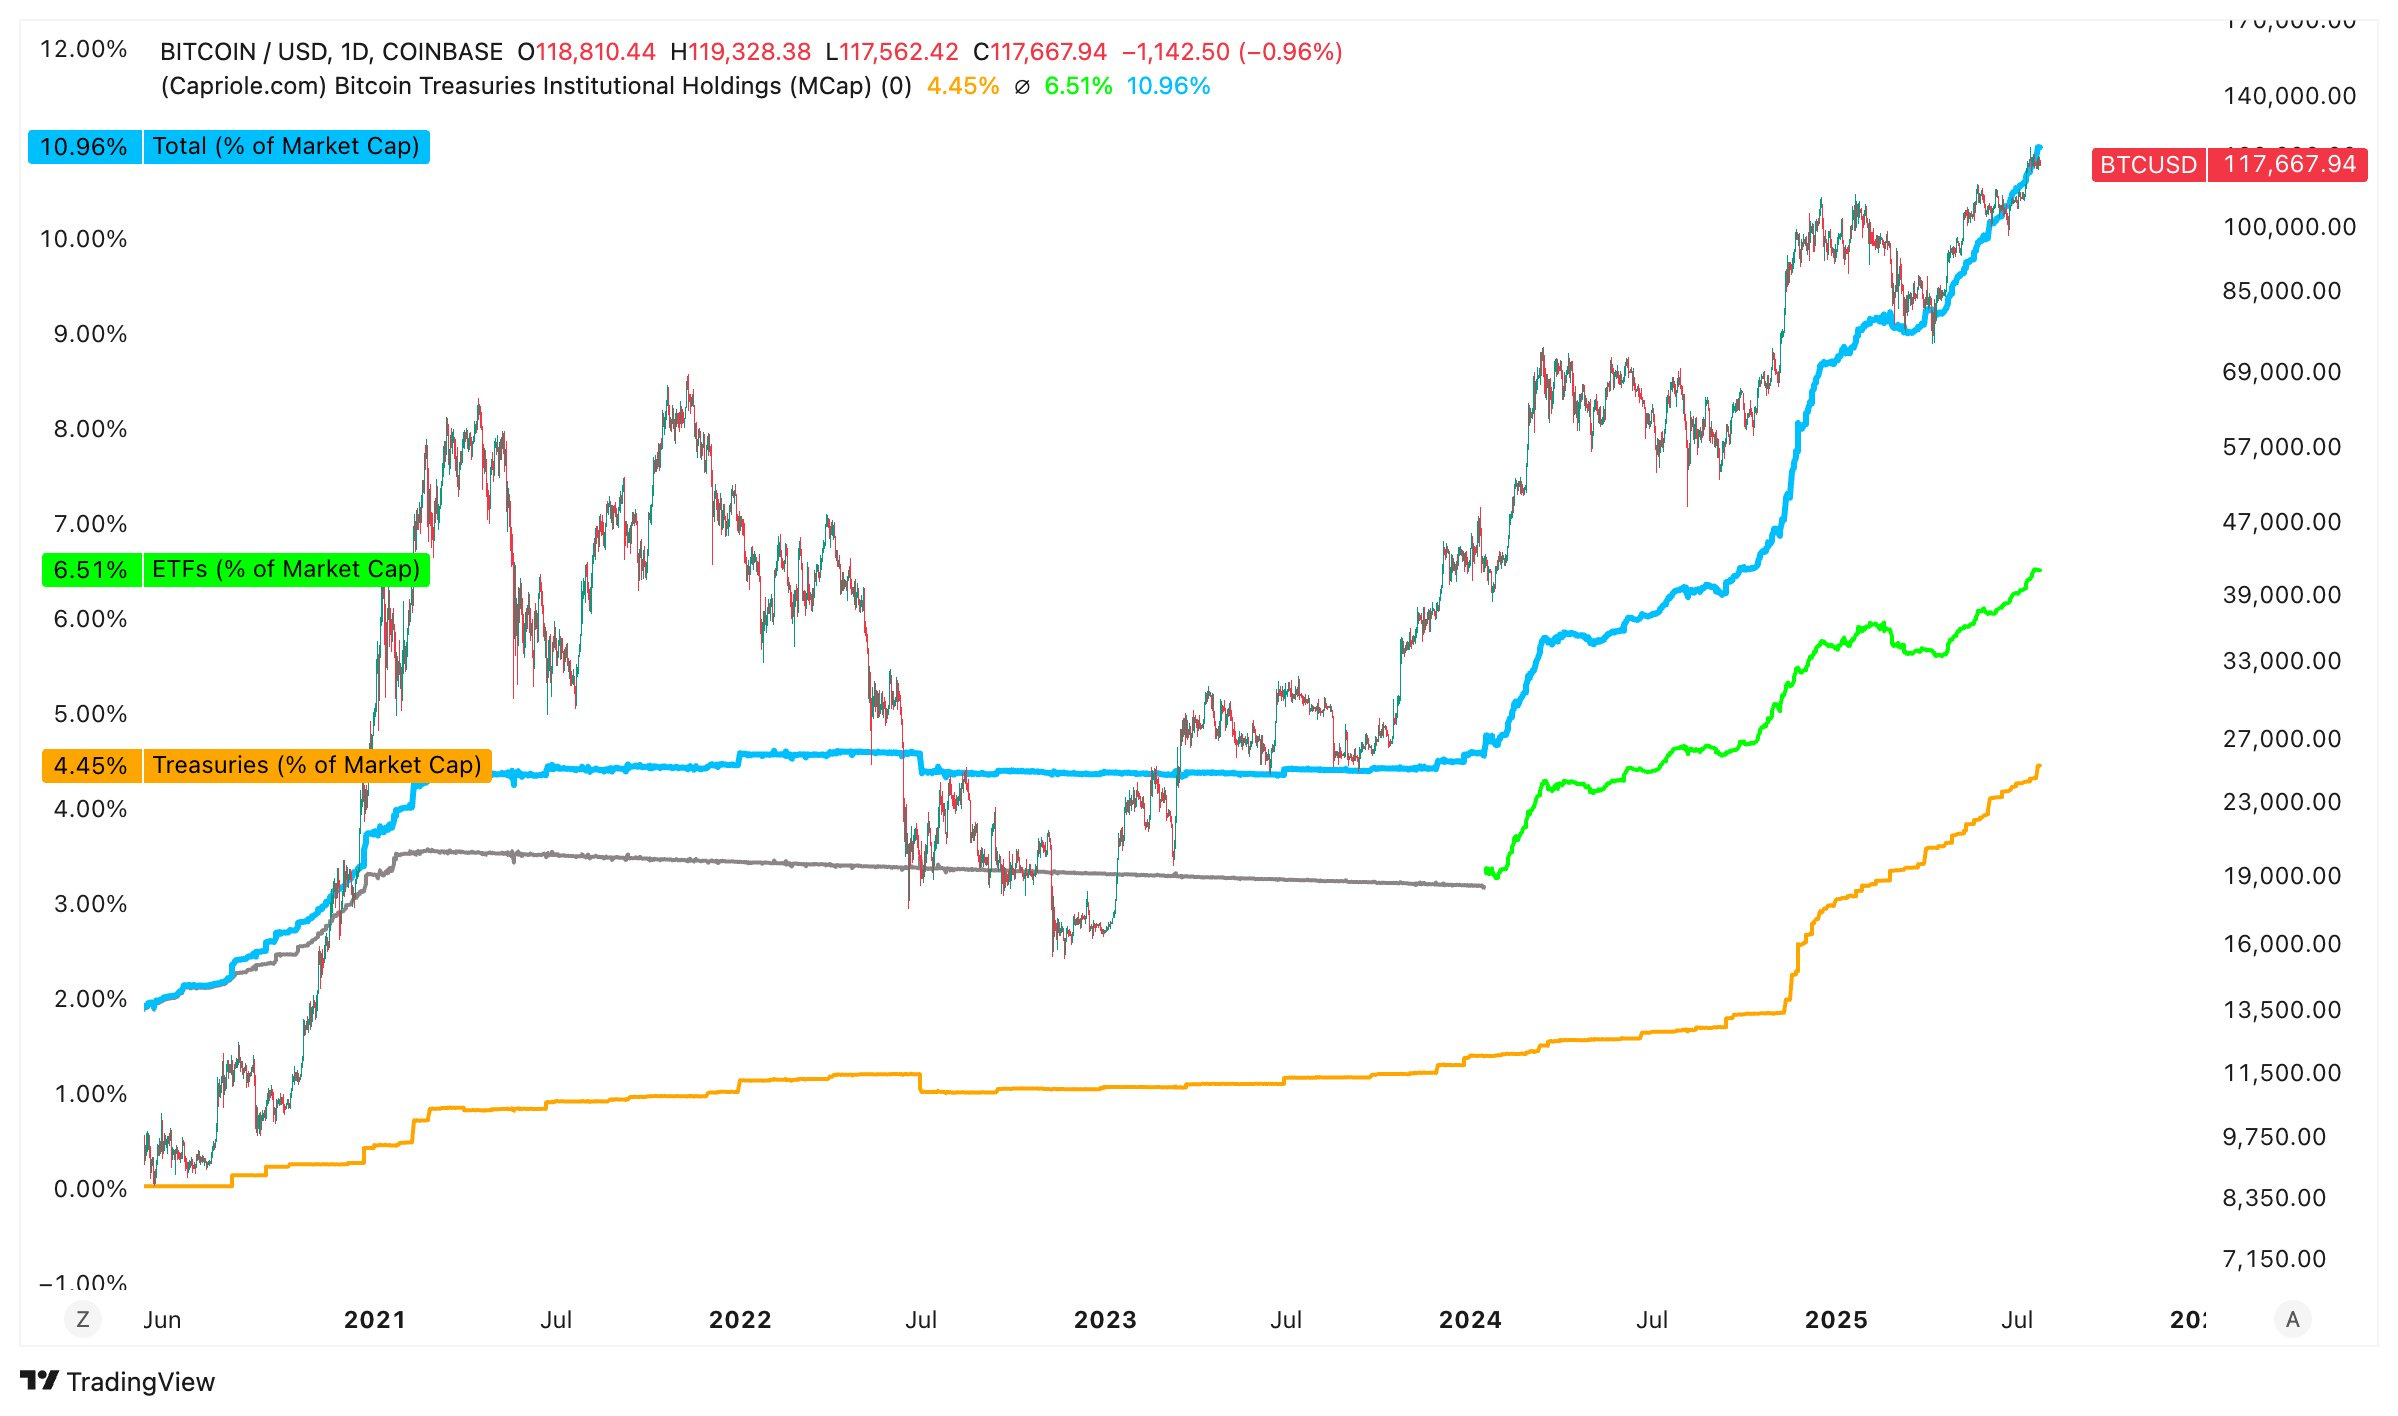
7/ Institutional Holdings (MCap)
The percentage of total Bitcoin supply held by institutions has just breached 10% for the first time ever. Up from only 4% just 18 months ago.
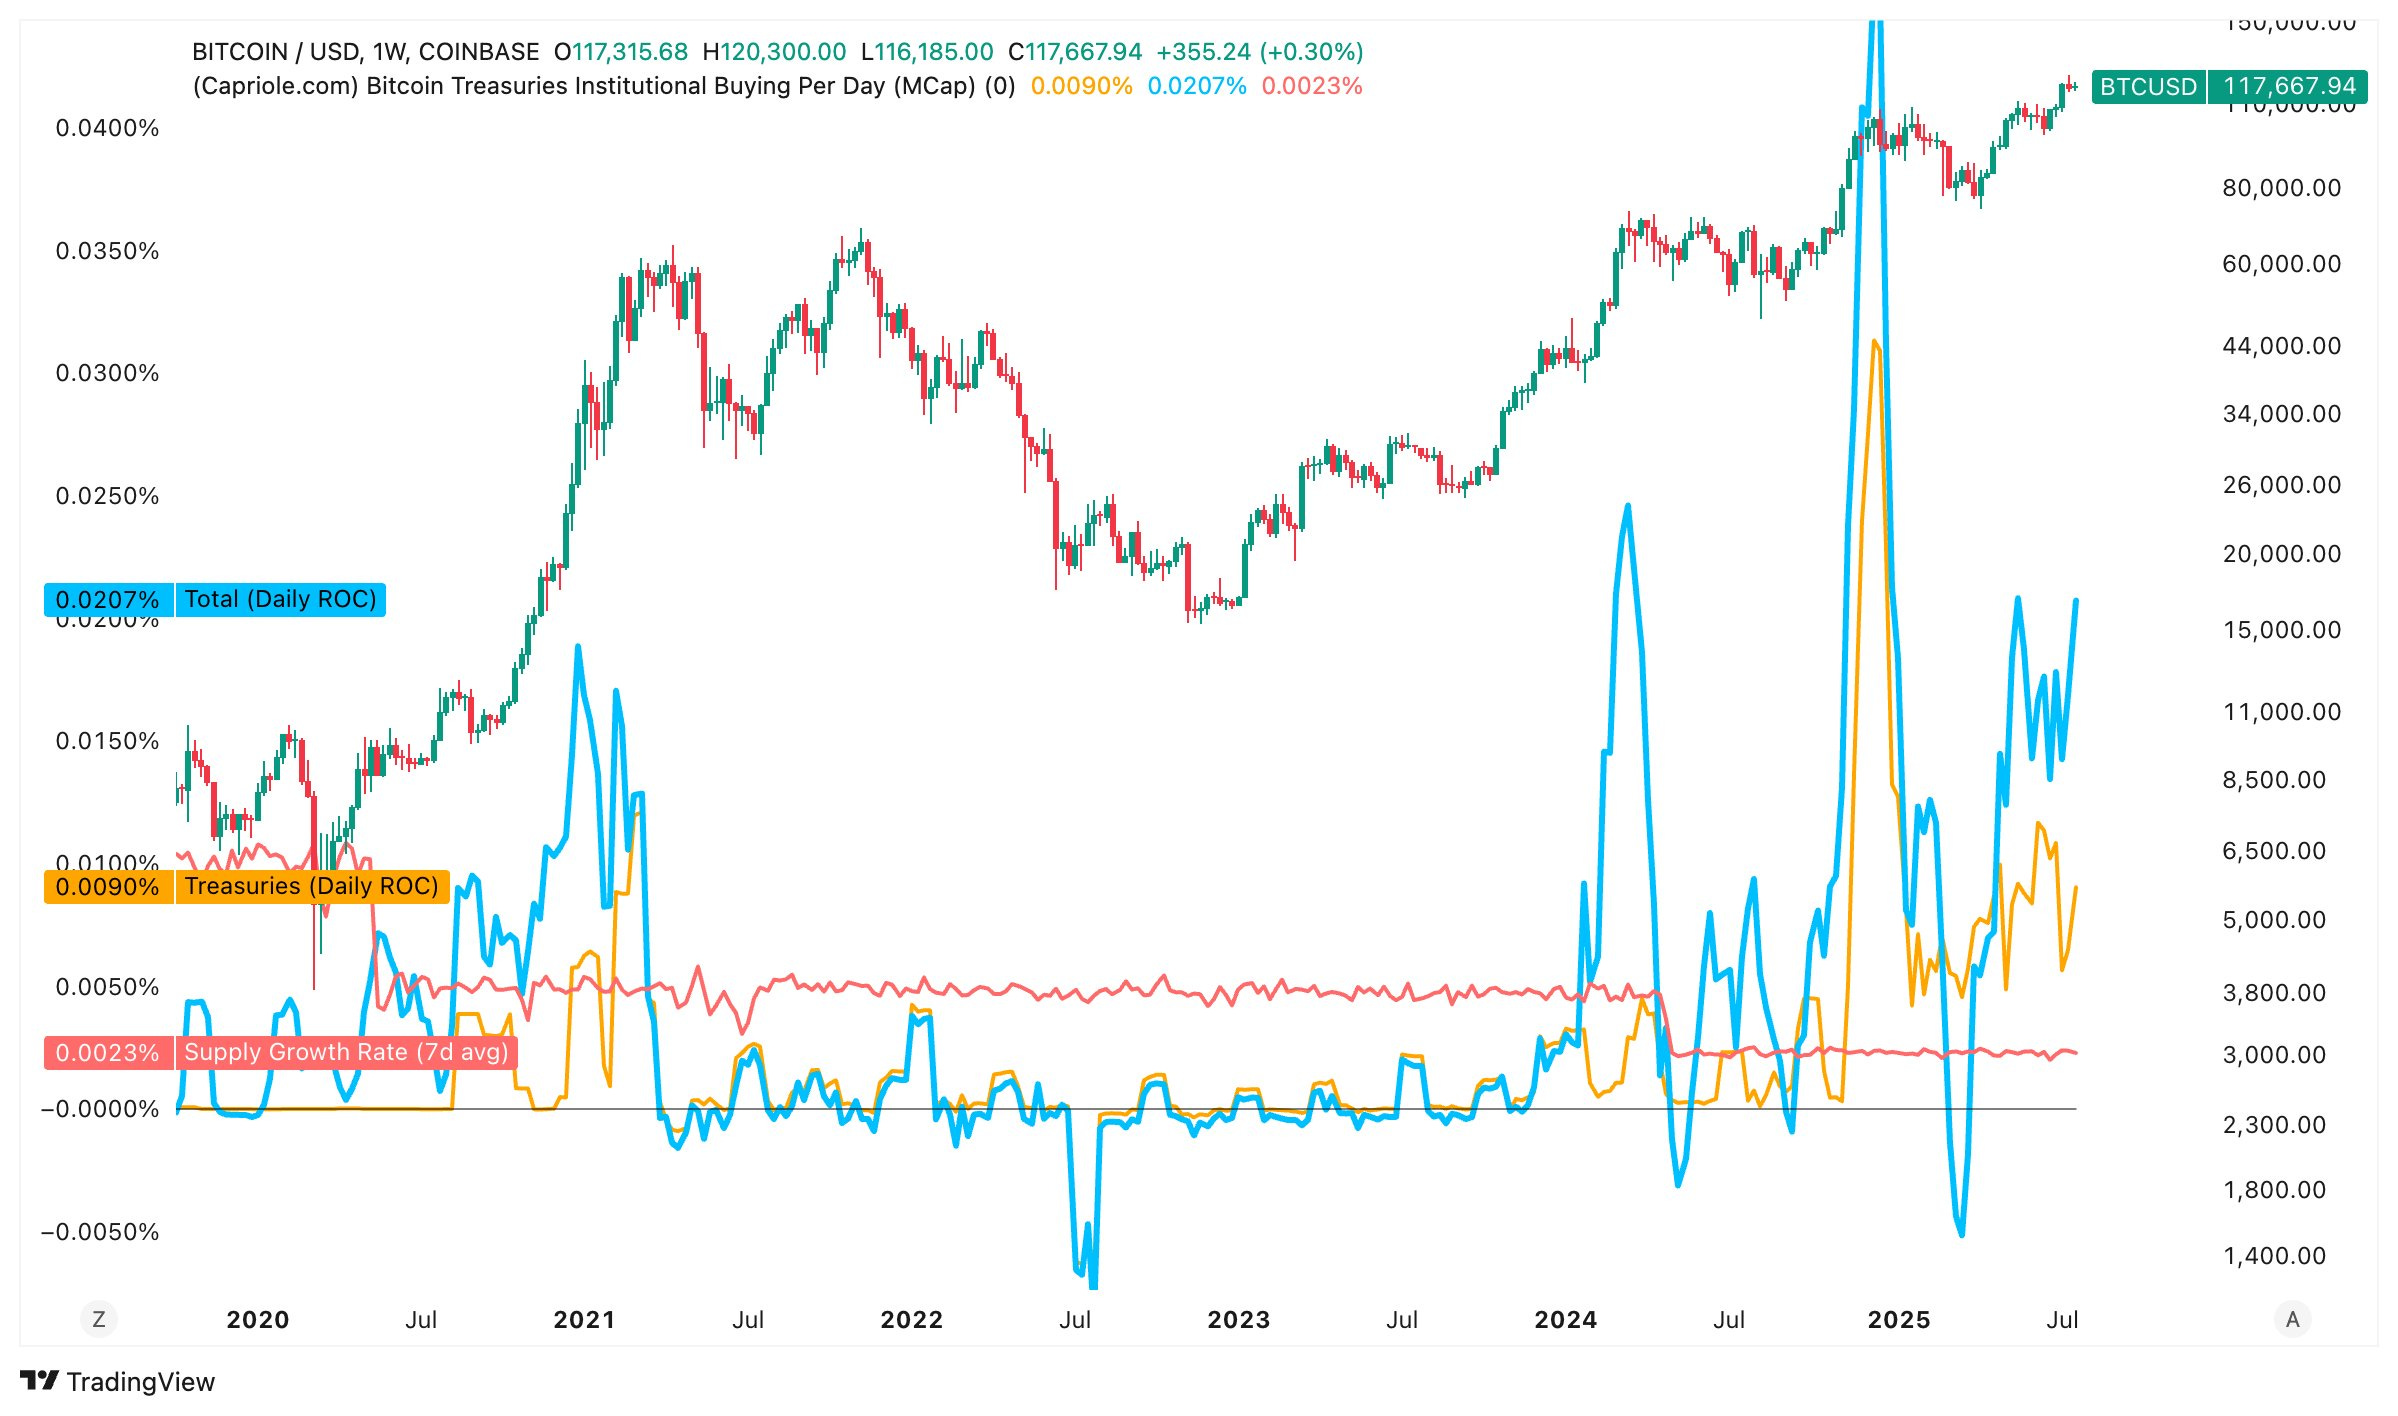
8/ Institutional Buying Per Day (MCap)
This chart will blow your mind. The daily percentage of all Bitcoin in existence that is being acquired by institutions per day (blue) is currently 10X higher than the Bitcoin mining Supply Growth Rate (red)! Notice how every time institutional buying has exceeded the Supply Growth Rate, price went VERTICAL. In 2020 too. Strap in.
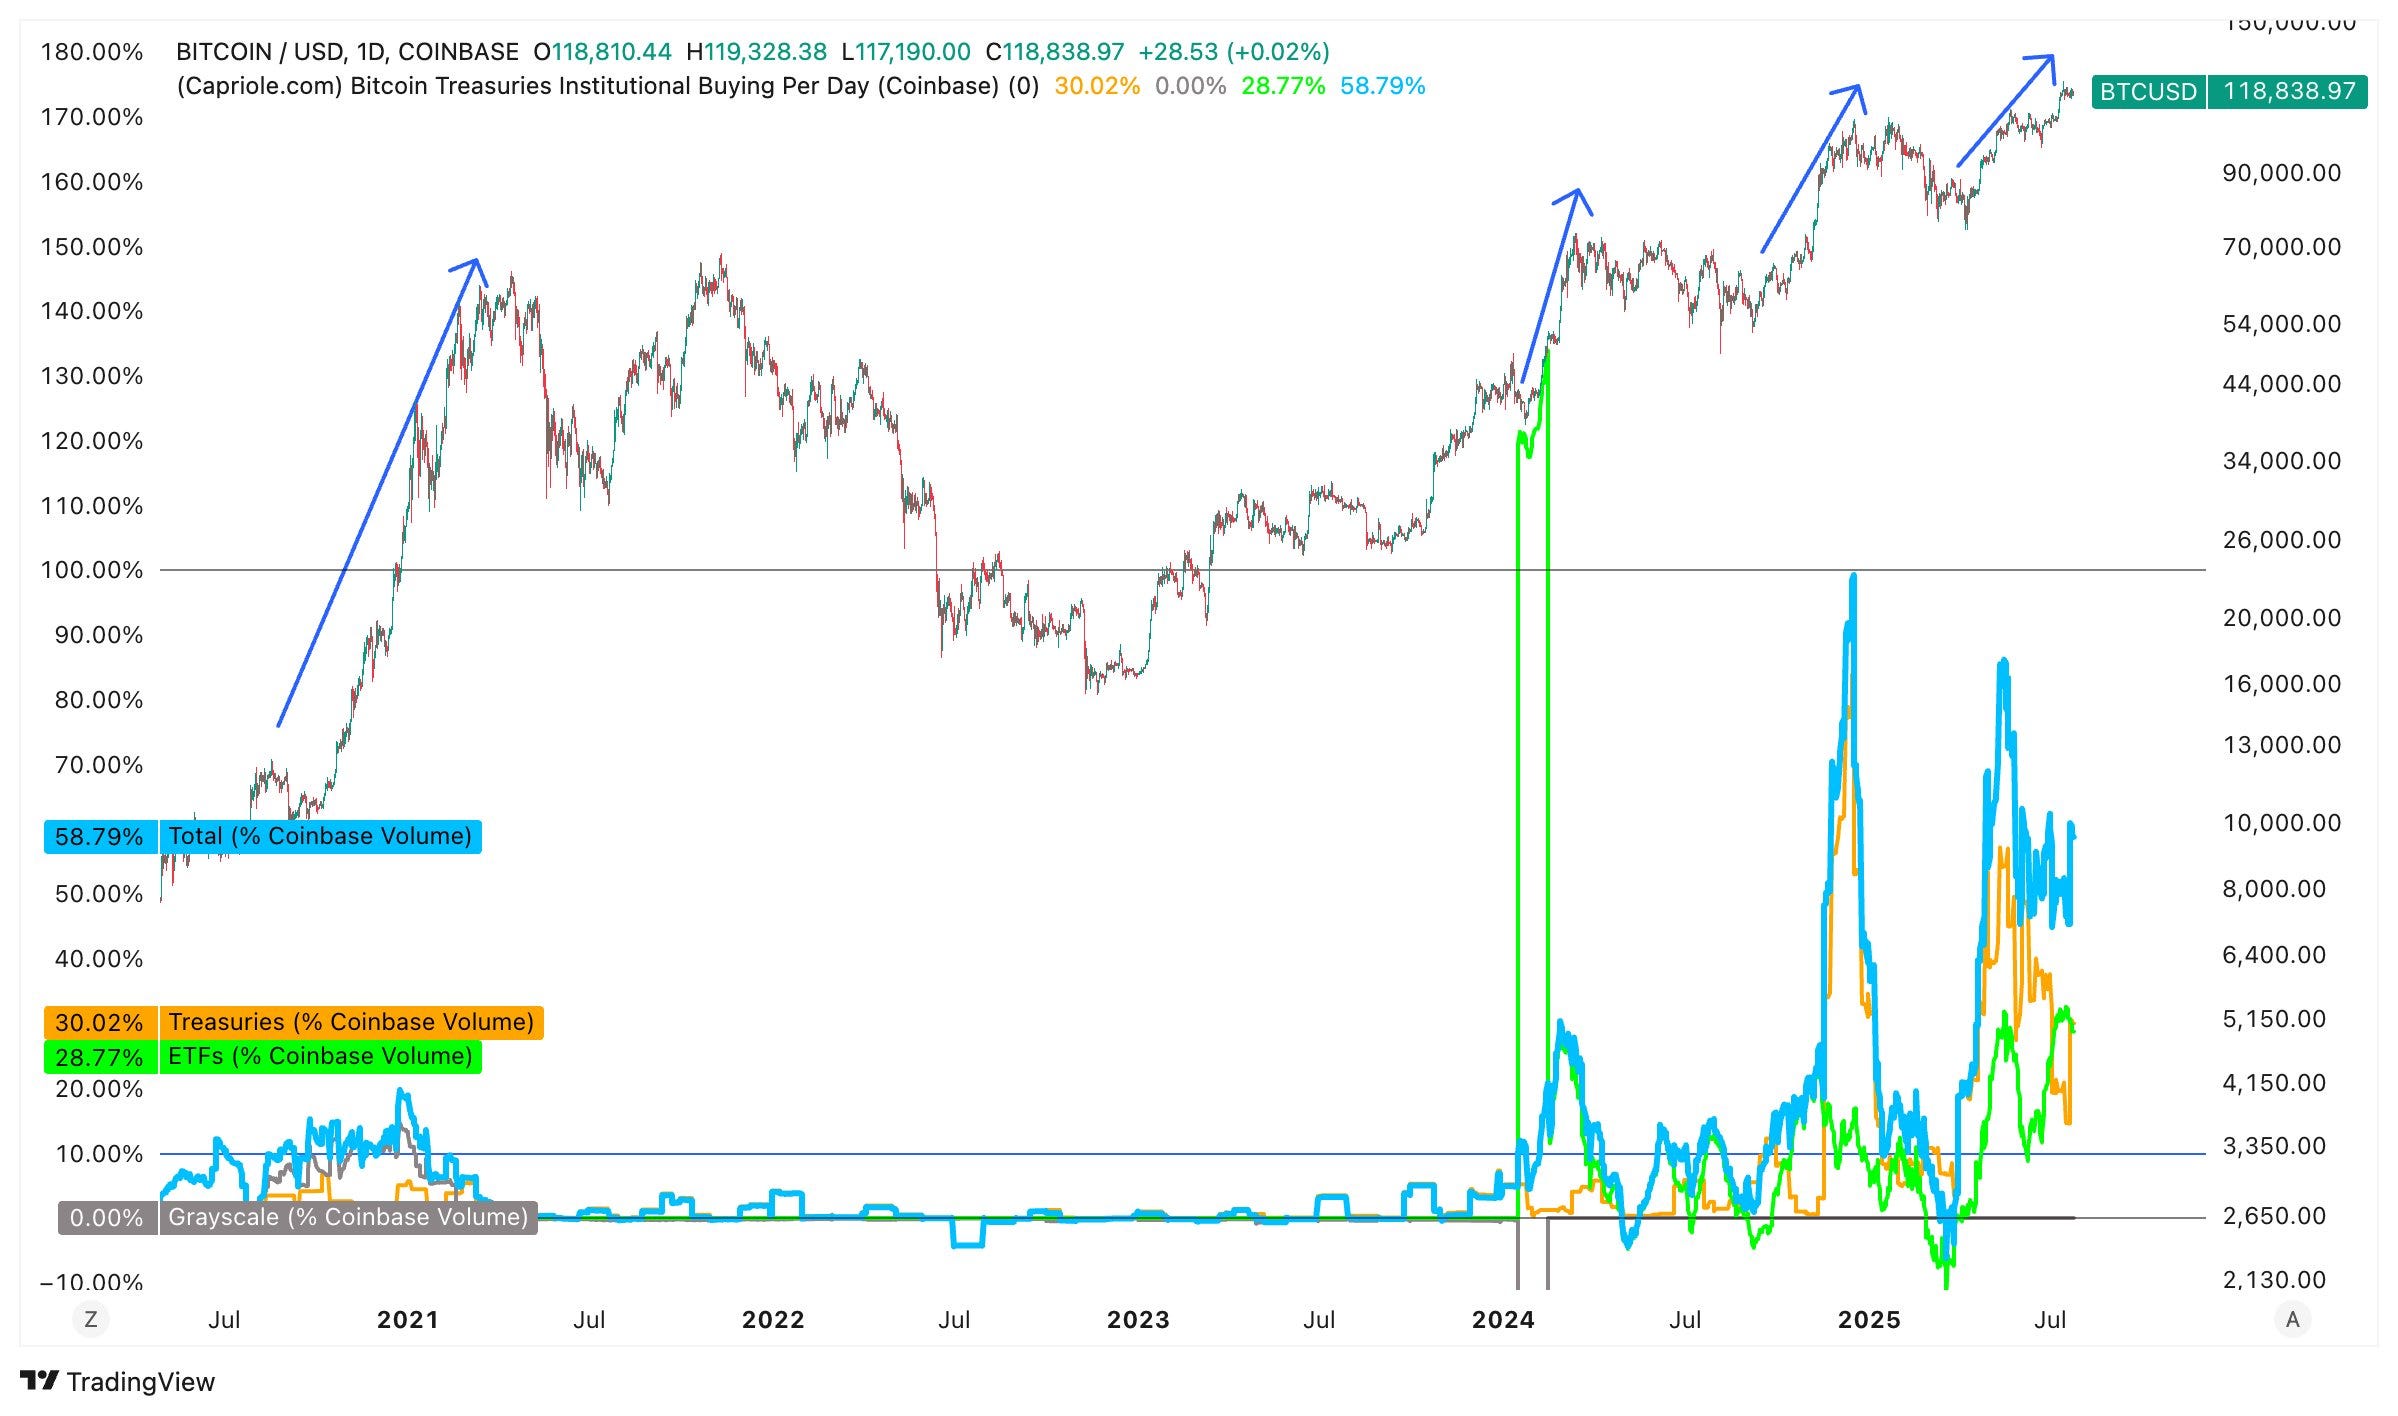
9/ Institutional Buying Per Day (Coinbase)
Finally, institutional buying as a percentage of Coinbase volume. When institutional buying represents a large portion of the average daily Coinbase volume (10-50%), unsurprisingly price has historically rocketed.
Conclusion
Looking across all 9 new Bitcoin Treasury Charts, it’s hard not be be bullish with the exponential growth in the number of treasury companies, the amount of Bitcoin they are buying and the frequency at which they are buying. It’s never been seen before in history.
Bitcoin is undergoing a demand shock. In the short term, the price of everything is set by supply and demand. As long as those conditions hold, the demand of these companies for Bitcoin is outstriping supply by 1000% every day.
There’s more… this represents Tranche 1 of our Bitcoin Treasury Company metrics. A suite of aggregate metrics that monitor every single publicly traded Bitcoin treasury company in real time. Over the next week Tranche 2 will deploy with granular company level analytics and metrics to assist in deep diving each stock.
Check it out: https://capriole.com/charts/?chart=btc-treasuries-total-companies