A Soft Landing
Welcome to Issue 29 of the Capriole Newsletter. We are quantitative investors in Bitcoin and digital assets. We deploy autonomous, risk-managed algorithms that trade 24/7 to outperform Bitcoin.
In our monthly newsletter we share important industry updates, explore major trends and review the technicals and fundamentals as they relate to Bitcoin. Our aim is to help dissect the noise, distill the most relevant data and help expand the field of digital asset analysis. You can read more about our open-source contributions here.
This newsletter explores a taboo topic. The idea of the impossible: a soft landing. How could the Federal Reserve possibly go from zero interest rates, high debt and full employment to 5% interest rates, crushed inflation and no recession?
For the last year, it felt like every pundit was claiming we were already in a recession. Yet to date, we have not seen a recession. There were definitely times in 2022 where the odds of a recession were high, but we never met the critical requirements.
You can’t be in a recession when unemployment is at generational lows, as is the case today.
Is it possible that we get through high inflation and drastic monetary policy change without a recession?
Like all forward looking predictions, it depends on your time frame. Sooner or later a recession will come. However, as of February, the odds of a recession have dropped substantially versus just months ago.
We know that Bitcoin and digital asset markets are becoming increasingly intertwined with traditional financial markets, so this issue we deep dive macro markets and assess the outlook and implications for risk assets over the coming months.
Let’s dive in.
The Headlines
Here’s the most important news in Bitcoin and crypto this month.
The Good
- Germany’s second largest bank, DZ, to offer crypto to institutional clients. More
- FTX debtors want political donations returned. More
- Bankrupt Genesis and parent DCG reach agreement with main creditors. More
- Binance introduces zk-SNARKs to improve its proof of reserves verification. More
- Paypal users hold over $600M in Bitcoin, Ethereum and other Digital assets. More
- Bitcoin Ordinals gain momentum with over 100,000 NFTs minted in February. More
- Self-hosted wallet ban avoided in new draft of EU’s anti-money laundering bill. More
- The Bank of England launches digital pound project as ‘new form’ of money. More
- Russia’s Sberbank to launch an Ethereum-based DeFi platform. More
The Bad and the Ugly
- Coinbase’s CEO cites rumors the SEC may ban crypto staking for retail. More
- Binance suspends US dollar deposits. More
- SEC to sue Paxos for listing Binance USD stablecoin. More
- LocalBitcoin, one of the oldest Bitcoin exchanges, to shut down. More
- Former chairman of South Korean crypto exchange Bithumb arrested. More
- Crypto firms banned from Super Bowl television ads this year. More
- Kraken to shut US crypto-staking service in SEC settlement. More
- Three Arrows Capital founders launch exchange. More
- SEC considers rules that could threaten crypto custody services. More
- Binance found to have secret access to Binance US bank account. More
- SEC poised to sue Terra and charges Do Kwon with fraud. More
- Robinhood subpoenaed by SEC over brokerage’s crypto business. More
The Fundamentals
A False Signal.
The economist behind the original Yield Curve prediction methodology, Campbell Harvey, recently suggested that the current Yield Curve inversion may be a false signal as far as recessionary risk goes.
(If you don’t know what the Yield curve is and why it matters for markets, take a moment to briefly read my write up on Medium here.)
Harvey stated:
“We’re in a period of slow growth, which is consistent with the model, but as far as recession, I’m skeptical of that. A hard landing is unlikely…the [yield curve inversion] is so well known now that it has impacted behavior [and that] makes the probability of a soft-landing more likely.”
Harvey’s reasons for why we may avoid a recession include:
- Inflation adjusted yields are positive, not inverted
- Labor market remains strong with fast re-hiring
- Strong consumers and financials
We broadly agree.
Yield Curves and the case for an S&P500 bottom being in.
Harvey’s first point is interesting. It arguably negates the majority of historic yield curve inversion data points for the last century.
There are just three other yield curve inversions in the last 50 years that also occurred during periods of relatively high inflation; 1978, 1980 and 1989. The maximum S&P500 downdraw within two years of these signals was just -21%, -27% and -20% respectively. The market today has already seen a -27% downdraw. Three data points is not enough to draw a conclusion from, but the fact the worst was in for all three of these cases should tell us to keep an open mind to a variety of outcomes, including the possibility that the worst might already be in for the stock market today.
Further, over the last 100 years, the average loss following a yield curve inversion signal was -11% and we are already well beyond that today.
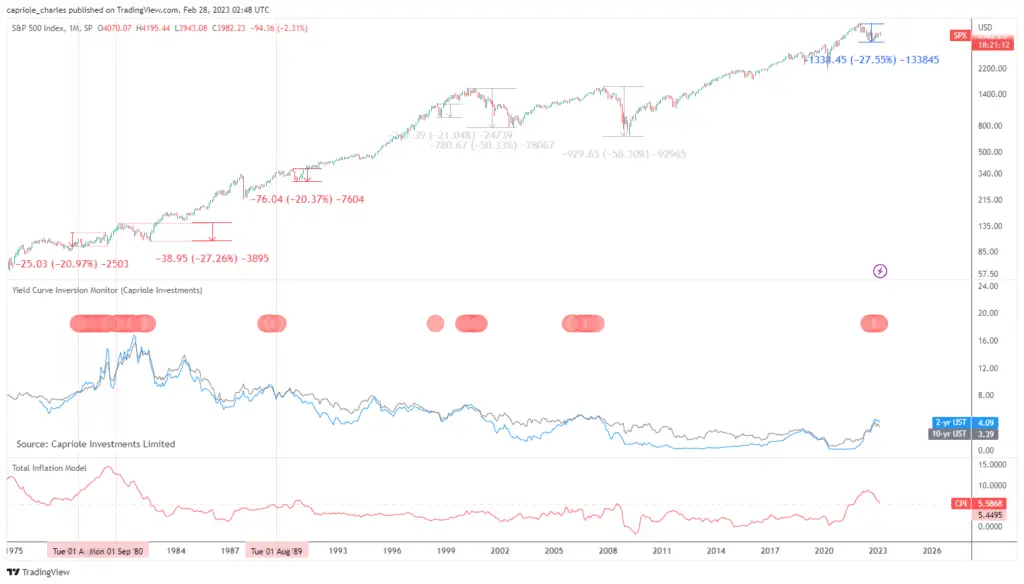
If you inflation adjust the US Treasury Yield Curves, they are not inverted. If we also look at the three times inflation was comparably high and the yield curve inverted (like today), the maximum S&P500 downdraw was less than we have seen today. Source: Capriole Investments
Employment is strong, but at the late end of the cycle.
On Harvey’s second point, employment rates today are still much too strong for the current environment to be considered recessionary. As the below chart of initial unemployment claims shows, we have not seen any uptick in unemployment that would typically precede a recessionary period.
That could still happen in the future, but it hasn’t happened yet.
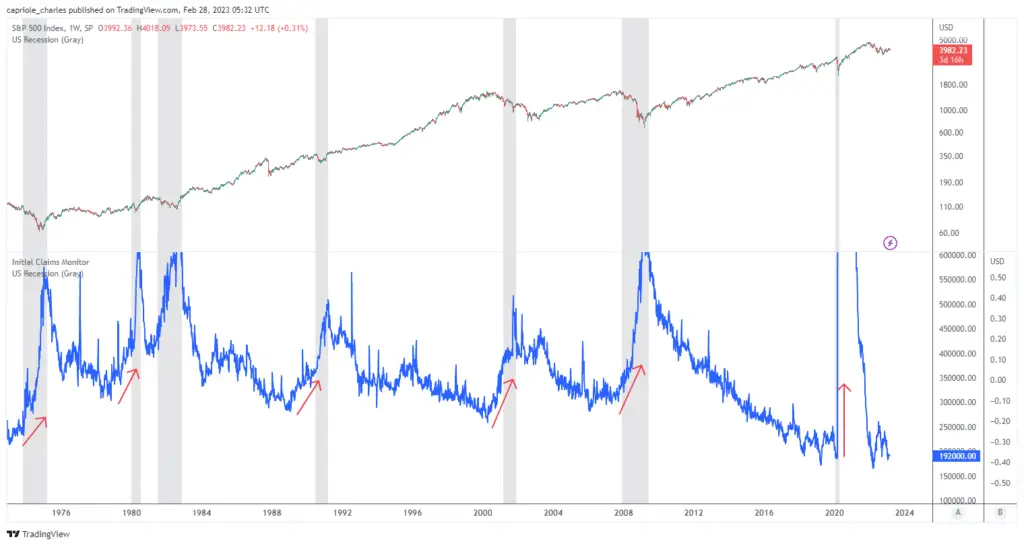
Jobless claims have broadly remained flat and at generational lows, suggesting the job market and employment is still very strong. So far we have no signs of rising unemployment which precede recessions. Source: Capriole Investments
Unemployment historically doesn’t get much better than this.
This suggests we are at the latter end of the business cycle. Ultra low unemployment paired with high interest rates increases the odds of an unemployment bottom being in (or forming). This means the market is more sensitive to unemployment rising from here. As business financing costs continue to increase, all else equal it makes it harder to invest in the same activities, growth and hiring.
In short: it’s important that economic growth (consumer strength, GDP, earnings, etc) continues to grow and support the rising costs of doing business.
Housing, the backbone of the American economy, is surging.
Harvey’s third point will be the deciding factor as to whether a soft landing can be achieved and if the equity market bottom is in.
Let’s deep dive into the current consumer and financial data to see how markets are placed.
Pending housing sales for January 2023 surged 8%, 800% higher than expected. While it remains to be seen if this trend shift will stick, if the consumer was weak, we wouldn’t be seeing numbers like this in housing. It’s hard to have a strong economy and consumers with a weak housing market, and the opposite also holds. Housing often leads the economy; it is a health check on consumer strength. We would expect to see new lows in housing sales and new housing starts as a sign of weakening consumers and financials.
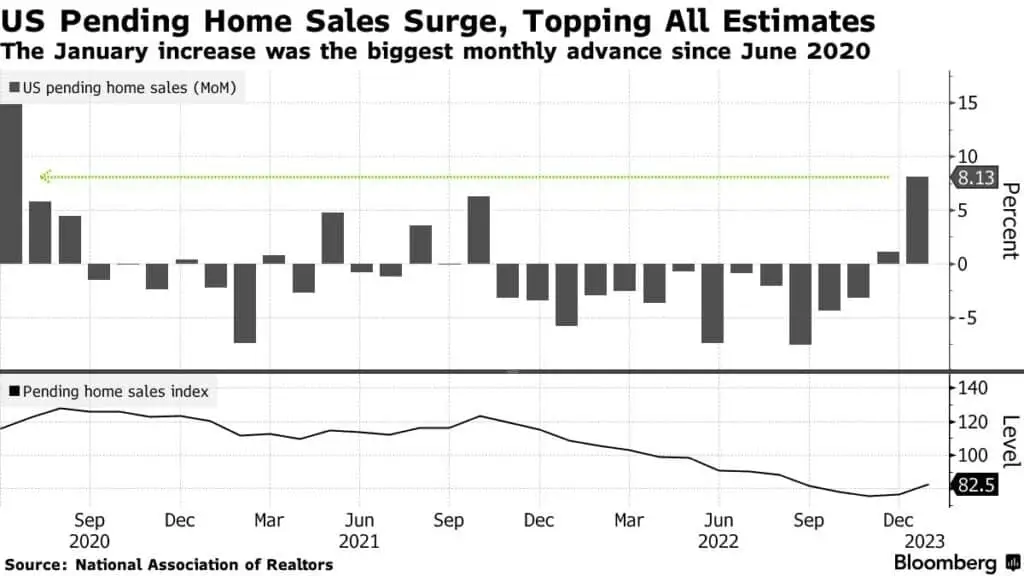
Housing demand shot through the roof in January despite the tight interest rate environment. Source: Bloomberg
Consumers are dominating the share of GDP growth.
GDP growth remained robust in Q4 2022 at 2.9%p.a. Consumers held up more than their normal share of GDP growth in Q4, demonstrating continued retail robustness.
It can take some time for tight economic conditions to flow through the economy. As a result, we want to see consumption based GDP remain at current levels and grow into the coming quarters to confirm that recent readings were not simply subject to the lagging effect of monetary policy changes.
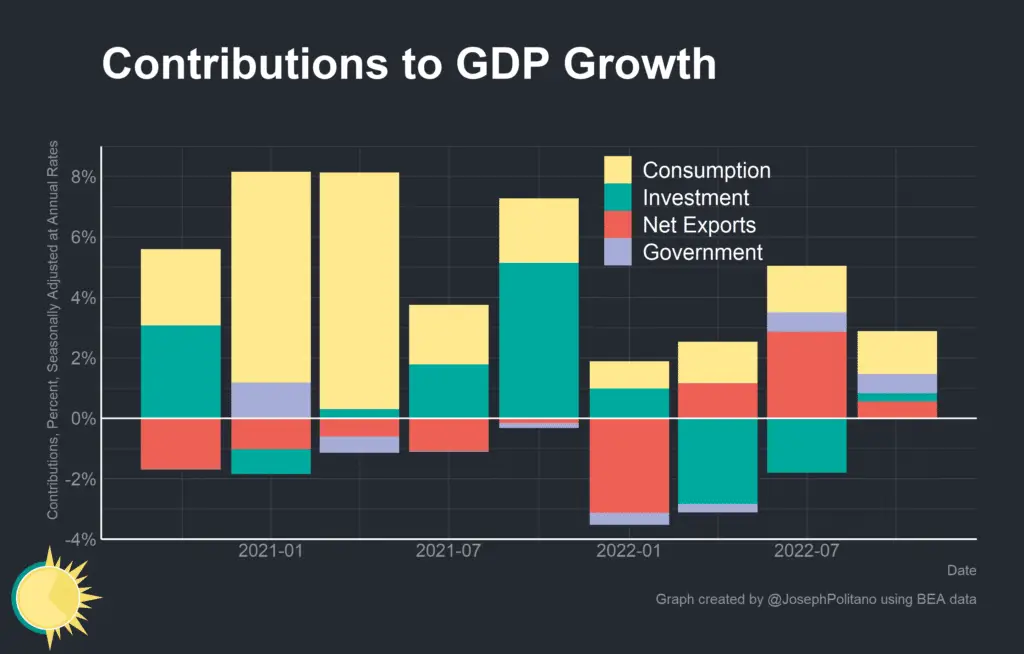
Q4 2022 GDP grew 2.9% annualized, above the 2.6% expectation, with consumers widening their share of the growth. Source: Joseph Politano
Weak manufacturing leads recessions.
Manufacturing is still showing weakness. This week, Liz Sonders noted the Dallas Fed Manufacturing Index fell down to -13.5 vs. -9.3 estimated. New orders fell further into contraction and manufacturing employment fell into contraction for the first time since June 2020.
ISM Manufacturing Index readings below 50 have a strong relationship with contracting economies. Today, the ISM index is in contraction at 47 which suggests some caution is warranted here. We won’t know we are out of the woods until manufacturing turns around with strength for consecutive months, and we have no signs of that yet.
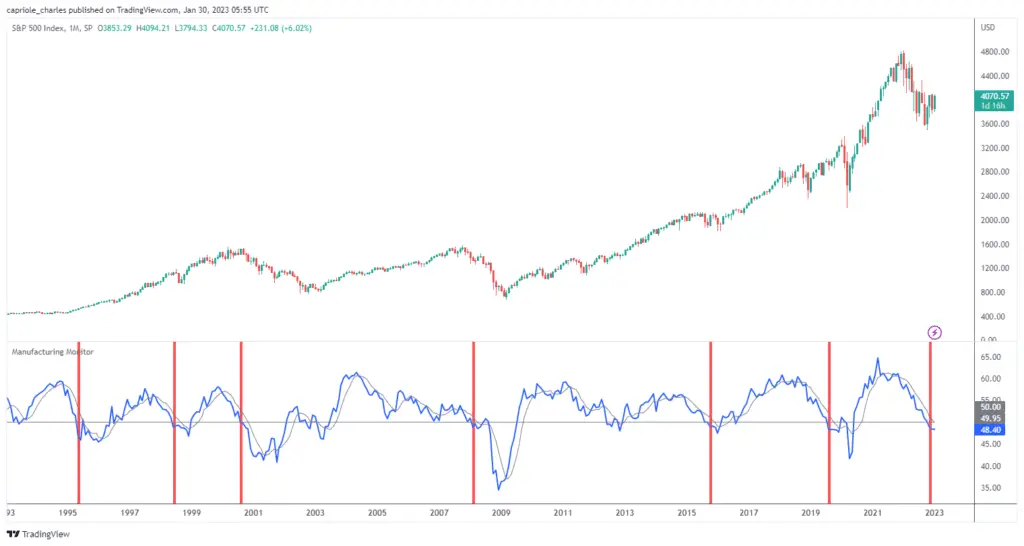
ISM Manufacturing has dropped into contraction, values below 50 are often a leading indicator of economic weakness and recessions. Source: Capriole Investments
Consumer Spending Bounces Back.
Strong consumers drive strong economies and strong markets. January saw a big bounce back in the ratio of consumer discretionaries versus consumer staples. However, February was more muted. We want to continue to see this chart trend up from here to prove the consumer is still strong and the economy has robust legs. Without a strong consumer, financials will decay, earnings will decay and unemployment will rise. It is important this chart sees strength over the coming months.
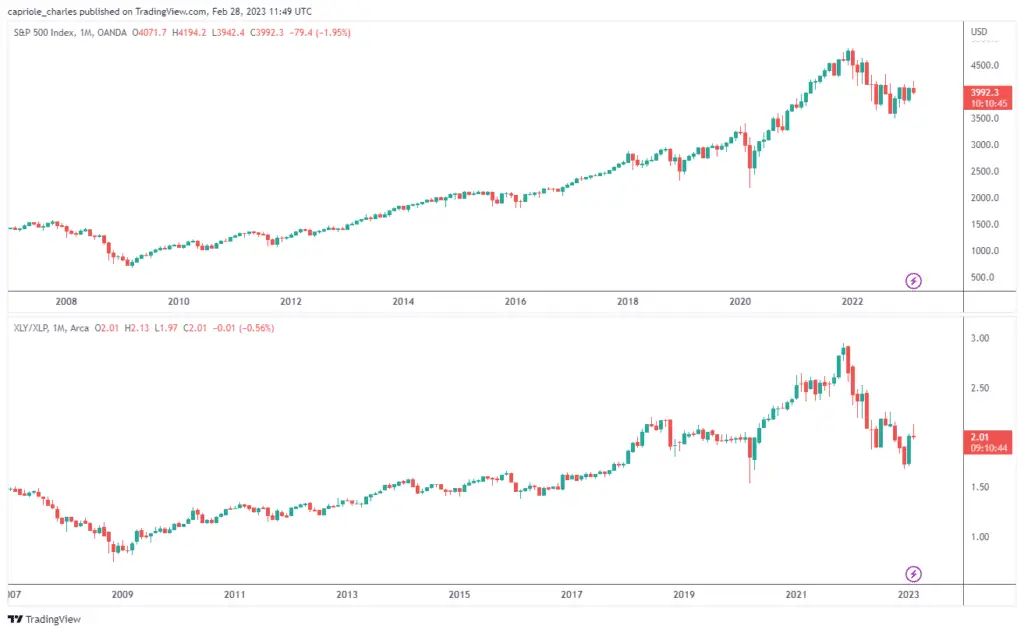
Consumer Discretionaries vs Staples showed great strength in early 2023. It is important this ratio continues to grow and provide evidence of a strong consumer which is necessary to support employment. Source: Capriole Investments
Is Inflation Back?
In the last weeks there has been a market wide pull back on renewed fears inflation may not be coming down as fast as expected which may require the Fed to remain tighter for longer. While we did see a CPI year-on-year reading higher than the market anticipated, let’s put it into perspective.
First, the inflation top of June 2022 is still in. Second, Inflation has only been on one pathway since then; straight down. A minor 0.2% deviation in expectations on a month-to-month basis is meaningless and will not impact policy. Until we see this chart plateau out, or increase, inflationary risk is overstated and the market so far has overreacted.
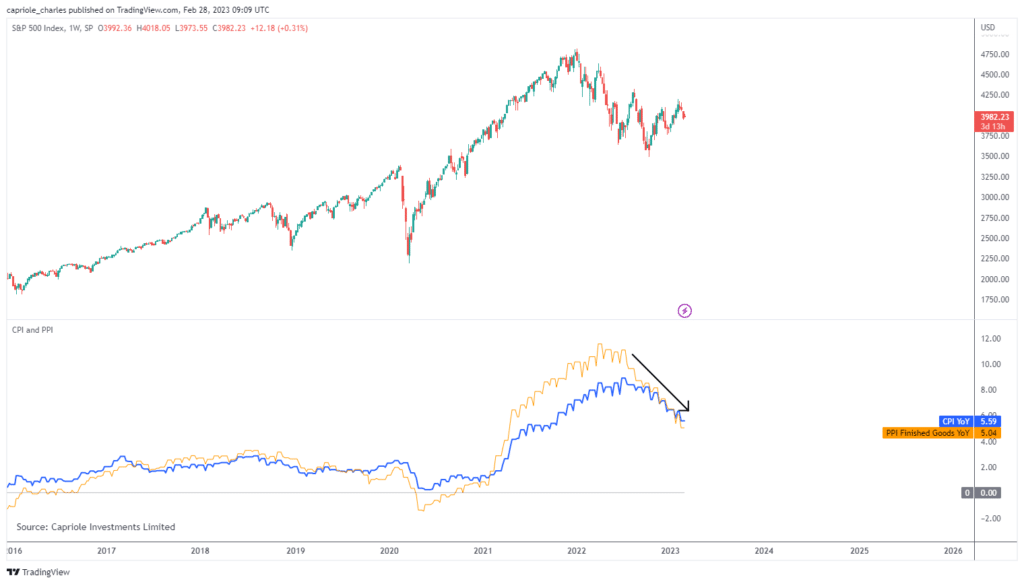
Inflation (CPI and PPI) has been on one trend for the last 8 months, straight down. Source: Capriole Investments
There are areas of the economy seeing an uptick in inflation, in particular the services industry has seen inflation hit 7.2% in February. These are important developments to monitor, but the aggregate figure is the most important.
Inflation versus the Federal Funds Rate (FFR).
Over the next 6 months it will be interesting to how the much anticipated inflation and Federal Funds Rate (FFR) crossover unfolds. With inflation around 5.6% and falling today, and the FFR at 4.75% and rising, the world is expecting (read: hoping) for inflation to cross under the FFR this year. However, as inflation approaches the terminal FFR (around 5% for 2023), interest rates put relatively less pressure on inflation as the delta between inflation and the FFR goes from positive to negative.
Will 5% interest rates be enough to continue to drive inflation down towards the Fed’s ideal 2% mark?
That remains to be seen. But the response of inflation within the 2-5% band will be the driving factor of Federal Reserve decision making and policy over the coming 12 months.
My expectation is that inflation will settle somewhere between 2% and 5% this year, but may re-surge again in the coming year(s) much like it did in the 1970s. This resurgence risk increases with time because the probability of unemployment rising also increases with time does – which typically requires stimulus to counteract. This tricky balancing act is one of the reasons why we think Bitcoin will perform much like Gold did in the 1970s, only better (read more in The Golden Gift).
The Technicals
A new trend has formed.
Whenever the S&P500 has spent as many days as it has today above the 200 day moving average (DMA200), the bear market bottom was (almost always) in. In the last 20 years, this scenario coming out of a bear market (where at least 80% of a 30 day period was spent below the DMA200) has occurred 12 times.
Looking one year out from these events, the average S&P500 return was 11.7%, with only one occurrence finishing down (-4%).
In other words, once the market has spent measurable time above the DMA200; it rarely looks back. This signal also identified and confirmed the bottom being in for the 2000 and 2008 financial crises.
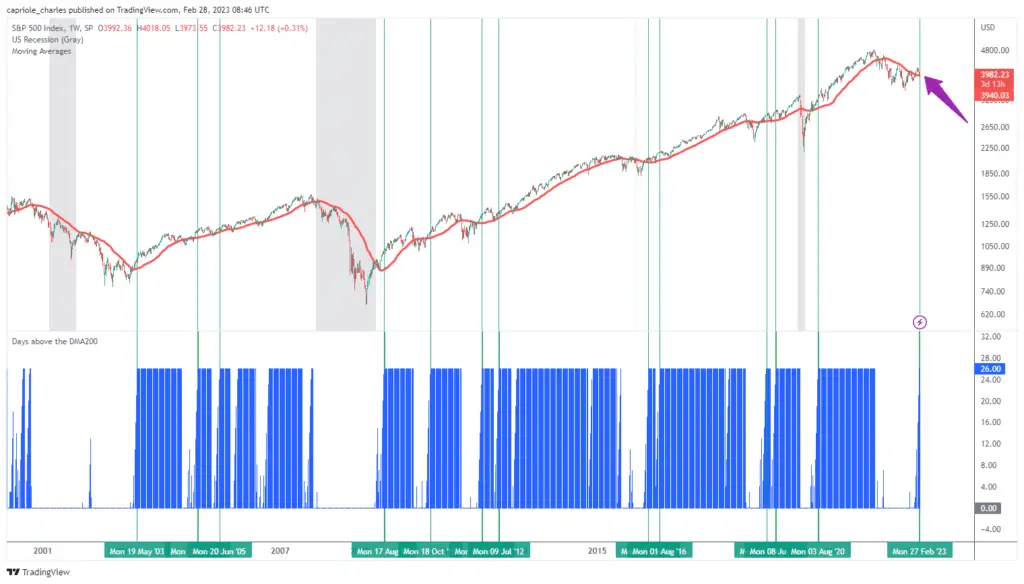
In the last 20 years, 92% of the occurrences (shown in green here) where the S&P500 spent 3+ weeks above the DMA200, it ended up 11.7% higher one year later. Source: Capriole Investments
A rare bullish breadth thrust signal.
Since 1980, Chris Ciovacco’s NYSE Breadth Momentum Oscillator has only moved from a rare oversold condition to a rare overbought condition four times previous times. All four signals marked major S&P500 lows, with the minimum 12 month return being 12.4% and the average 12 month return being 27.3%. While this is just four data points, we have found similar results in other price action signals which see two major swings from low-to-high or high-to-low. It tends to be the second signal that generates a higher probability trend (as we wrote about in our January issue, “trust the second move”).
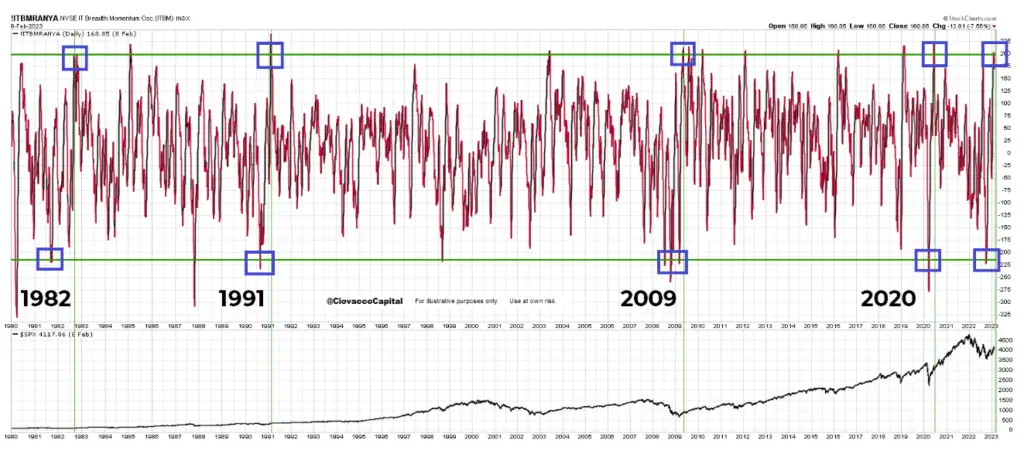
NYSE Breadth Momentum Oscillator has fired a rare sequence of oversold-to-overbought signal which historically has only seen stock market appreciation. Source: Chris Ciovacco.
High Yield bonds Versus Treasuries poised to break out?
The ratio of High Yield Bonds to US Treasuries provides a good reading on how willing the market is to take risk. Periods of growth in this ratio align with prosperous, relatively smooth sailing times for equities as shown in the below chart. From a technical perspective, this ratio has been under stress for the last year, but is grinding up in typical pre-breakout fashion. Should we see this ratio press higher over the next 1-2 months, it would be a very good sign that a new bullish trend in risk-assets has formed and a strong confirmation signal that the bottom is indeed in.
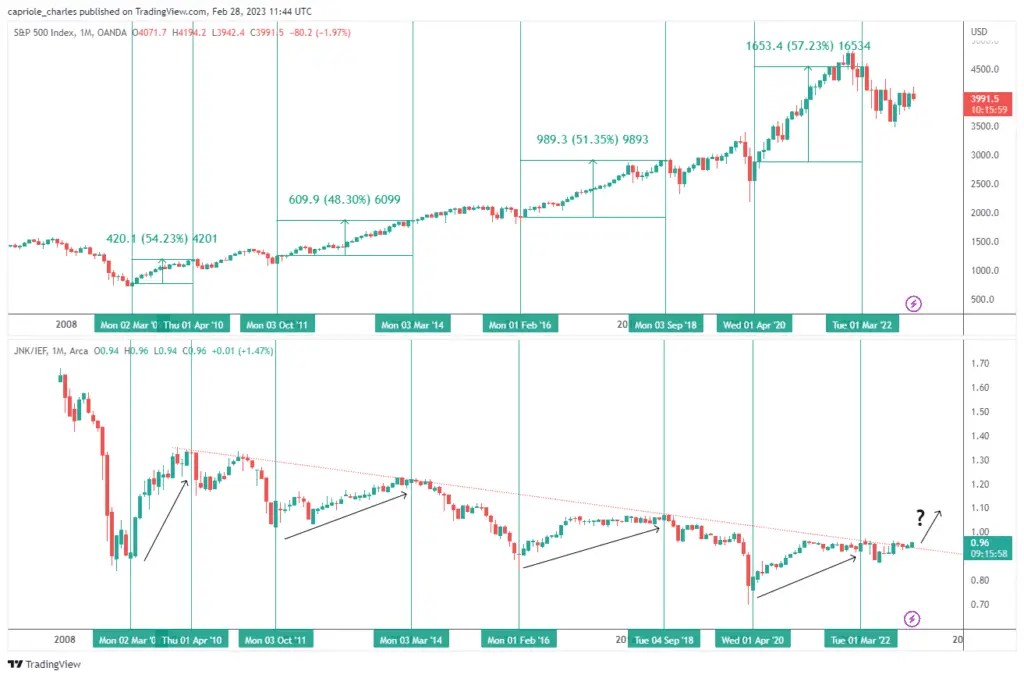
The ratio of High Yield Bonds to Treasuries suggests a potential breakout could provide an optimal risk market environment. Source: Capriole Investments
Higher chance of local volatility.
While the above technicals present good 12-24 month outlooks, they don’t help us in the near-term. In fact they can represent an overbought market locally. Currently the VIX volatility index is very low, and the Put/Call ratio recently also hit a low. This suggests the market got a bit ahead of itself and positioned overly bullish in the last weeks. All of this is to say we can expect near-term volatility in risk asset pricing (Bitcoin included) as the market normalizes.
Buying support and selling resistance.
From a pure price action perspective, the S&P500 is currently testing support levels and the DMA200. Ignoring all other data; 3900 is a buy zone because of this. However, if we start to spend meaningful time below 3900, this chart would start to look like support-flipped-resistance. It would Invalidate the new DMA200 trend point noted above, it would likely sync with a worsening of the High Yield to Treasuries ratio , and generally make the early 2023 breakout look like a dead-cat-bounce.
In short: the current zone is a technical buy region, but if we spend time lower, the picture quickly changes.
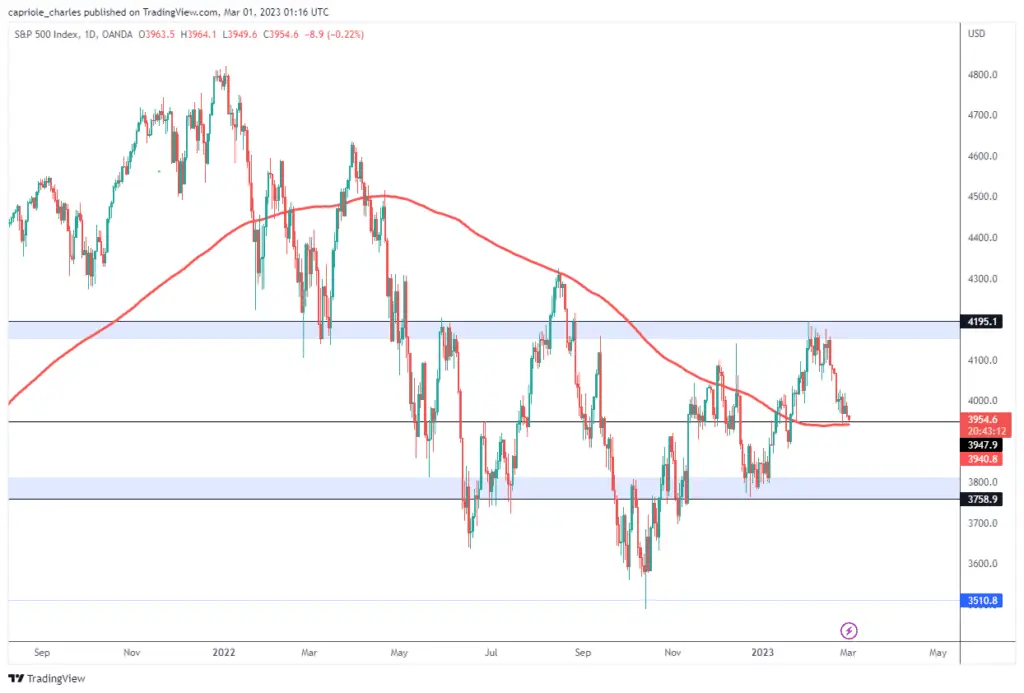
The S&P500 is trading at support (horizontal order blocks and the DMA200 shown). Source: Capriole Investments
Bitcoin
This issue focused on the macroeconomic environment to help paint a picture of where risk stands for the coming months. Our overall views on Bitcoin today are much the same as last month. January signified a major turning point, the start of a new regime. We analyzed what that means in depth in “The New Regime”, but also noted that decent volatility could be expected locally. After a very choppy, flat month of February for Bitcoin, that view remains for March with increasing probability of resuming the upward trend as time goes by and price holds above $21K.
Bitcoin Fundamentals
We believe the full picture of Bitcoin’s fundamentals is best consolidated and viewed through the Bitcoin Macro Index. The Bitcoin Macro Index (BMI) is Capriole’s autonomous fundamentals-only trading strategy which uses machine learning to assess and learn on over 35 Bitcoin on-chain and equity market metrics.
The BMI today is in a risk-off, cash position, after having been long from the $16K bottom.
Bitcoin today remains undervalued, but is no longer trading in the deep value we saw in 2022.
Bitcoin fundamentals are still undervalued. Source: Capriole Investments
The Bitcoin Macro Index (BMI) Oscillator. Source: Capriole Investments
The Bottom-Line
The economy today is healthier than many would have you think. But there is no doubt risk in the market. At some point in the coming year(s), unemployment will form a new trend and that trend can only be up. Manufacturing is also suggesting weakening economic conditions today, but alone this is not enough to call a high risk scenario. The recent burst of market-wide inflationary fear was also overcooked.
Looking at the aggregate economic picture with the Recessionary Watch, economic risk and the chance of a recession has steadily declined over the last three months as housing, employment, initial claims, consumer spending and GDP remain robust. This puts the probability of recession in the next 12 months at just 20% (verses 40+% in December).
As always, you never have 100% confluence in markets, but the weight of the evidence today is clear.
The macroeconomic fundamentals and technicals are skewed bullishly and paint a picture for a promising 2023.
Current conditions are supportive of risk markets and our January Bitcoin outlook. Provided broad strength in employment, housing and consumption remain, the current macro conditions are optimal for Bitcoin to continue to grow organically and trend into the 2024 halving.
The new trends we have seen form in both equities and Bitcoin hinge on continued strength in near-term fundamentals and technicals. We are currently trading near significant support levels for both markets, which provide great long-term odds. However, that picture can change quickly near inflection points. It is important to monitor this data day-to-day (or systematically as Capriole does).
In sum, it’s a green light for risk assets.

Charles Edwards
Founder
Capriole Investments Limited
February Content Highlights
- Interview with Coin Telegraph covering the new regime, the importance of the $20K breakout, exchange risk, regulatory risk and things to look out for in 2023.
- A framework for navigating risk in Bitcoin Bull Markets and Bear Markets. This new article itemizes over 50 common characteristics and traits to look out for in Bitcoin and digital asset markets and how they can be used to manage risk.


