Institutional Accumulation
Fear struck the market again with a blunt Fed speech in August. The broader Bitcoin fundamental picture remains in a consistent value region and we can see potential signs of oversold technicals. The promising buds of a local-minima in risk asset pricing.
A quick look at this month’s news headlines also paints a clear picture. Financial stress continues, there is blood on the street. However, those with deep wallets continue to allocate into crypto more aggressively than ever before. August saw the biggest fund launch ever in crypto history. Although retail interest is dead (see SLRV Ribbons below), institutions are aggressively allocating into the current value region of the fastest growing asset class in the world.
Those familiar with the Wyckoff methodology know that it is typically institutions that put the price floor in during asset accumulation zones. The floor may take some time to develop. Nonetheless, it is much more valuable to watch where institutions put their money, as opposed to what people are saying. The money is talking.
Institutions are feasting.
The Headlines
The most important news in Bitcoin and crypto markets this month:
The Good
- Ethereum confirms September for its most important event ever, the Merge (source)
- Tether releases independent auditor report from top 5 accounting firm (source)
- Federal Reserve opens up master account access to crypto banks (source)
- The EU is on the verge of creating a new AML regulator to oversee crypto (source)
- BlackRock to offer institutional clients crypto through Coinbase deal (source)
- Brazil’s largest bank, BTG Pactual, launches crypto trading platform (source)
- Samsung to launch crypto exchange in 2023 (source)
- Meta announces integration of NFTs into Facebook and Instagram (source)
- Derivatives marketplace CME launches Euro-denominated crypto futures (source)
- Brevan Howard raises over $1B for biggest ever crypto hedge fund launch (source)
- Genesis and Galaxy are raising a $500M crypto fund (source)
- CoinFund launches $300M web3 fund (source)
- Arnault-backed VC firm Aglaé Ventures to launch €100M web3 fund (source)
The Bad and the Ugly
- Crypto.com ditches $495M sponsorship deal with Champions League (source)
- Hodlnaut reports $193M financial shortfall as it seeks court protection (source)
- Crypto exchange Hotbit suspends trading and withdrawals (source)
- Crypto exchange Nuri, previously called Bitwala, files for insolvency (source)
- Crypto exchange ZB.com loses $4.8M after halting client withdrawals (source)
- DC sues Michael Saylor and MicroStrategy for tax evasion (source)
- FDIC issues cease-and-desist letters to FTX for false and misleading claims (source)
- SEC sues Dragonchain for unregistered crypto asset security offering (source)
- Singapore to tighten retail access to cryptocurrencies (source)
- US Treasury sanctions Tornado Cash (source)
- Netherlands arrests Tornado Cash developer (source)
Invest in the Capriole Fund
The Capriole Fund is fielding accredited U.S. investors.
We accept new investors once a month.
Find out more.
Macro Market Aerial 🟢
The Fed stepped down hard on the rhetoric this month. Powell communicated to the market that the current tightening regime is far from over. The market impact was sharp and sudden. Much of the S&Ps recent 20% rally has now fading away. The Fed has set the tone that inflation control takes time, multiple months of improved CPI readings are required before a shift from a hawkish to a dovish tone can be expected.
In the last week, we have had some macro fundamental data releases that may give the Fed more ammunition for this cause in the near-term:
- The PMI manufacturing reading came in stronger than expected – suggesting that the economy is in a slightly better position than the market anticipated
- The CPI inflation reading this week was higher than forecast – justifying the Fed’s tough stance and rate hikes
- If unemployment data released today is aligned with expectations today it would suggest the Fed’s tough stance has arguably not yet negatively impacted the workforce
The above data points justify continued tightening. Continued tightening favors “risk-free” assets (bonds, cash) and increases the cost of owning risk assets (stocks, real-estate, crypto).
This points to the fact we still have some way to go before a monetary policy regime change occurs, which means risk assets have continued head-winds in the near-term. This does not mean that the market needs to go lower, it just reinforces the current conditions. The market is a forward looking discounting machine.
The best forecast for expected Fed action may be the 10-year Treasury yields. While the 10-year has been maintaining relatively high levels (currently 3.26%), it has not yet broken the decade-long high of 3.48% set 7 weeks ago. All of this data can change quickly, but for now the market is not anticipating worse conditions than 2 months ago.
At the same time we have some technical signals suggesting the current downtrend is oversold in the near-term. This week a perfect TD9 formed on the S&P500 and a rare TD9 sell signal occurred on the VIX volatility index, suggesting near-term volatility may be capped.
On balance, the fundamental picture remains fairly consistent this month, but the technicals suggest we are due for a local rally.
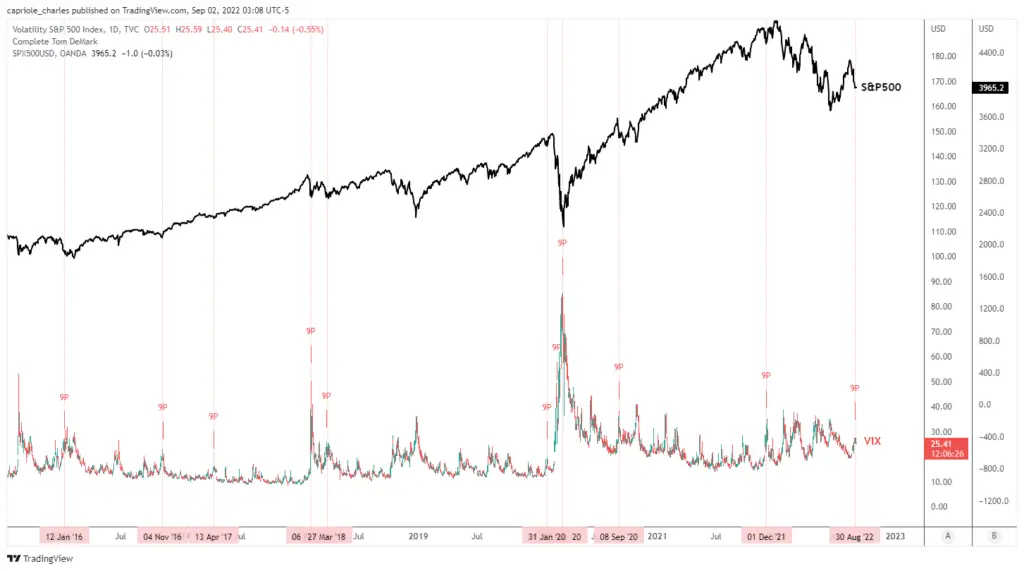
TD9s on the VIX suggest volatility may be capping out. This signal has a great track-record of identifying local price bottoms on the S&P500. Source: TradingView
Fundamentals 🟠
The Bitcoin Macro Index, Capriole’s autonomous fundamentals-only trading strategy which assesses and learns on 35+ Bitcoin on-chain and equity market metrics, pivoted to Contraction last week at around $21,500. Locally this was a bearish sign, Bitcoin dropped to 19.5K yesterday.
Yes – the Macro Index also considers Hash Ribbons too. Nonetheless, the magnitude of the Macro Index reading still remains very much in a long-term value zone we have been discussing the last months.
This quarter is a trifecta for Bitcoin. We have:
- 90% of normal cycle downdraws
- On-chain fundamentals at deep value 1-in-4 year levels, and
- Timing on our side – we are between years 2 and 3 in the Bitcoin four year halving cycle. This 12 month window was historically the best time to allocate into Bitcoin.
Macro Contraction. Bitcoin fundamentals are trending negatively in a region of value. Source: Capriole Investments
The Macro Index Oscillator. Source: Capriole Investments
Hash Ribbons 🟢
The biggest news of the month was Hash Ribbons Buy Signal almost two weeks ago.
If you don’t already know, Hash Ribbons signals the end of major Bitcoin miner capitulations, as identified by macro changes in Hash Rate (you can read more here). Historically, it has also been perhaps the best long-term buy signal for Bitcoin. Its live track record speaks for itself.
Additionally, the signal that occurred in August also happens to be in the second half of the current Bitcoin Halving Cycle. Late cycle Hash Ribbons signals were historically the most performant, making this signal as good as it gets for Hash Ribbons. In other words, all else equal, this signal suggests it is the best time possible to allocate into Bitcoin.
Nonetheless, there are three major considerations with this signal:
- Bitcoin miner influence is reducing with time
- Bitcoin is “growing up” and is increasingly tied to global macro markets in 2022
- Hash Ribbons is just one metric. Good investment decisions should consider the confluence of multiple signals and data points.
Hash Ribbons is resulting in a net-long position to Bitcoin for us today, but overall allocation is being somewhat dampened by a wider array of data included in strategies like the Macro Index above. Remember: Hash Ribbons is a tool (a powerful one) in a larger toolkit.
As of writing, the current Hash Ribbon signal has experienced a maximum down draw of -6.25%; which is within normal expected bounds for a Hash Ribbon signal.
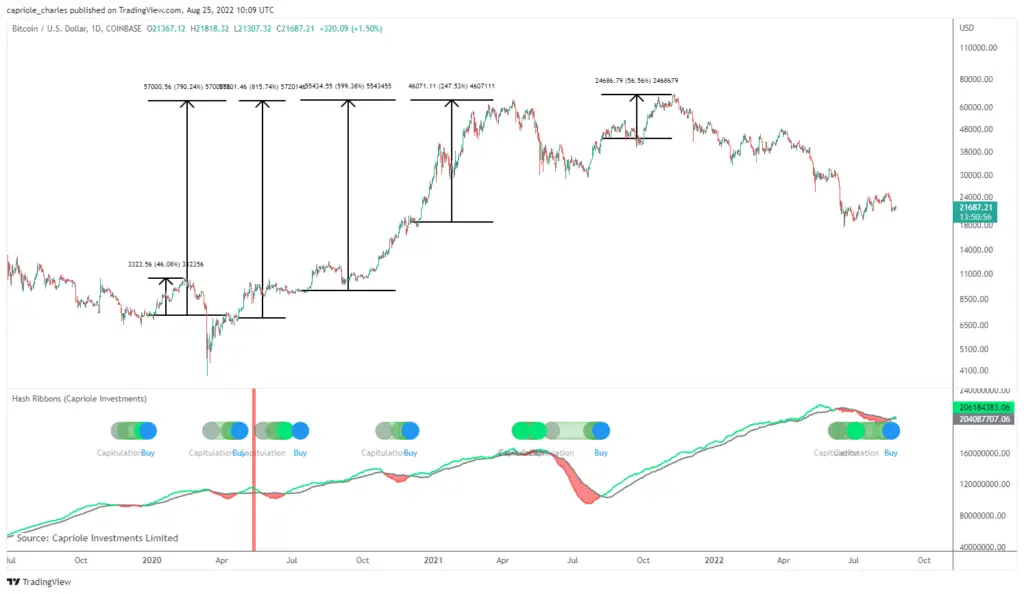
All of the live Hash Ribbon Buy signals since we published the Hash Ribbons strategy in 2019. Hash Ribbons provides buy signals only, pick your exit point accordingly. Source: Capriole Investments
Whale Unloading 🔴
The oldest whales of them all, the Bitcoin “OGs” that have held Bitcoin for more than seven years, have a good track record of selling into price strength and generally de-risking before major downside.
While this data set is extremely limited and should be taken with a grain of salt; it is worth considering that these investors have held Bitcoin for so long that they have witnessed the worst there is to witness in Bitcoin’s history. These OG whales have seen massive exchange collapses, fork wars, 100s of calls that “Bitcoin is dead”, multiple 80%+ downdraws, multi-billion dollar hacks and more. The fortitude necessary to hold Bitcoin in one place through such a tumultuous history shouldn’t be underestimated.
This week, over 5000 Bitcoin were moved by such a holder. That’s around $100M of savings. We can’t say for certain what that movement implies; but similar sized moves in the past have often not been good for future Bitcoin price action.
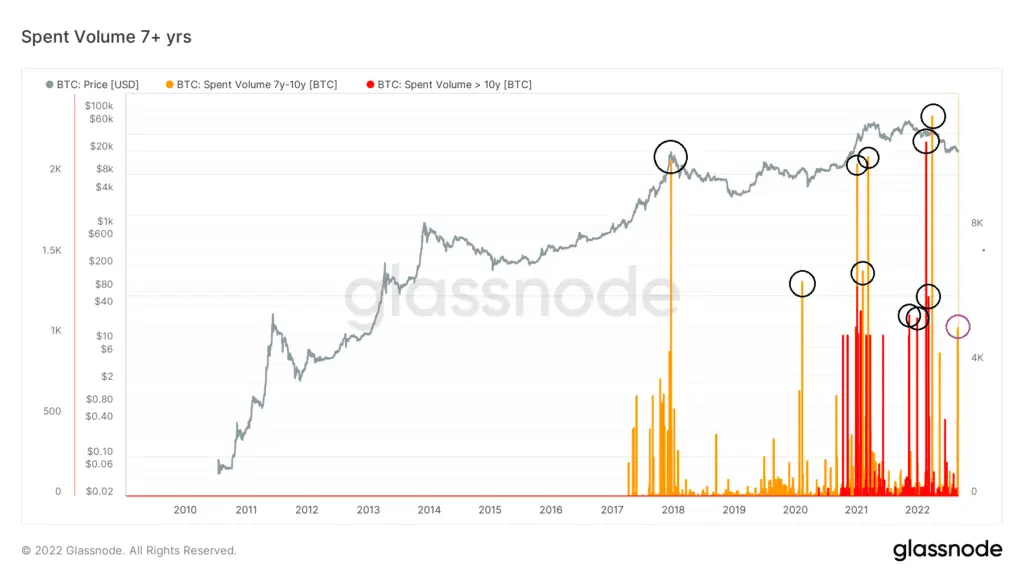
Spent Volume 7+ years tracks when experienced Bitcoin holders move their long-term holdings, often before downside price movements. Source: Glassnode
NEW METRIC: SLRV Ribbons 🟠
A new metric we would like to introduce is the SLRV Ribbons. This is simply the 30- and 150- day moving average of the Short- to Long-Term Realized Value (SLRV) Ratio.
David Puell’s SLRV Ratio shows the percentage of Bitcoin in existence that was last moved within 24 hours, divided by the percentage that was last moved between 6-12 months ago.
When the ratio is high, it suggests there is a lot of short-term transactional activity versus long-term holding. This can be indicative of relative hype/adoption in the near-term. Conversely, when the ratio is low it suggests there is little short-term activity and interest in Bitcoin and/or a growing base of larger than normal longer-term holders.
Applying these ribbons to SLRV allows us to easily identify positive and negative trends which have also historically identified good times for risk-on and risk-off allocation to Bitcoin accordingly. While the current trend is bearish today, SLRV has hit a low of 0.025. This is a reading historically associated with the long-term bottoming phase of the bear market.
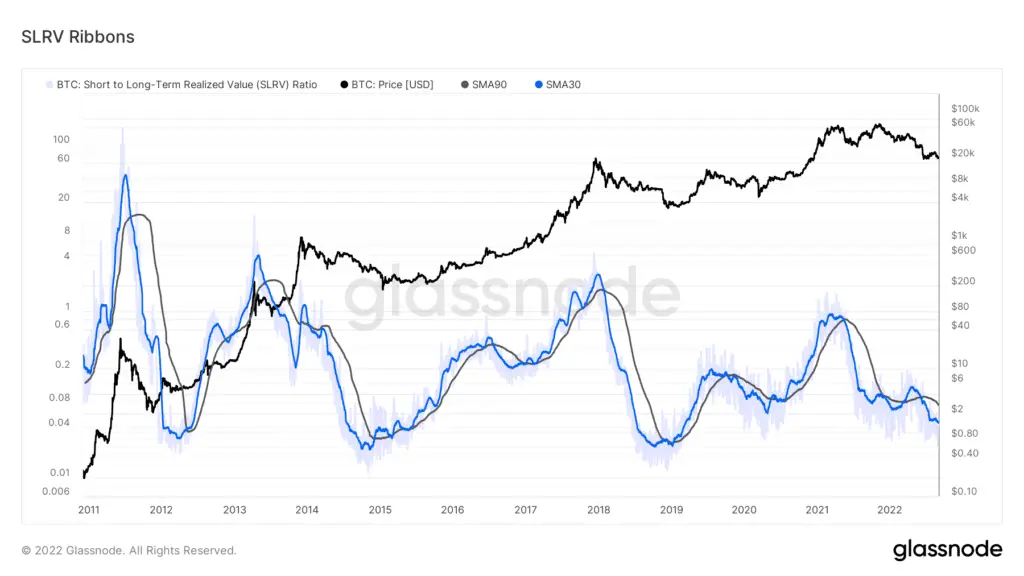
SLRV Ribbons help to identify long and short/cash regions using onchain sentiment. Source: Capriole Investments / Glassnode
The Technicals 🟢
As far as support levels go, it doesn’t get more important than $20K. The $20K handle (read $19.5-$20K) represents the prior cycle all time high, a major weekly order block, the last significant volume profile node until $14K and the 1.618 fibonacci extension level for the 2019/2020 highs and lows. It’s big.
If we just consider price technicals alone, this makes $20K a no-brainer long trade. However, support levels are most effective the less they have been tested. We have now spent the better part of the last 3 months hanging around $20K. On the daily timeframe, $20K has been retested 4 times now. We still think $20K is a valid support level, but the odds of it breaking down increase with each retest. Support levels should rarely be trusted on the 5th plus attempt.
In other words; $20K is support, but it is not as strong as it was in June/July.
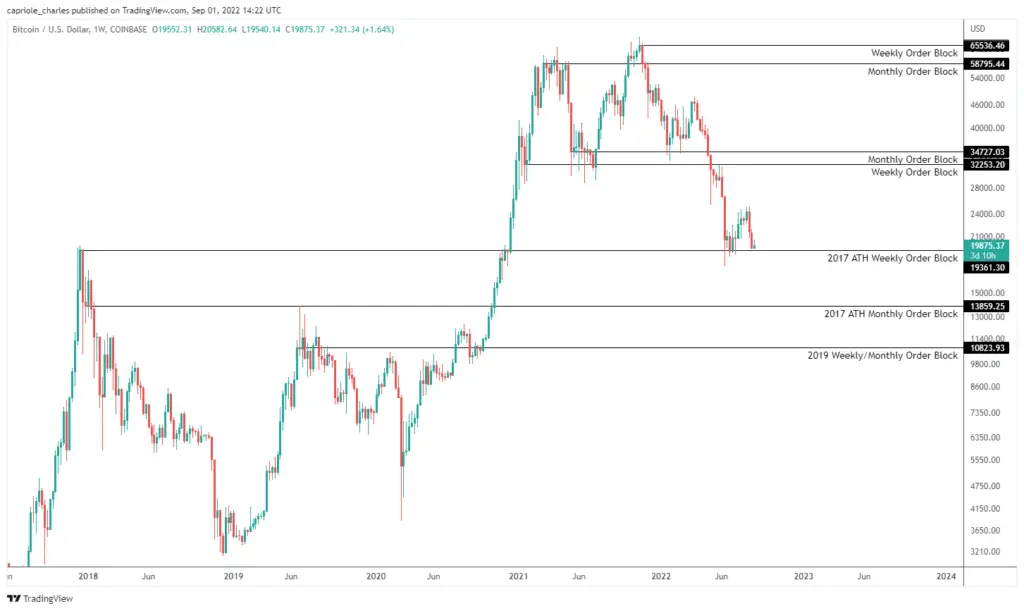
Bitcoin is trading at the most important support level on the chart. Source: TradingView
The Bottom-Line
The market over-reacted to the downside of the Fed’s last meeting, which essentially just reinforced the current rhetoric. Technicals across both equities and crypto suggest we are oversold and at key support levels. In the near term this is bullish. Fundamentals and on-chain readings remain in value regions. However, the fundamental picture is less clear locally. We have some super strong buy signals (like Hash Ribbons); but we also have an array of metrics which are locally less attractive (such as SLRV Ribbons).
A big consideration on the fundamentals side is that we have just closed out the month of August – the biggest summer holiday month for the Northern Hemisphere. The Northern Hemisphere is the wealthiest half of the globe, capturing the US, EU and much of Asia. This means we can expect less financial activity in August as people lie on the beach working on their tan. Reduced financial activity would correspondingly weaken fundamental data, so it would not be surprising to see financial activity (and fundamentals) improve in the coming months.
Summarizing: the short-term (<1 week) technicals are well positioned for an attractive risk-reward long with a well defined risk management process. Mid-term (1-4 week) the outlook is mixed. Long-term the picture is much the same as the last 2 months – we are seeing incredible opportunities to allocate to the fastest growing market in the world and we expect these conditions to hold for the coming months. It is for these reasons that Capriole Investments continues to allocate into our quant crypto fund each month. We have increased our position in the Capriole Fund by over 120% in the last three months alone, and expect to continue to do so.
Invest in the Capriole Fund
The Capriole Fund is fielding accredited U.S. investors.
We welcome new investors once a month.
Find out more.
Content We Love
- Hash Ribbons explained on CNBC
- How legacy finance perceives Bitcoin, the good and the bad


