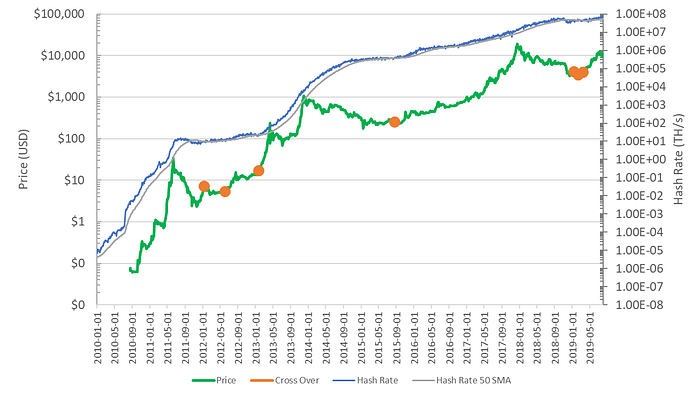
Identifying Bitcoin Bottoms with the Bitcoin ‘Hash Rate Capitulation’.
Bitcoin miners keep the network alive. Miners ensure the validation of transactions and network security via sheer computational power. When the total Bitcoin hash rate goes down, it shows that miners are leaving Bitcoin. History has shown that Bitcoin miners are very resilient. It takes drastic and prolonged negative price movements for miners to stop mining Bitcoin en masse, and the worst is typically over when they start to re-commit computer power back into mining Bitcoin. As a result, the Bitcoin hash rate is a useful metric to identify market bottoms and time Bitcoin buying entries.
The Link between Price and Hash Rates
Miners give up on Bitcoin when they have decided they can utilize their computational power elsewhere to yield a better rate of return. This happens for one of two reasons: a falling Bitcoin price or increasing running costs (namely electricity).
Because of this, the Bitcoin price and hash rate are intrinsically linked. Over Bitcoin’s 10-year life hash rates have peaked following peaks in the Bitcoin price, subsequently bottomed out as miners capitulate, and then resumed their upward climb.
Miners are Resilient
Bitcoin miners are more resilient than the public investor.
Investors and speculators threw in the towel well before Bitcoin Miners in all of Bitcoins three major price crashes of over 80% in 2011, 2014 and 2018. Hash rates declined following price declines.
Bitcoin hash rates also decline much less than prices during downturns. Since 2010, the maximum hash rate downdraw (pullback from prior all-time high value) was 53%, versus a maximum price downdraw of 93%. For example, in all of 2015, prices were down over 70% from their all-time highs for a total of 104 days, meanwhile Bitcoin’s total hash rate was down more than 20% from its all-time highs for a mere 16 days only.
For all three major price crashes, once the worst of the pullback was over, and price bottomed out, hash rates quickly resumes an upward march.
Using ‘Hash Rate Capitulation’ to Pick Bitcoin Price Bottoms
The intrinsic relationship between hash rate and price, and stronger ‘will’ of the miners gives a great indicator of Bitcoin price bottoms.
While this indicator is lagging, it is most useful in the heat of the capitulation. When all the headlines are negative, when there is renewed debate of “the death of Bitcoin”, when price is swinging plus or minus 10% a week, and when the market has already dropped between 30–90% since the all-time high, intrinsic value and other metrics can be relied on to see through the fog.
The Bitcoin hash rate is one such metric. It is relatively smooth compared to price and offers clarity on when to re-enter the Bitcoin market.
The ‘Hash Rate Capitulation’ Metric
A buying opportunity is identified when the daily hash rate breaks through the 50-day average to the upside, having been below it for at least 3 days.

Using this strategy alone, the worst return of any purchase which was held through to present day is 193% (see Case 7 in the table below and using a Bitcoin price at time of writing of $11,700 on 5 August 2019).
The maximum downdraw since 2010 would have been just 35%, with the greatest draw down in the last 7 years being just 8.7%.
Significantly greater returns are possible if positions are exited more tactically, as illustrated by the below table.

*assumes buy occurs 3 days after Hash Rate Capitulation cross-over, to conservatively allow for any metric lag
**grey text: crossover occurred within last 12 months, outcomes still pending
Limitations
Bitcoin is a young asset. Being only 10 years old the data set is limited, which significantly reduces the statistical significance of all metrics. For best outcomes, Bitcoin Hash Rate Capitulation should be used in conjunction with additional risk/reward management strategies.
Conclusion
Buying at any point when hash rate has bottomed in the past would have yielded excellent returns.
Following this strategy over the last 7 years would have incurred a maximum loss of 8.7% regardless of when you sold, with the potential for multiple 10X upside scenarios. For an asset with regular price collapses over 30%, and often in excess of 50%, this is a strong result.
For the risk-adverse looking to enter Bitcoin, this may be a great strategy for you. Though be warned, this strategy requires patience. The average time between signals is 16 months, with the most recent occurring just under 5 months ago.
Disclaimer on Backtests
Any Backtest performance returns presented represent hypothetical returns and are meant to simulate how a strategy would have performed during the period shown had the strategy been implemented during that time. Backtested/simulated performance returns are hypothetical and do not reflect trading in actual accounts. Backtest returns are provided for informational purposes only to indicate historical performance had the strategy been implemented over the relevant time period. Backtested performance results have inherent limitations as to their relevance and use. One of the limitations of hypothetical performance results is that they are generally prepared with the benefit of hindsight. In addition, hypothetical trading does not involve financial risk, and no hypothetical trading record can completely account for the impact of financial risk in actual trading, such as the ability to withstand losses or to adhere to a particular trading program in spite of trading losses, all of which can also adversely affect actual trading results. There are numerous other factors related to the markets in general and to the implementation of any specific trading program which cannot be fully accounted for in the preparation of hypothetical performance results, all of which can adversely affect actual trading results. Any and all of these factors mean that no representation is being made that strategies presented here will achieve performance similar to that shown, and in any case, past performance is no guarantee of future performance.


