Fall of the Bitcoin Wall
When Bitcoin moves, it moves!
Welcome to the second issue of the Capriole Newsletter.
We try to release our newsletters when we see key opportunities. Today that was the clear price break above $14K. Unfortunately we are slow writers! Over the 3 hours since we started preparing this newsletter, Bitcoin climbed $500.
In our first newsletter issue released October 7th, we presented an “incredibly bullish” case for Bitcoin. We are happy to say that since then Bitcoin has achieved its highest prices since the 2017 bull-run peak, and is currently up over 40% in the last month.
Let’s see where things are now…
The News
October was a huge month for Bitcoin. Lots of positive news. Here are some of the highlights:
- Paypal and Venmo introduce crypto buying, selling and shopping.
- Square adds $50M Bitcoin to its balance sheet.
- Stone Ridge Holdings Group announces it has more than $100M Bitcoin too.
- Singapore’s largest bank (mistakenly) pre-announces crypto exchange & custody.
- JPM launches digital asset business unit.
- The US Federal Reserve and Australian Federal Reserve announce further studies into using a CBDC.
- Iran government to use Iranian-mined Bitcoin for payments.
- ByBit exchange has partnered with Germany’s second largest football club, Borussia Dortmund.
A lot happened and the message and direction is consistent with 2020 developments. More and more integration of crypto into company treasuries, financial systems and payment mechanisms. Many of these actions (such as fund, bank and company investments) reduce Bitcoin circulating supply and create positive pressure on price. Other actions broaden public exposure, credibility and acceptance of Bitcoin into our world.
The Markets
US stock markets continue to rally after the elections, though no clear winner has been declared yet.
Historically, a trend has usually emerged following elections. Over the last 60 years, 69% of elections saw a rally in stocks over the following month. It seems risk-markets have tended to like the ensuring clarification in political direction following elections. For Bitcoin, this is far from any sort of guarantee, but it is another factor to consider which tends bullish at present.
While this is positive today, it is also the biggest risk. Given the uncertainty of the election, the results and stock market implications should be monitored closely into the coming weeks.
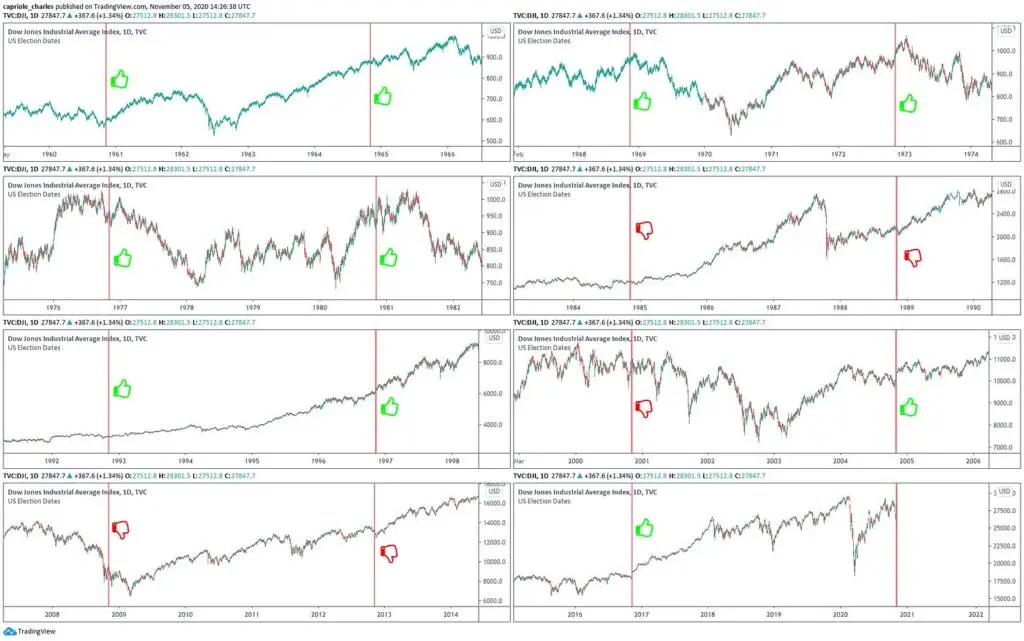
60 Years of the Dow Jones around US elections. Only 5 elections saw a negative following month.
https://www.tradingview.com/x/I55wlUAN
The Fundamentals
As of writing there are two key on-chain metrics to pay attention to. Both scream bullish continuation for Bitcoin:
- Falling Bitcoin supply
- Bitcoin Utilization in the buy zone
Falling Bitcoin Supply
Based on CryptoQuant data, there has been an exodus of Bitcoin reserves on cryptocurrency exchanges this year. The stock of Bitcoin on exchanges is down 25% year to date.
This lack of tradable Bitcoin causes a supply shock to potential buyers, also likely driven by the halving dynamic (see “Content we love” below), and increases the probability of positive price movements. This is typical of the start of a bull market.
The chart below highlights (vertical orange lines) every time the supply of Bitcoin on exchanges dropped more than 5% over a month. All cases except one saw a significant price climb in the following months. That’s a 89% bullish hit rate.
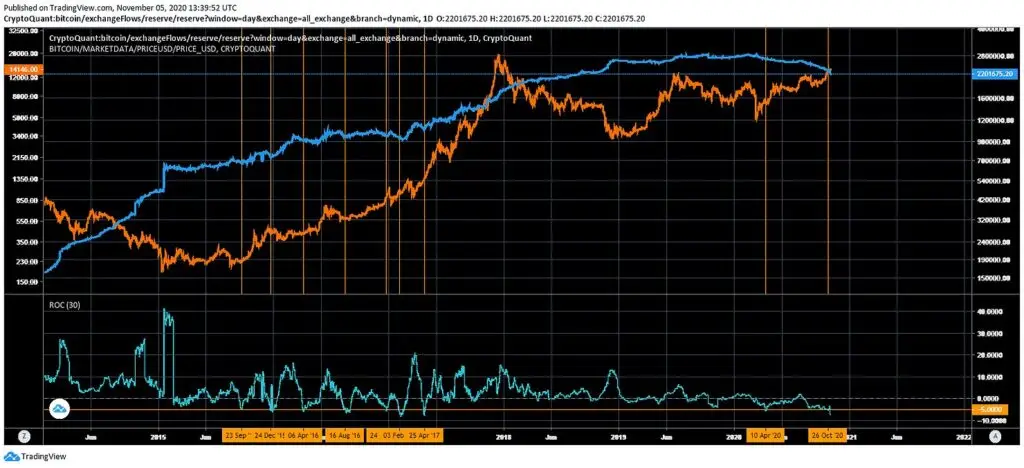
Top: Bitcoin Price (orange) vs Exchange Flows (blue) Bottom: the 1 month rate of change in exchange flows (turquoise)
https://www.tradingview.com/x/mM6m59xI
Bitcoin Utilization Oscillator
Bitcoin Utilization Oscillator is a smoothed RSI of the Daily Active Addresses, it highlights cyclical high and low usage of the Bitcoin network. It is far from flawless, but has helped identify great buy and sell zones over the last two years.
Like all metrics it doesn’t work every time and should be considered in a broadened context to assess probabilities. See chart of Bitcoin Utilization Oscillator below.
The Hash Ribbons
Another consideration to watch closely is the Hash Ribbons.
On 31 October we entered a new Hash Rate Capitulation. Why? Every year China has a “wet season” that drives miners to take advantage of cheap and abundant hydro power. To do so they relocate from all over the country. The wet season has now ended and mines are moving power sources. This relocation can take around 2 weeks for a miner. Here’s a good thread for some detail with CryptoDog.
Because Chinese miners represent around 60% of global Bitcoin mining, this shift can cause a decent dip in hash rates. But in the 5 days since the capitulation, Hash Rates have already recovered around 50%, in line with the miner relocation narrative.
The key here is to monitor Hash Rates over the next 2 weeks. If they continue to rebound as expected, we should see another Hash Rate “buy signal” soon. When we will start to get cautious is if the recovery does not complete over that period, which could suggest a broader issue. For now, that risk is very low.
Historically, the best long-term buy opportunities have occurred during a Hash Rate capitulation. They are often tricky to identify, but the below Technical Analysis update should help explain why we remain so bullish with Bitcoin above $14K.
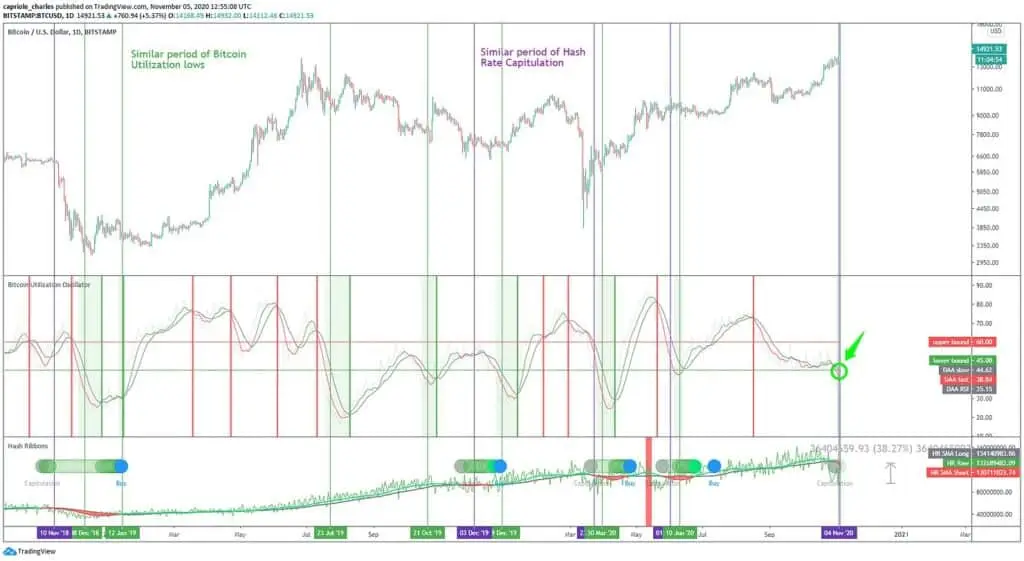
Two years of Bitcoin price, BItcoin Utilisation Oscillator and Hash Ribbons buy zones.
https://www.tradingview.com/x/q7iyHZmD/
Over the last 2 years, 10 out of the 11 occurrences where Hash Ribbons and Bitcoin Utilization were in a similar spot identified local bottoms and were followed by large positive moves. That’s a 91% hit rate.
Remember: fundamentals give indicative direction over the coming 4-8 week period. All measures suggest Bitcoin is experiencing a supply shock and is currently in a buy zone.
These are three reasons why we remain bullish Bitcoin this month.
The Technicals
High Time Frame
Monthly levels are looking great for Bitcoin. October close was the second highest in history, just slightly below the December 2017 close. As the last monthly resistance has now been broken, the road is cleared for more upside. The key levels to watch are the weekly resistance at $15K and the area between the highest weekly close and the ATH ($19.2-20K). Any dips to $13-14K will likely be great buying opportunities.
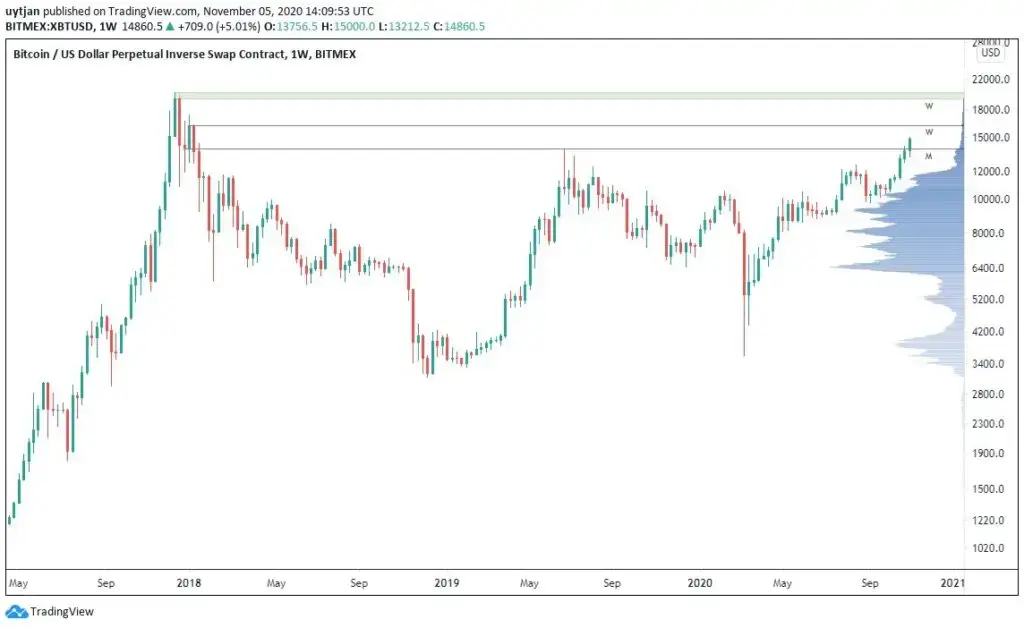
Weekly chart for bitcoin, with little resistance above current price.
https://www.tradingview.com/x/UjHkoHTH/
Low Time Frame
On the low time frame, the picture is quite bullish as well. There has been a significant breakout of $14K over the last 24 hours. The monthly close barely broke out of this range, but the huge move in the last day is very significant.
On the RSI, there has been a breakout of the descending diagonal. In 2020 almost every RSI diagonal break and retest was followed by a big move up. The same has occurred today as we write!
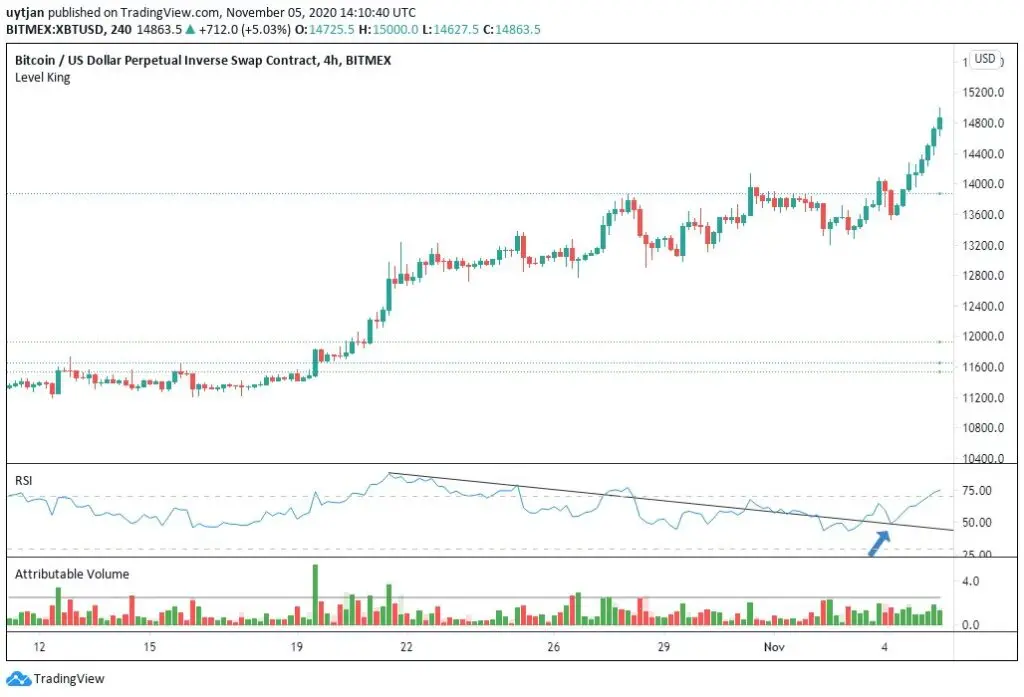
Low time frame chart for Bitcoin, with the breakout of the descending diagonal on RSI. https://www.tradingview.com/x/TCqHkIWI/
On the order books, there was a large “sell wall” at $14,000. Breaking above this was a key confirmation of the bull run. The highlighted Support/Resistance flip shows the moment when Bitcoin started to take off and opened price to the biggest Bitcoin range in history: $14-19K.

The TradingLite Orderbook for BitFinex (representative of the market).
The Bottom-Line
There have been very few periods where we are so bullish. It’s been a month of positive price and news developments, and the picture remains broadly the same from a value perspective today. The break above $14K effectively re-confirmed the bullish case. Bitcoin looks set to continue its bull run.
There will be dips along the way. The biggest near-term test being $19,000, which is acting as a technical magnet right now.
Should we encounter some downside, $14K would likely be a gift of a buy zone. But don’t count on getting it.
Content we love
- Ray Dalio’s november podcast: his thoughts on the economy, debt cycles and economic power struggles to come with China… we think he is still figuring out Bitcoin though.
- More on the Chinese miners annual relocation process here.
- The Halving supply shock process summarized.
Podcast
Charles chatted with Earl from Finmates this month about Capriole Investments, Bitcoin, algotrading, DeFi, the economy and his thoughts on a 3-5 year Bitcoin price target.
You can listen to it here!


