

Institutions are Dumping Bitcoin
Since last issue, the crypto market has taken a beating. Half of the current drawdown has occurred since our “Most Important Chart” (Institutional Buying) turned bearish.
This has been a unique cycle. So far, there have been no signs of retail euphoria, onchain conditions largely look robust and we have seen a strong backbone of price performance led by institutional buying. Institutional buying drove Bitcoin up over the last 6 months and is responsible for all the major price rallies over the last 2 years. However, as of writing, institutions have turned net sellers of Bitcoin. As long as those conditions remain, and with the 188 Treasury companies treading water and some already selling Bitcoin, there’s cause for some risk management as Bitcoin hovers at $102K.
Technicals
Bitcoin technicals have broken down through major weekly support at $104K. Should this Sunday’s close below $104K, it opens up the technical range below and a range bound move to $90K. Should Bitcoin rally to $105 by Sunday night we would have evidence for a downside fakeout (bullish), and potential for a strong short term impulse up. A lot hinges on this Sunday.
Should we re-enter the $90-100K range, it’s worth bearing in mind the Bitcoin Production Cost also sits at $90K, and any trading below that would represent deep value. Bitcoin’s Electrical Cost is at $71K today and that has historically been a hard price floor.
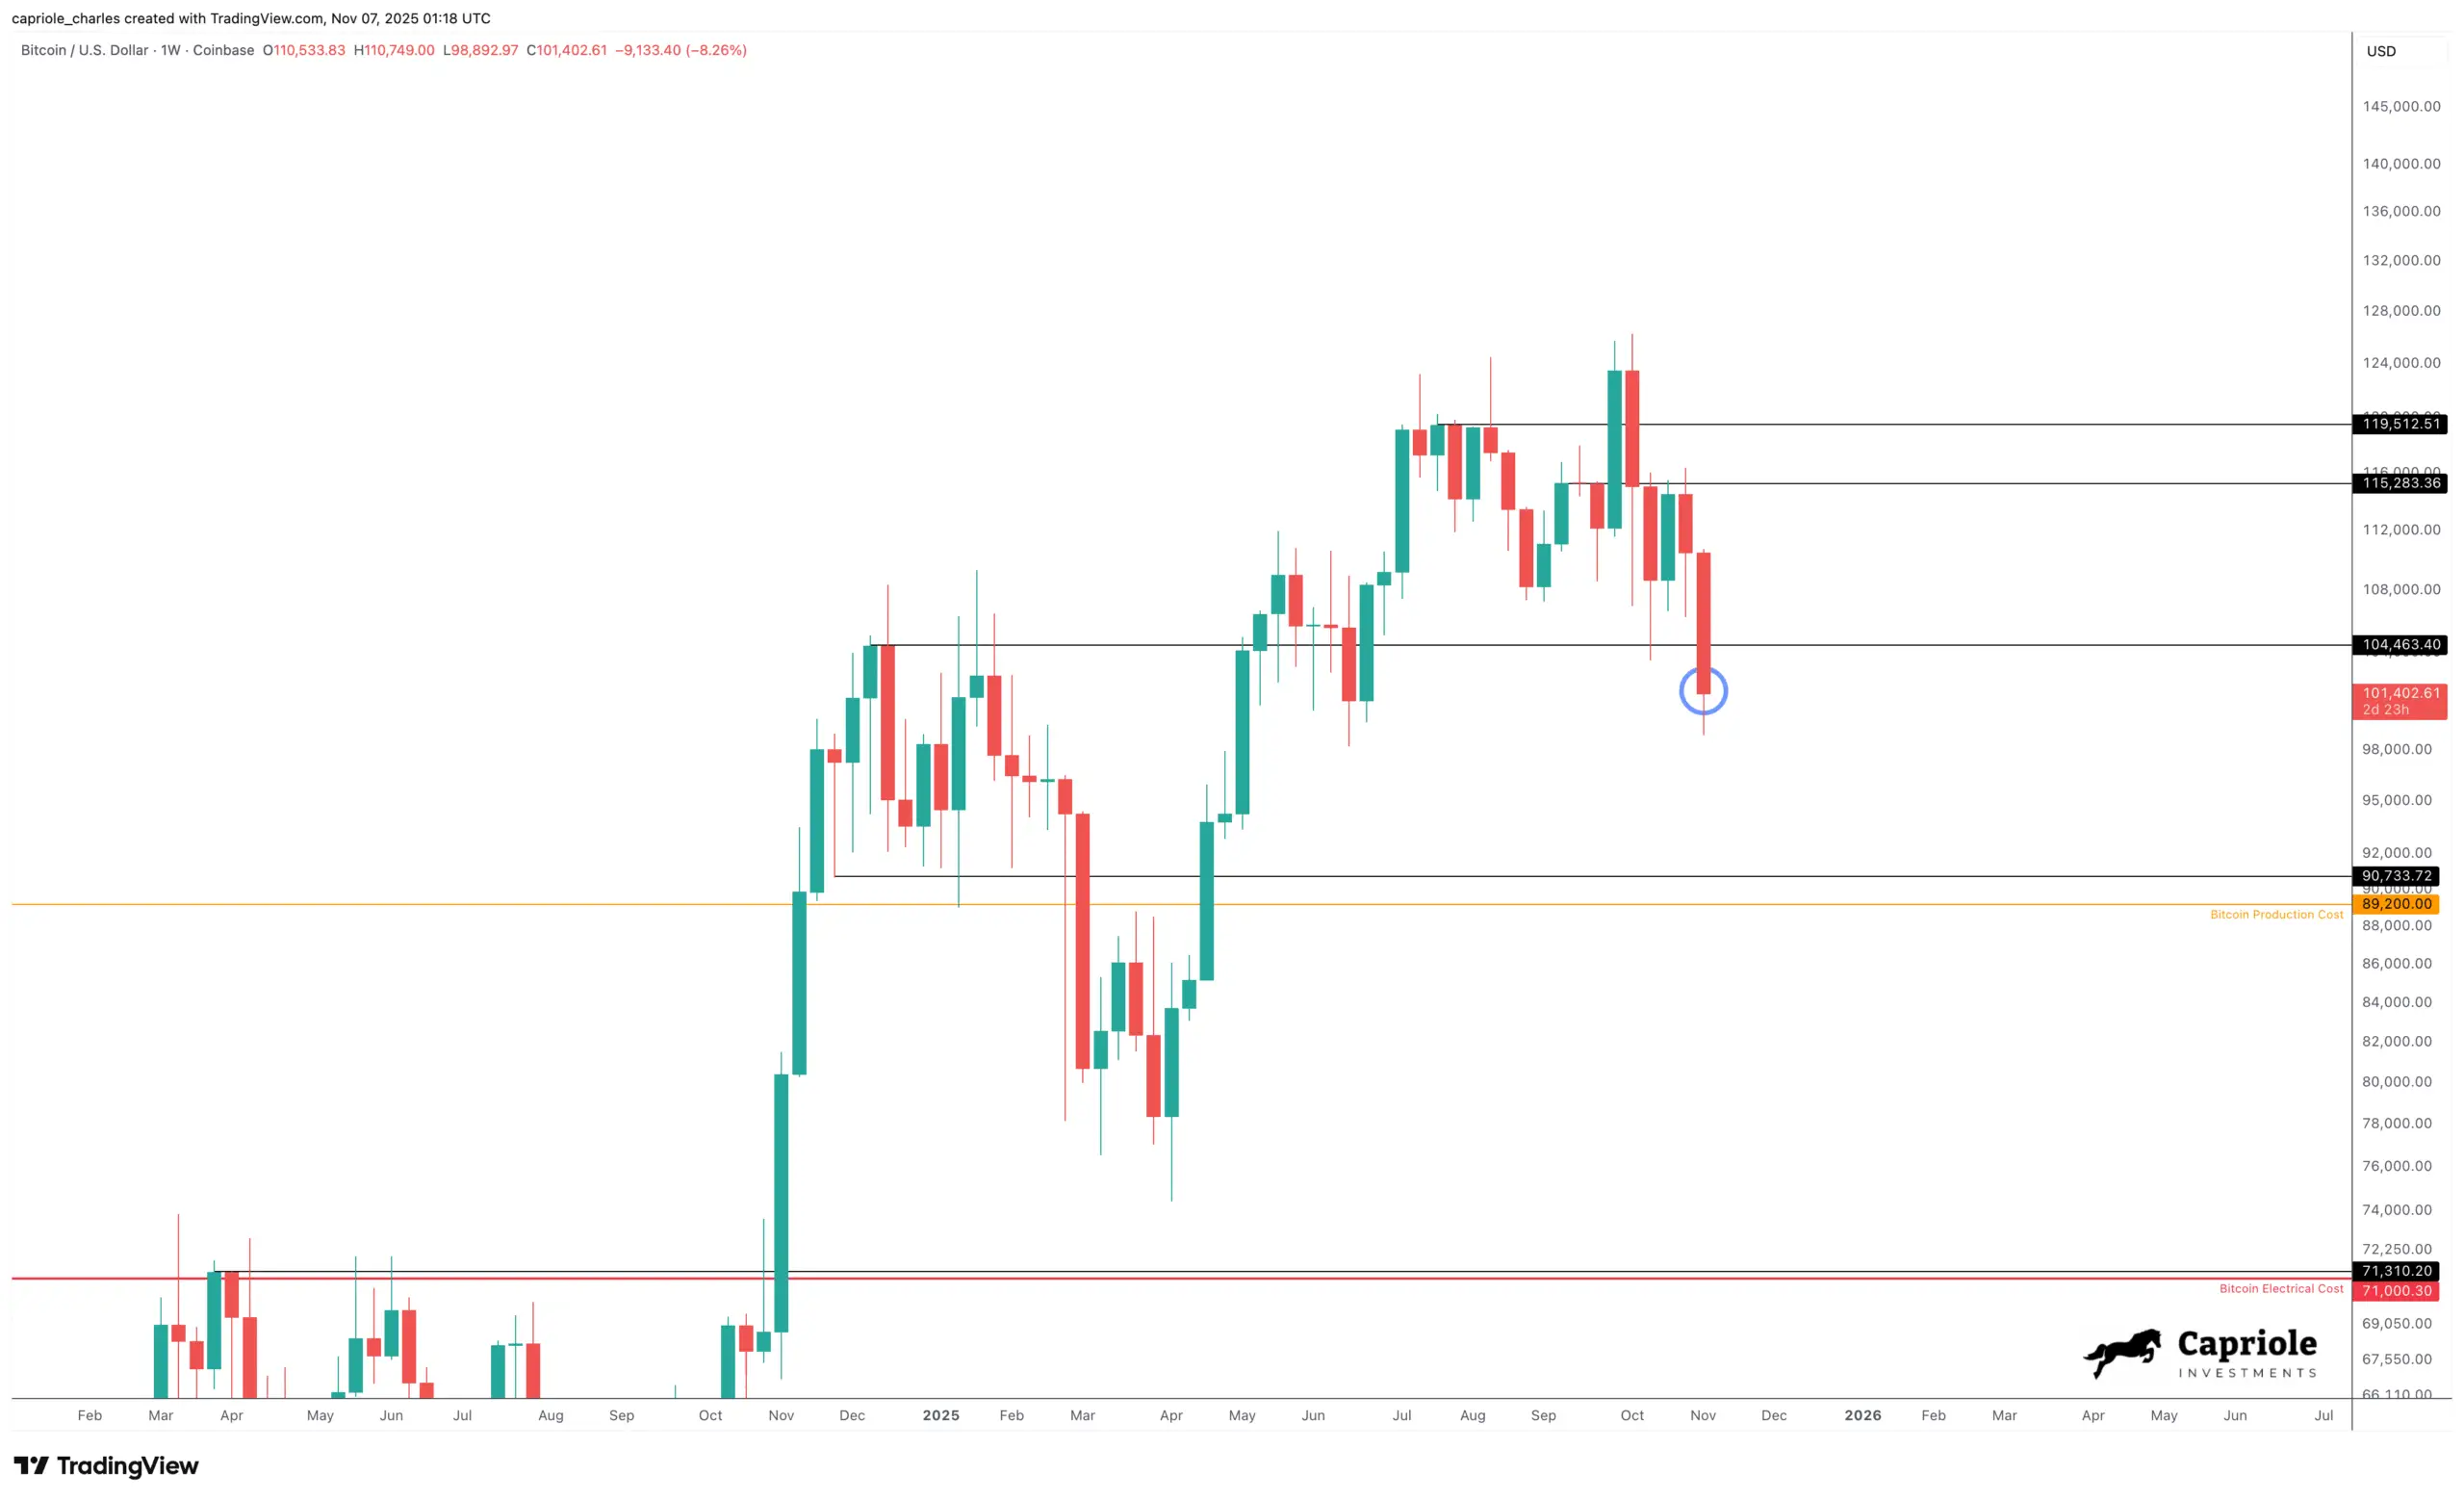
Bitcoin technicals showing a bearish breakdown… but theres still a chance for the Weekly to recover by Sunday.
Fundamentals
US Liquidity Falling
A driving factor for the reduced institutional buying may be tied to the US Government shutdown, which has just entered its 36th day becoming the longest in history. The shutdown has seen the tap run dry on US Liquidity.
US Liquidity measures the aggregates total dollar liquidity across the US Federal Reserve Balance Sheet, Reverse Repurchase Agreements (RRPs) market and the US Treasury General Account (TGA). US Liquidity is a powerful metric that shows how the primary top-down US policy decisions (such as QE and QT) impact capital flows across all financial markets.
As US liquidity dries up, so too may be the drivers for allocating to hard money like Bitcoin.
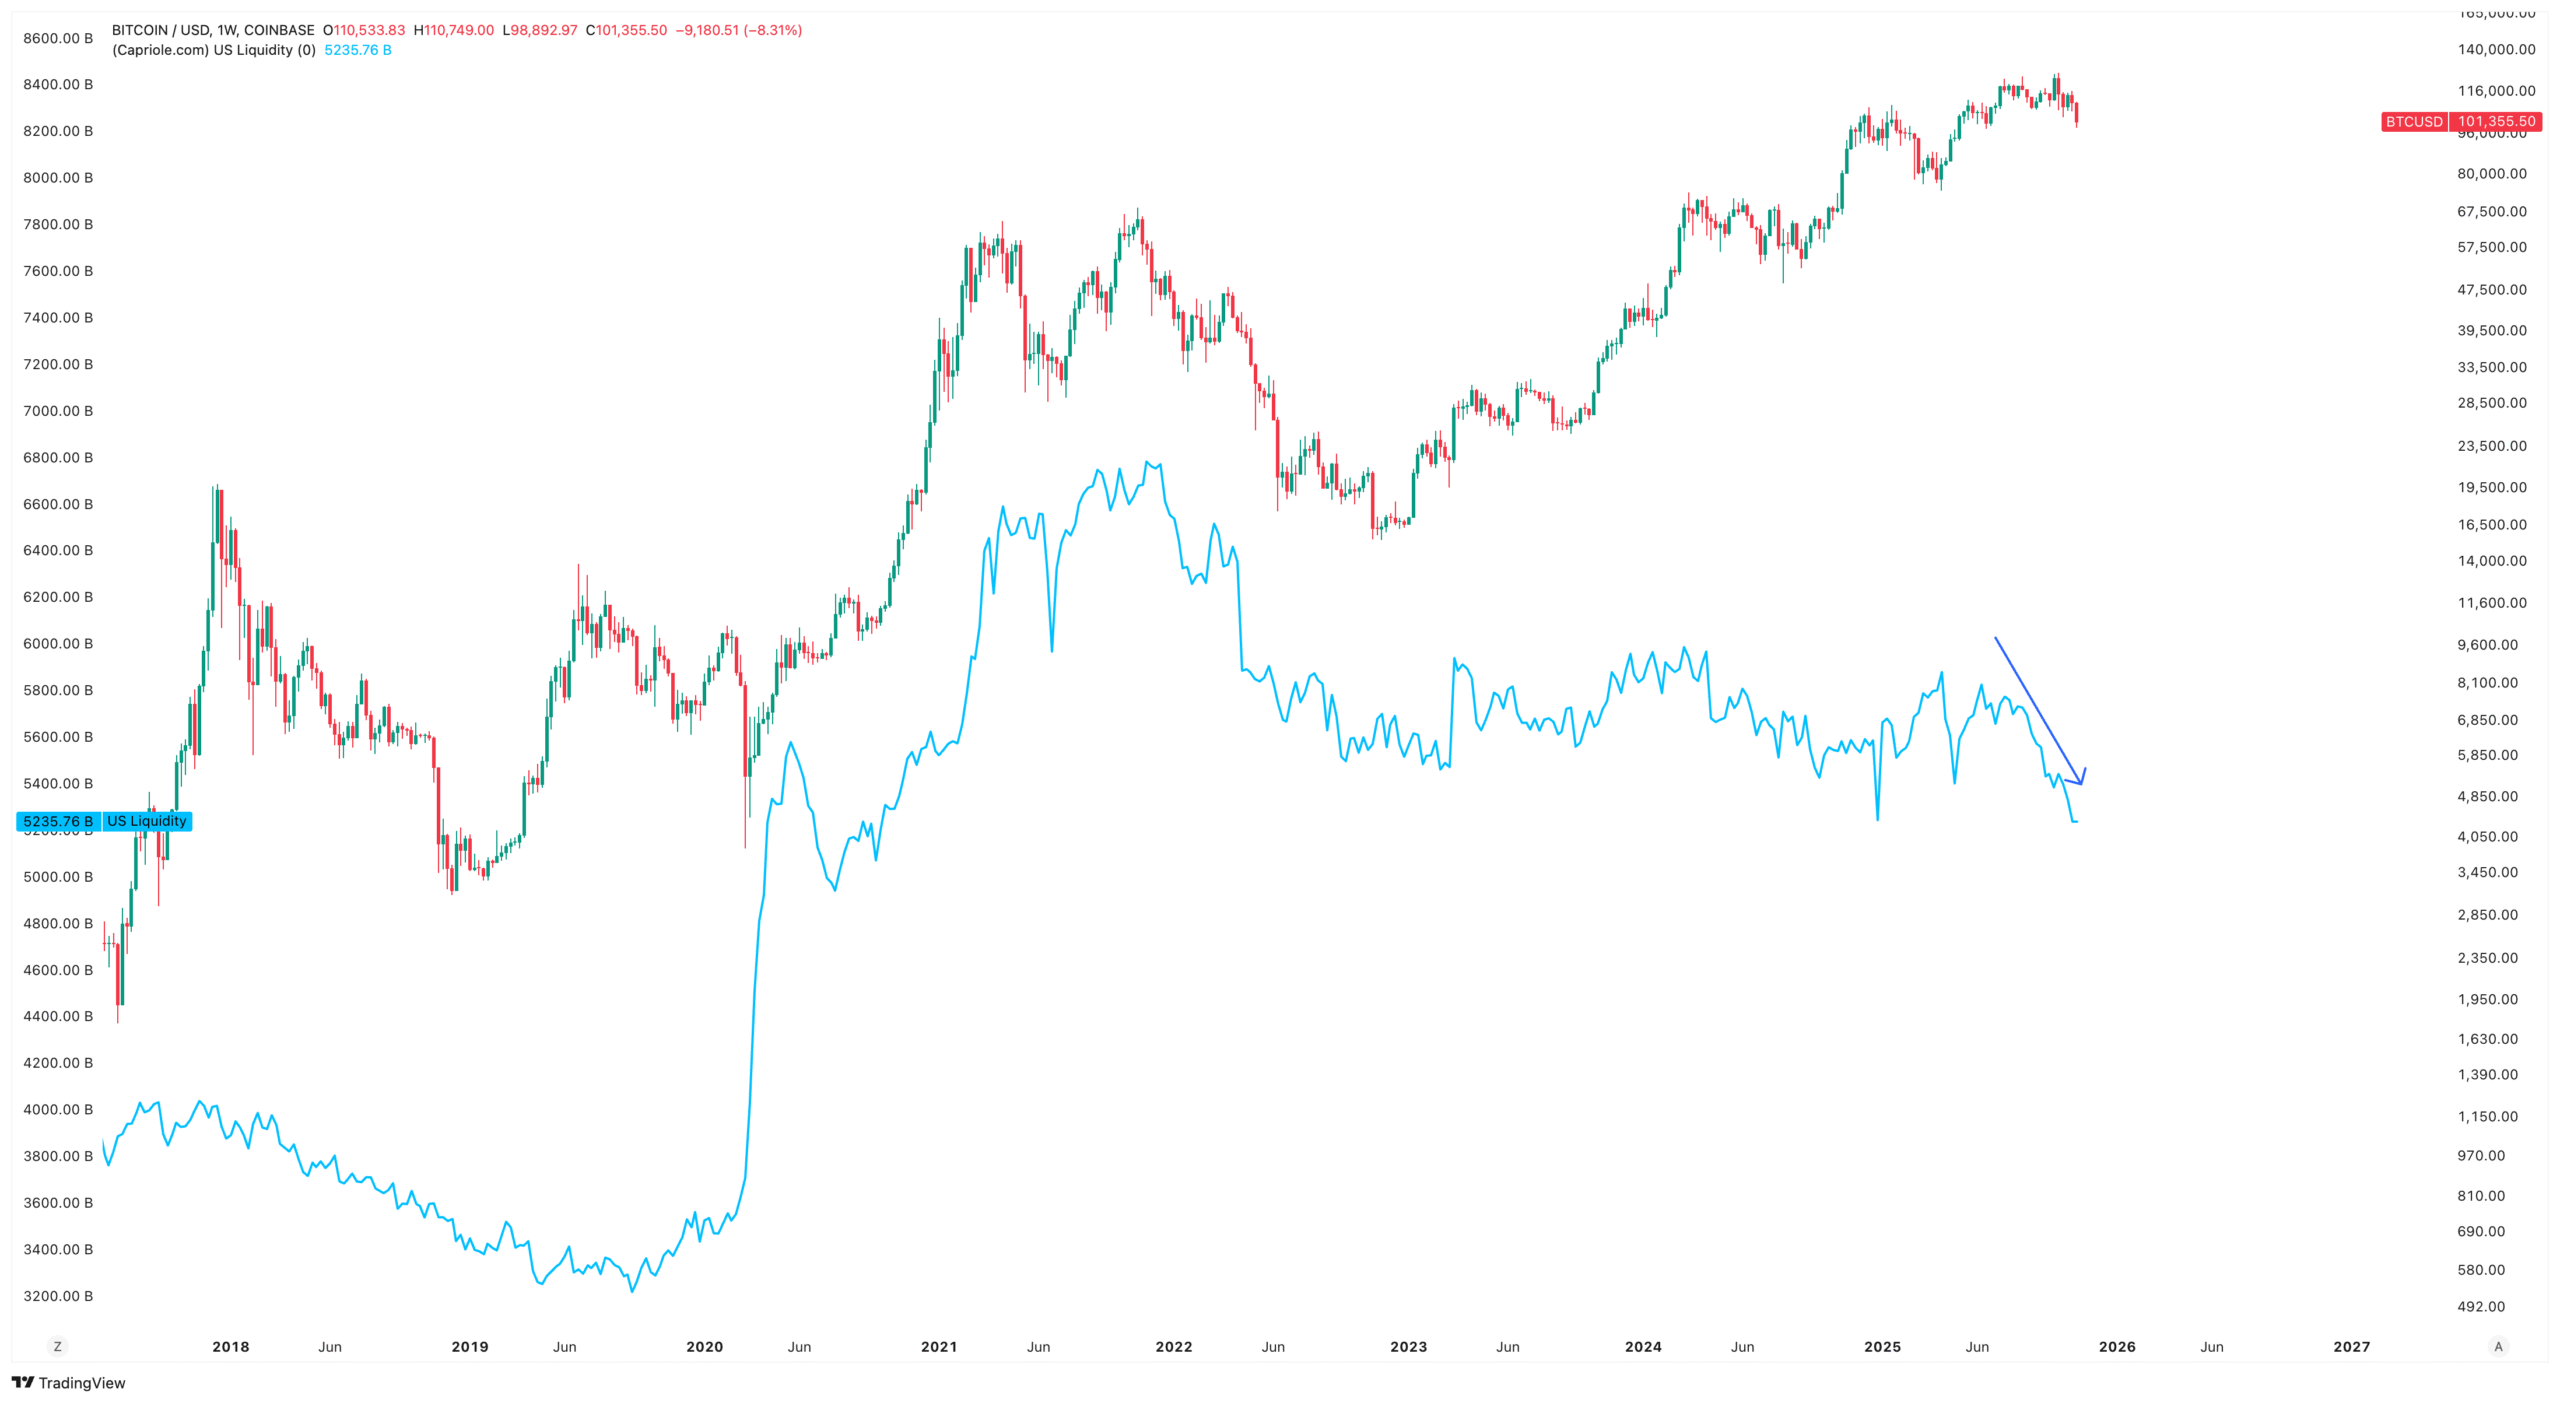
US Liquidity is in decline, causing some headwinds to risk assets. Source: Capriole.
However, the US Shutdown is expected to end within the next two weeks (per Polymarket), which will likely result in at least a short-term boost in US Liquidity. In short, it may well be that the driving factor behind waning institutional interest in Bitcoin is simply as a result of the US Government shutdown, and this could mean-revert into late November.
A Supportive Federal Reserve
I believe the market has unreasonably assessed the Fed’s recent moves as “hawkish”. Today we have a clear line of sight to a very accommodative monetary policy, declining interest rates and even Fed balance sheet expansion. Let’s review.
There are three key elements indicating a supportive Federal Reserve here:
- Interest rates are falling. There’s a 75% chance of another rate cut in December. The average forecast by Federal Reserve participants is a decline in interest rates to 3% over the next 2 years.
- QT has ended. Last week Powell confirmed the Fed will end quantitative tightening (QT) on December 1, 2025, halting the runoff of Treasury securities. The era of tight Fed policy is over, opening the pathway for more accommodative liquidity, typically supportive of risk assets.
- The Fed is forced to add liquidity. We are now approaching the point where the Fed’s hand is being forecast to grow its reserves, As Powell said “…at a certain point, you’ll want reserves to start gradually growing to keep up with the size of the banking system and the size of the economy. So we’ll be adding reserves at a certain point…”. This is big. For the Fed to maintain its control and influence over the US economy, it must grow its reserves soon which means pumping money into the market.
So we know interest rates are currently planned to drop another 1% and we know the Fed plans to inject liquidity into the market. It’s hard to be macro bearish risk assets or hard money like Gold and Bitcoin with that backdrop in front of us. Given all asset pricing is relative, this is the policy backdrop that could extend the current equities bull market by years.
Relative PE – A fairly valued market.
The Relative PE metric is tracking at a relatively buoyant 1.23 today. Relative PE is our enhanced Price-Earnings ratio for the S&P500. It compares the value (PE) in risk assets against relative opportunity in “risk-free” bonds. Relative PE = 10-year rate / (inverse PE ratio). Values below 1 suggest equities are cheap as equities yield more than bonds.
But if you factor in the Fed’s planned 25% reduction in interest rates over the next 12-24 months, Relative PE sits at a healthy 0.93, below the 10 year mean – suggesting fair pricing of equities today.
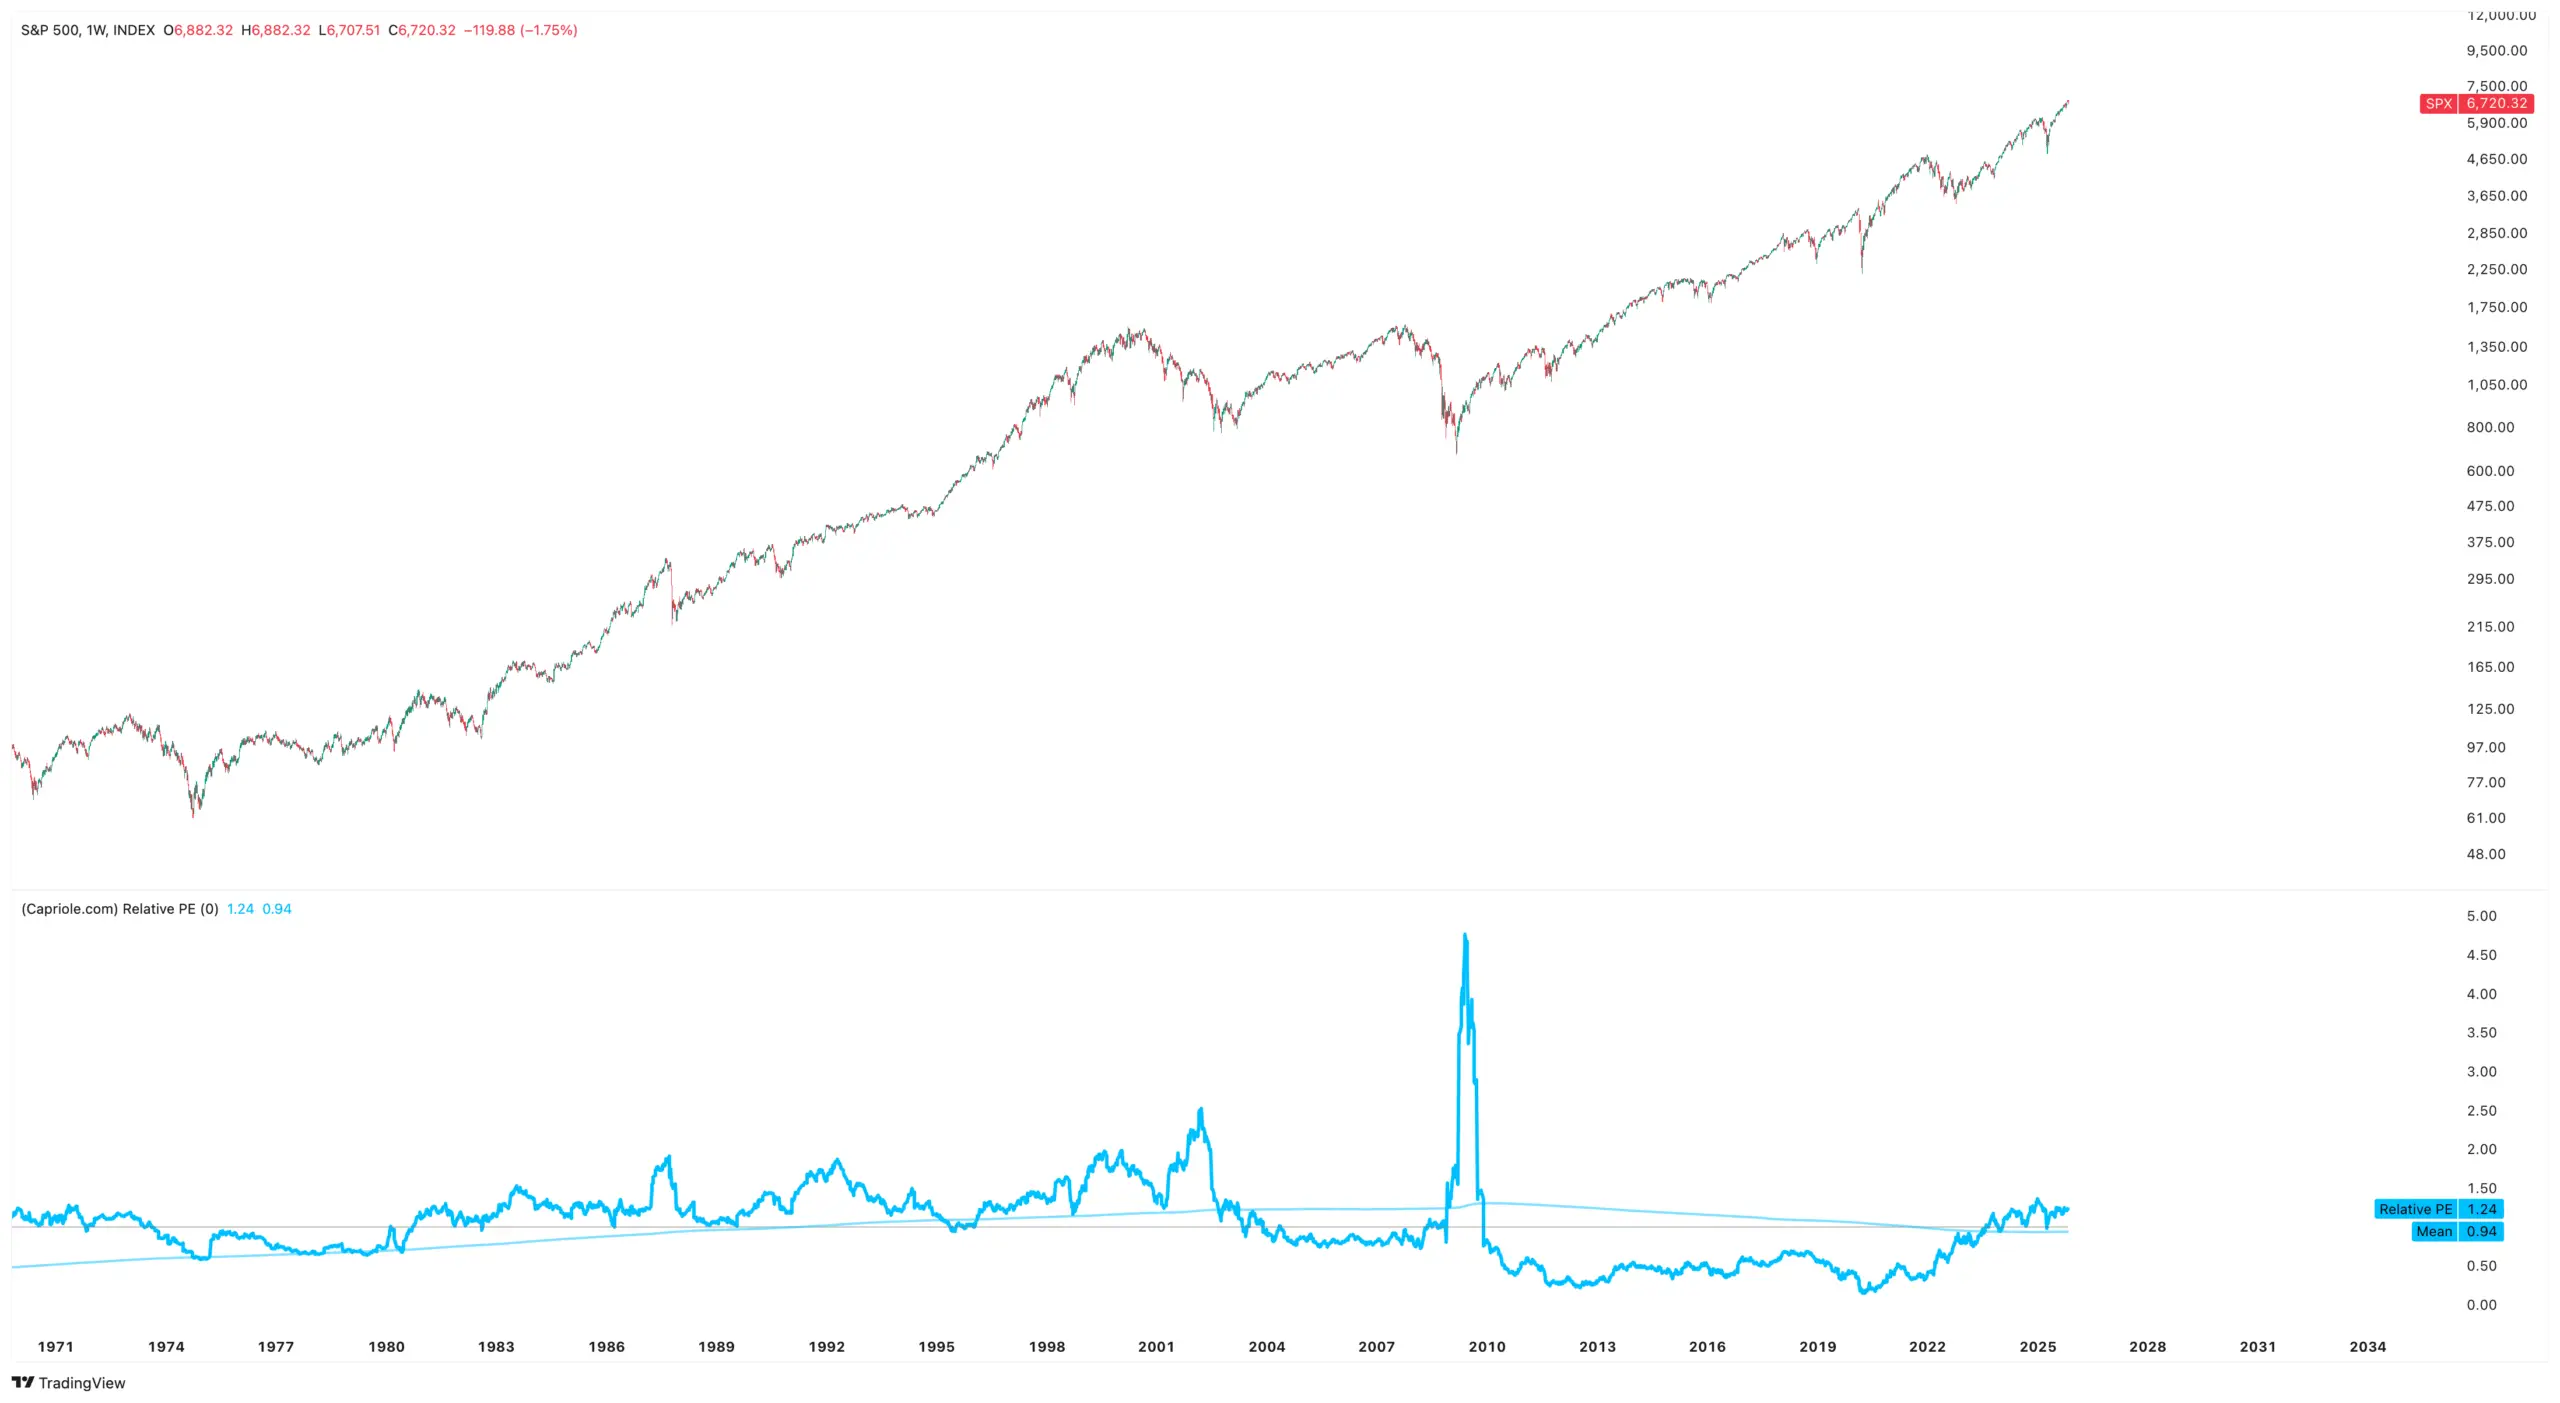
Relative PE suggests equities are not as overvalued as social media would have you think. Source: Capriole
Credit Warning Signs
Some signs of weakness currently exist in the market. Market Breadth is in decline and the Advance Decline Line failed to break out. But most concerning is the potential bottoming formation in credit spreads.
Credit spreads help assess the credit risk in the US Corporate bond market, spikes in this metric typically occur during risky macroeconomic periods, whereas lower readings suggest stronger confidence and creditworthiness. This metric often widens before and during recessions. Credit spreads are still at a very healthy low level today but have risen measurably since the start of the US Government lockdown, again this could be a short-term fear as a result of uncertainty, and general market derisking of higher yield corporate bonds until the dust settles. Definitely something to monitor. We don’t want to see this spike up over the next months, as it does in advance of significant market pullbacks.
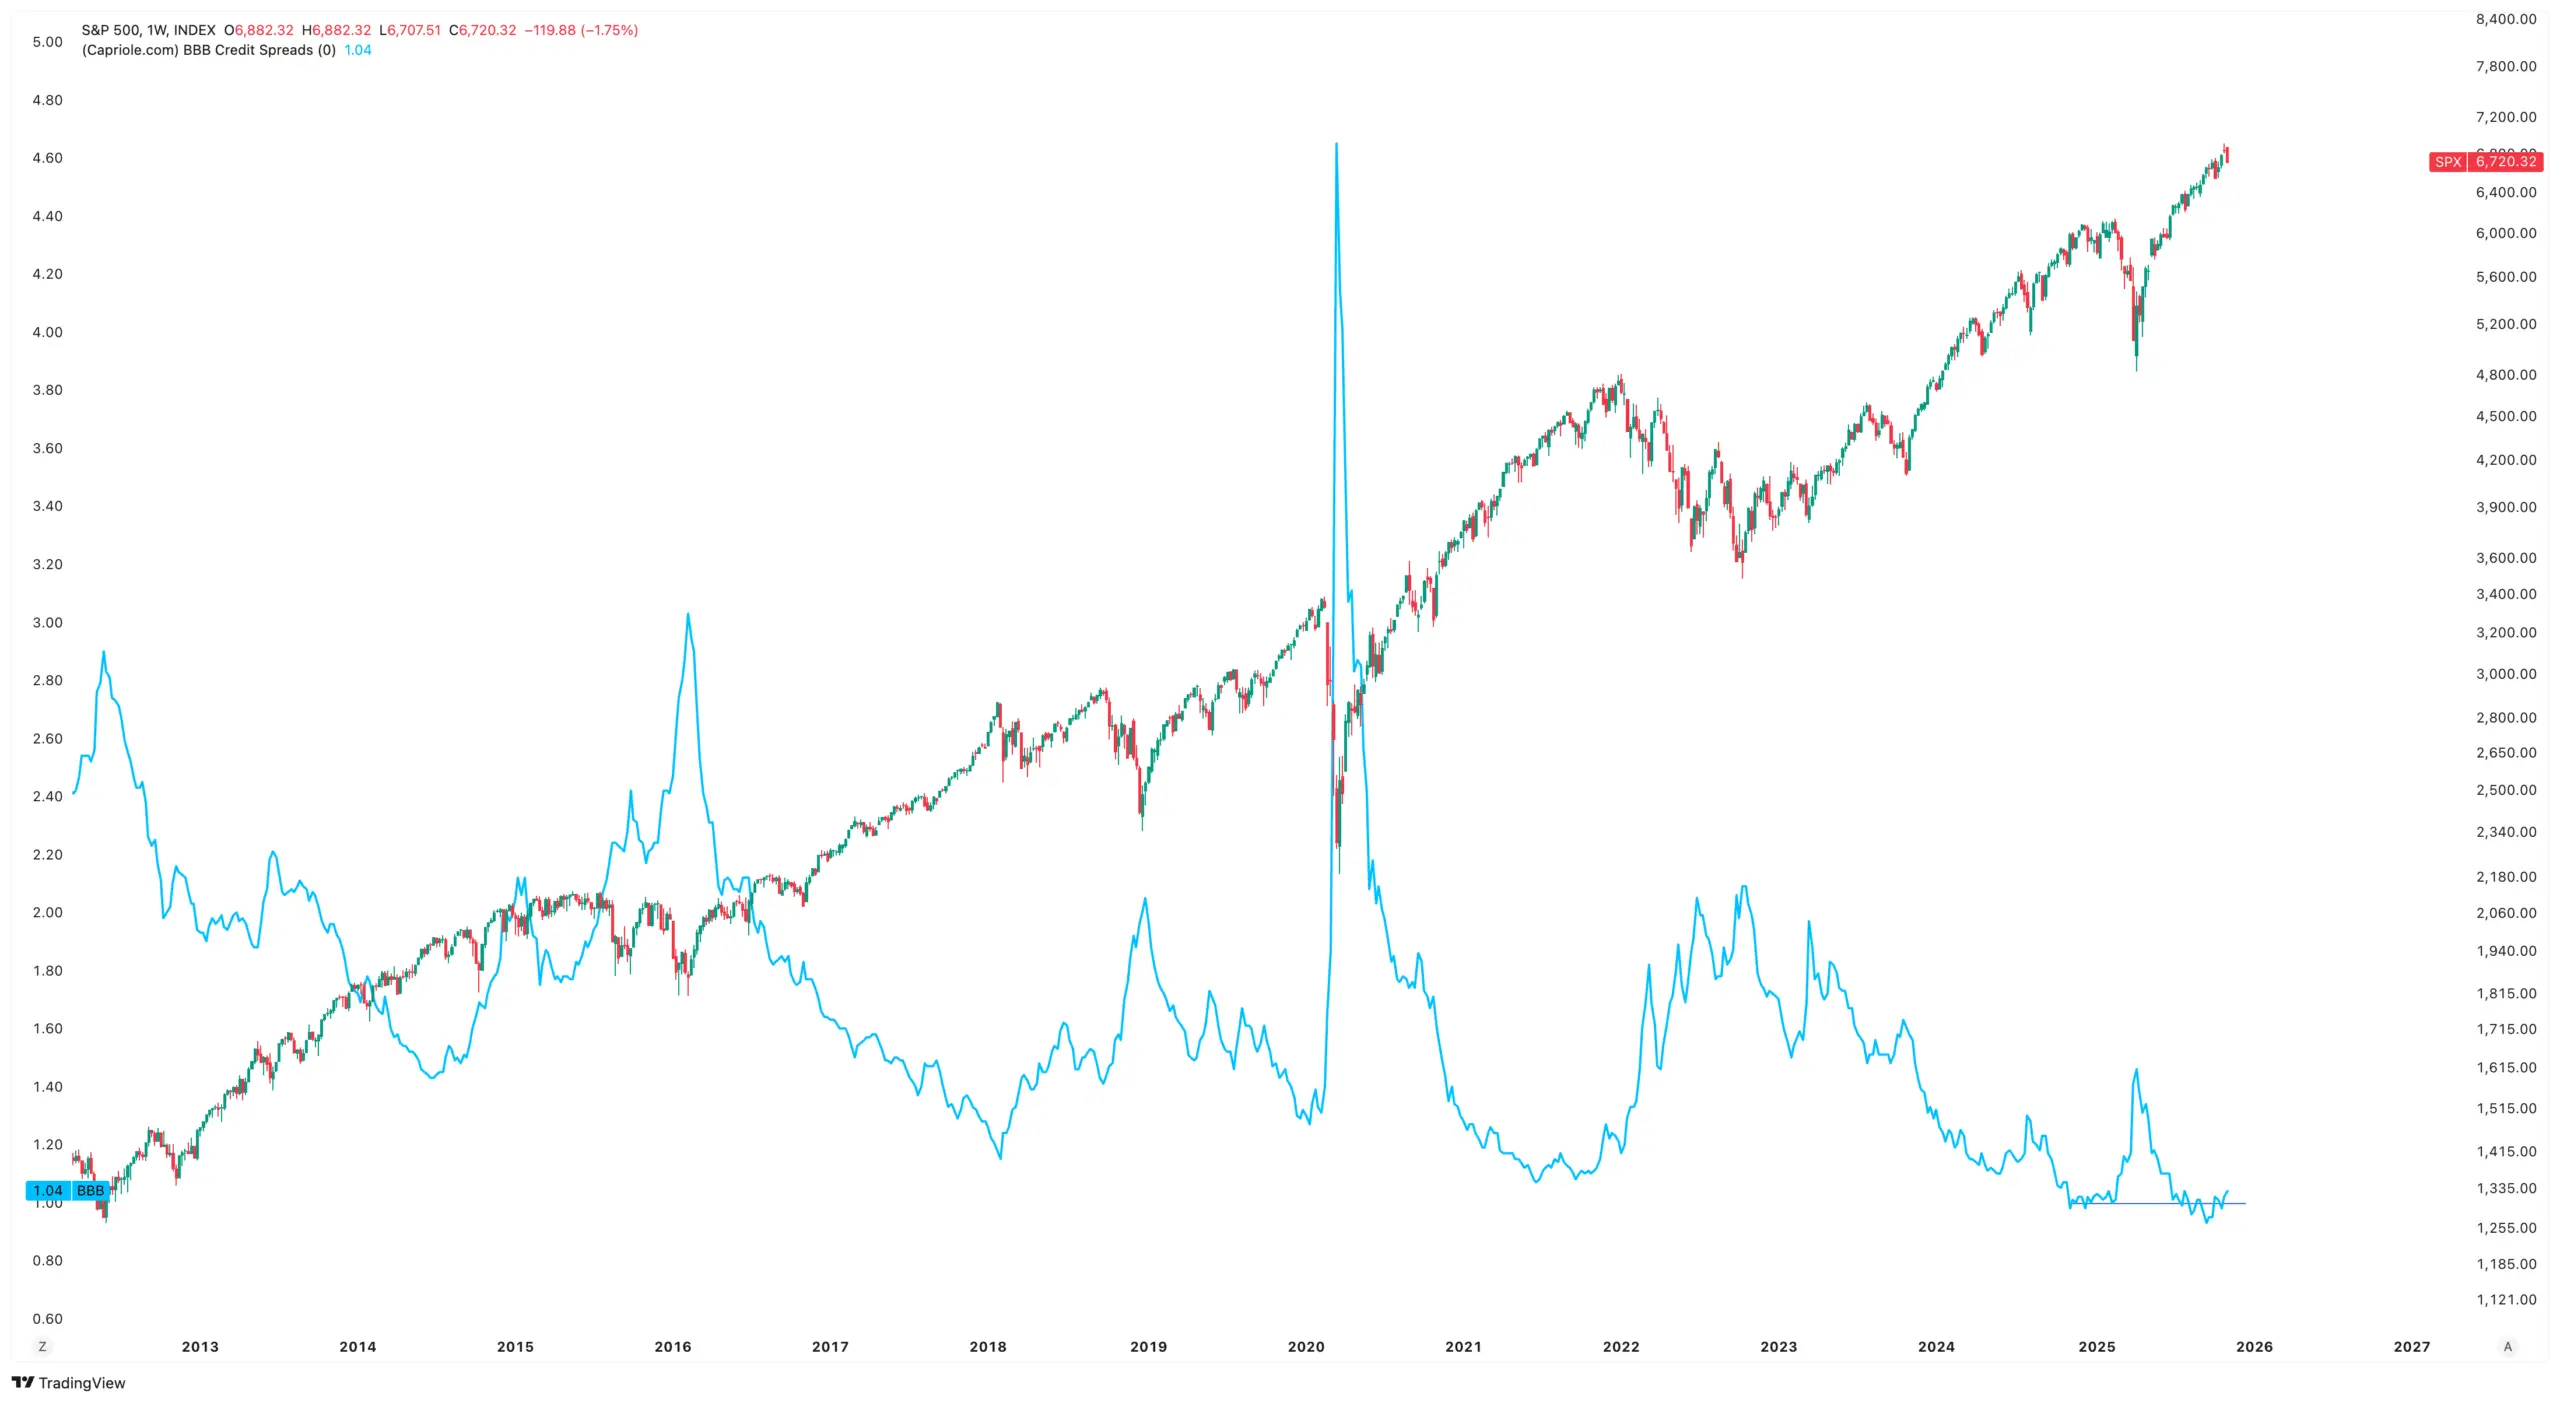
BBB Credit spreads are still at healthy lows, but have risen measurably during the US Government Shutdown. Source: Capriole
Institutions are selling Bitcoin
Turning to Bitcoin, we can see similar de-risking behaviour. As of this week, institutions are officially net sellers of Bitcoin and have been unloading positions.
Institutions here are tracked as the summation of all public market Bitcoin investment activity, the 188 global treasury companies and US Bitcoin ETFs. Over the last week we have also seen some prominent headlines of publicly listed treasury companies selling large stakes of their digital assets in attempt to contain their collapsing mNAVs (company valuation versus Bitcoin) and to cover risk. As we discussed at TOKEN2049, this is not a sustainable mechanism for these firms.
We again note, this is the most important metric to monitor for Bitcoin today.

Institutions turned sellers of Bitcoin this week causing a big drag on price. Source: Capriole
Conflicting On-chain data
Classic on-chain value metrics for Bitcoin are currently tracking in the healthy zone, think Hash Ribbons, Dynamic Range NVT, Energy Value which give us promise that should Institutions re-enter the market with a strong bid soon, we have a lot of airspace to take Bitcoin much higher, rapidly.
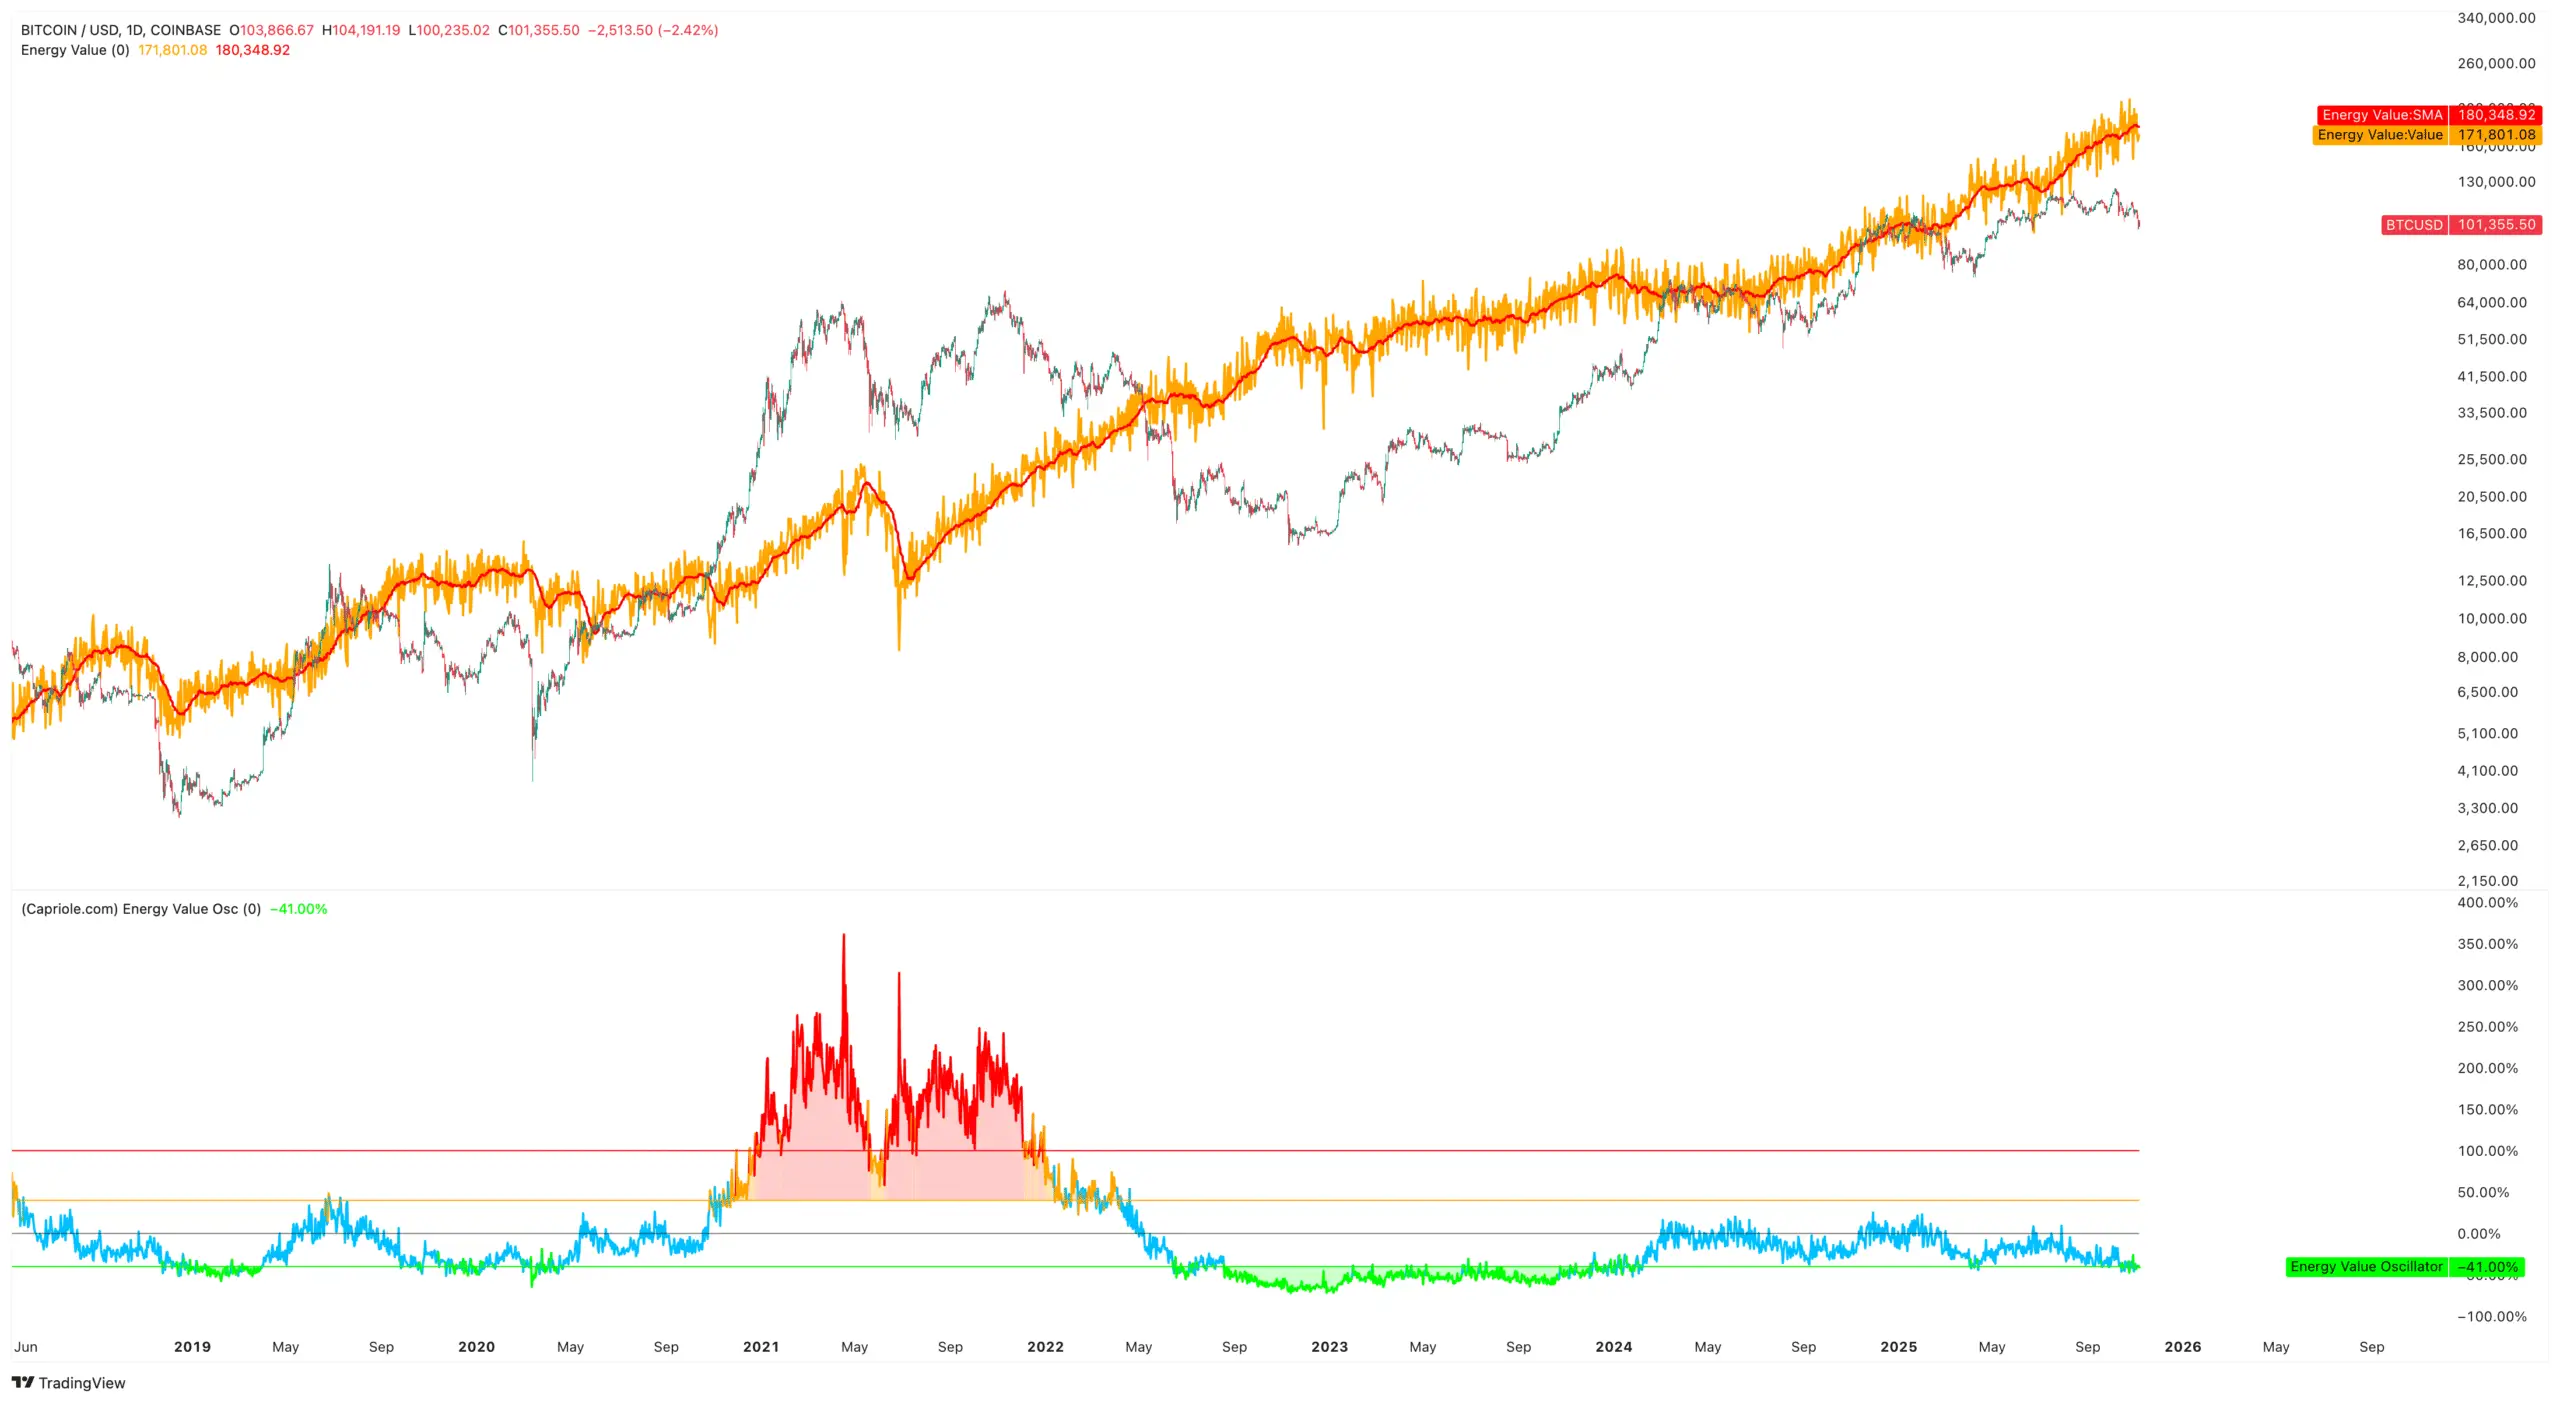
At $180K Energy Value tells us we have a ton of airspace to aggressively move higher, should institutional demand re-enter the market. Source: Capriole
But we also have some concerning data points. Not only are institutions net sellers, but Bitcoin “OGs”, the long-term battle hardened Bitcoin Hodlers, have also been unloading their positions for months. As the below chart shows long-term Bitcoin holders have been massively reducing their positions over the last months (orange shading), which is a behaviour typical of late cycle. Could this be a classic bearish signal? Or is there a significant element of holders moving to the simpler structure of owning an ETF and not having to worry about hard wallets, seed phases and private keys? I suspect a bit of both, but more of the former.
The real question is, can institutional demand offset this dynamic?
When institutions are net buyers of Bitcoin, and buying more than the daily mined supply (red line in the earlier Institutional Buying chart) we have seen time and time again that institutions dominate Bitcoin long-term holders and are the primary driver of massive price rallies. Nonetheless as this condition does not exist today, the confluence of these two powerful risk-off trends cannot be ignored.

All cohorts of long-term Bitcoin holders have been reducing their positions, with the current deallocation only matched by 2017. Source: Capriole
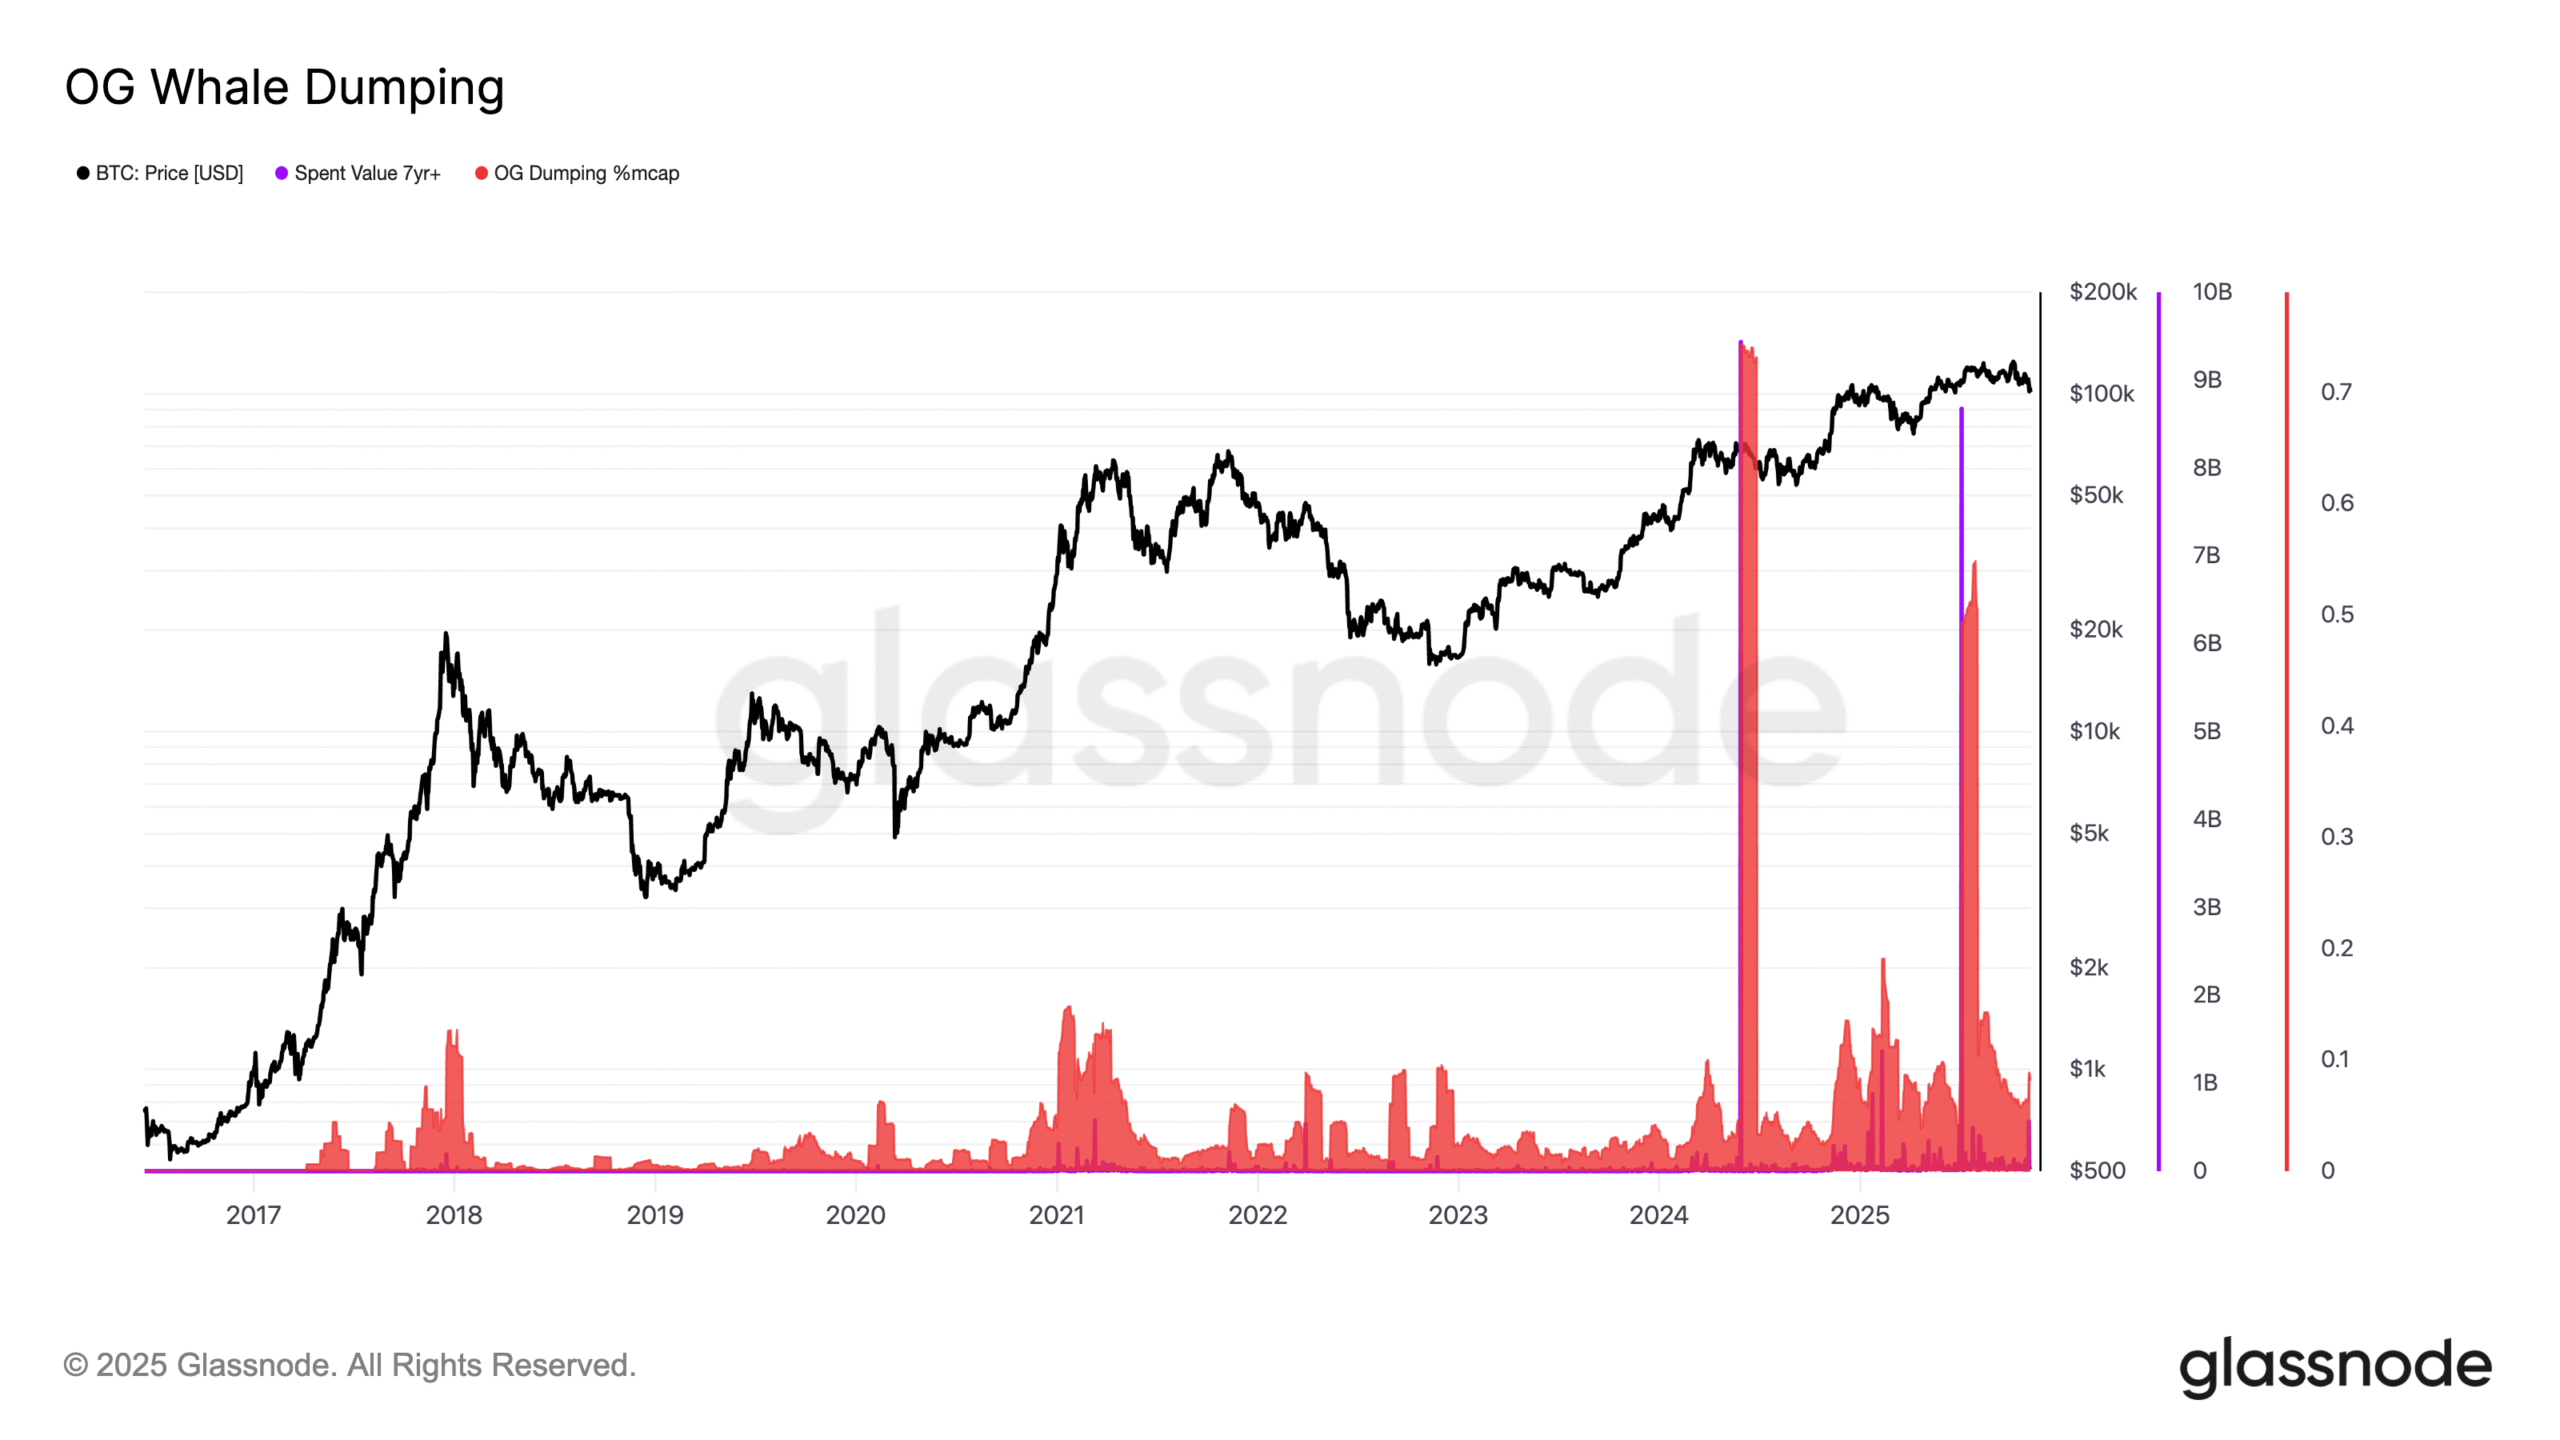
The above can be better visualized by the following new Capriole metric OG Whale Dumping.
This chart shows the sum of OG Bitcoin Super Whales (those that have held more than 7 years) 30 day selling as a percentage of Bitcoin’s total Market capitalization. Every time this exceeds 0.1%, we have been within 2 months of a market top. There has been a ton of OG whale cashing out in 2025.
The Bottom Line
The market is telling us we are passing through a blackout zone as a result of the US government. There’s heightened uncertainty and we can see signs of de-risking across credit and equity markets. The picture will likely be a lot clearer in a months time when the US Government reopens. While there are some equities warning signs, they are not yet significant enough to justify a major derisking. Given the clear Federal Reserve roadmap, we expect equities will continue to perform for the coming months.
For Bitcoin, the picture is not so rosy. While the weight of the evidence today is net bearish, we are open minded to several outcomes as the US Government shutdown draws to a close. If institutions re-enter with force in the coming 3-4 weeks, the picture flips to bullish very quickly with blue skys to $180K. However, if the data looks similar to today in 1-2 months time, we would have significant concerns for Bitcoin. For now, it makes sense to maintain a low risk / no risk Bitcoin posture as the dust settles and as institutions continue to sell Bitcoin. But be ready to re-enter with size when that script flips or should technicals break above $105K with strength as given the deeply discounted onchain data, Bitcoin could move up like a rocket when the institutional demand structure changes.
Those that have weathered a couple Bitcoin cycles will know, it is simply not worth assuming or hoping for the best when the data presents as it is today. Why? If you are lucky, you wake up in 2 weeks with a drastically different and positive picture. If not, you could wake up 6 or 12 months with prices 30-50% lower, still hoping.
As always we must be fluid and agile in this fast moving market.

Charles Edwards
Recent Press and Podcasts
- On CNBC: Why there could be a digital asset treasury bubble
- On Bitcoin Archive: The $19B forced selloff and why Charles is sounding the alarm
- At TOKEN2049: Double threat: The Treasury Company Bubble and Quantum Computing
- Forbes Collab: Is Bitcoin ready for Q-Day?
- On Forbes: Forbes notes our TOKEN2049 presentation as the top conference trend
- On Real Vision: Why this Bitcoin cycle is so different