

Simple logic leads us to deduce that the parabolic advance in Bitcoin Treasury Companies will not be sustainable forever.
At some point the market will reach saturation as too many Bitcoin treasury companies meet too little tradfi capital market demand.
Several forces are working against this trend in the long run:
- Bitcoin’s supply is capped. The Bitcoin “yield” that treasury companies boast is diminishing by nature of the limited supply 21 million coin supply. All Bitcoin treasury company yields trend down over time.
- Every incremental treasury company is competing against 156 others (and growing). What is each’s incremental companies value proposition and point of differentiation? Short answer: not a lot. Treasury companies need a unique strategy, brand and access to capital markets to compete. Otherwise, why wouldn’t an institution just buy the ETF?
- mNAV premia is reflexive. When treasury companies have higher market caps than the value of their Bitcoin (high mNAV) they can easily raise capital by issuing stock (accretive). When mNAVs fall (below 1) they can become value traps and consequently be incentivized to sell Bitcoin and buy back stock. Falling mNAVs in a broader Bitcoin downtrend is a death knell for many treasury companies whose businesses were already languishing.
Today there’s 156 public companies with Bitcoin on the balance sheet.
The million dollar question is: how many is too many?
Let’s take a look a 8 proprietary metrics to gauge where the risk of a treasury company unwind is today.
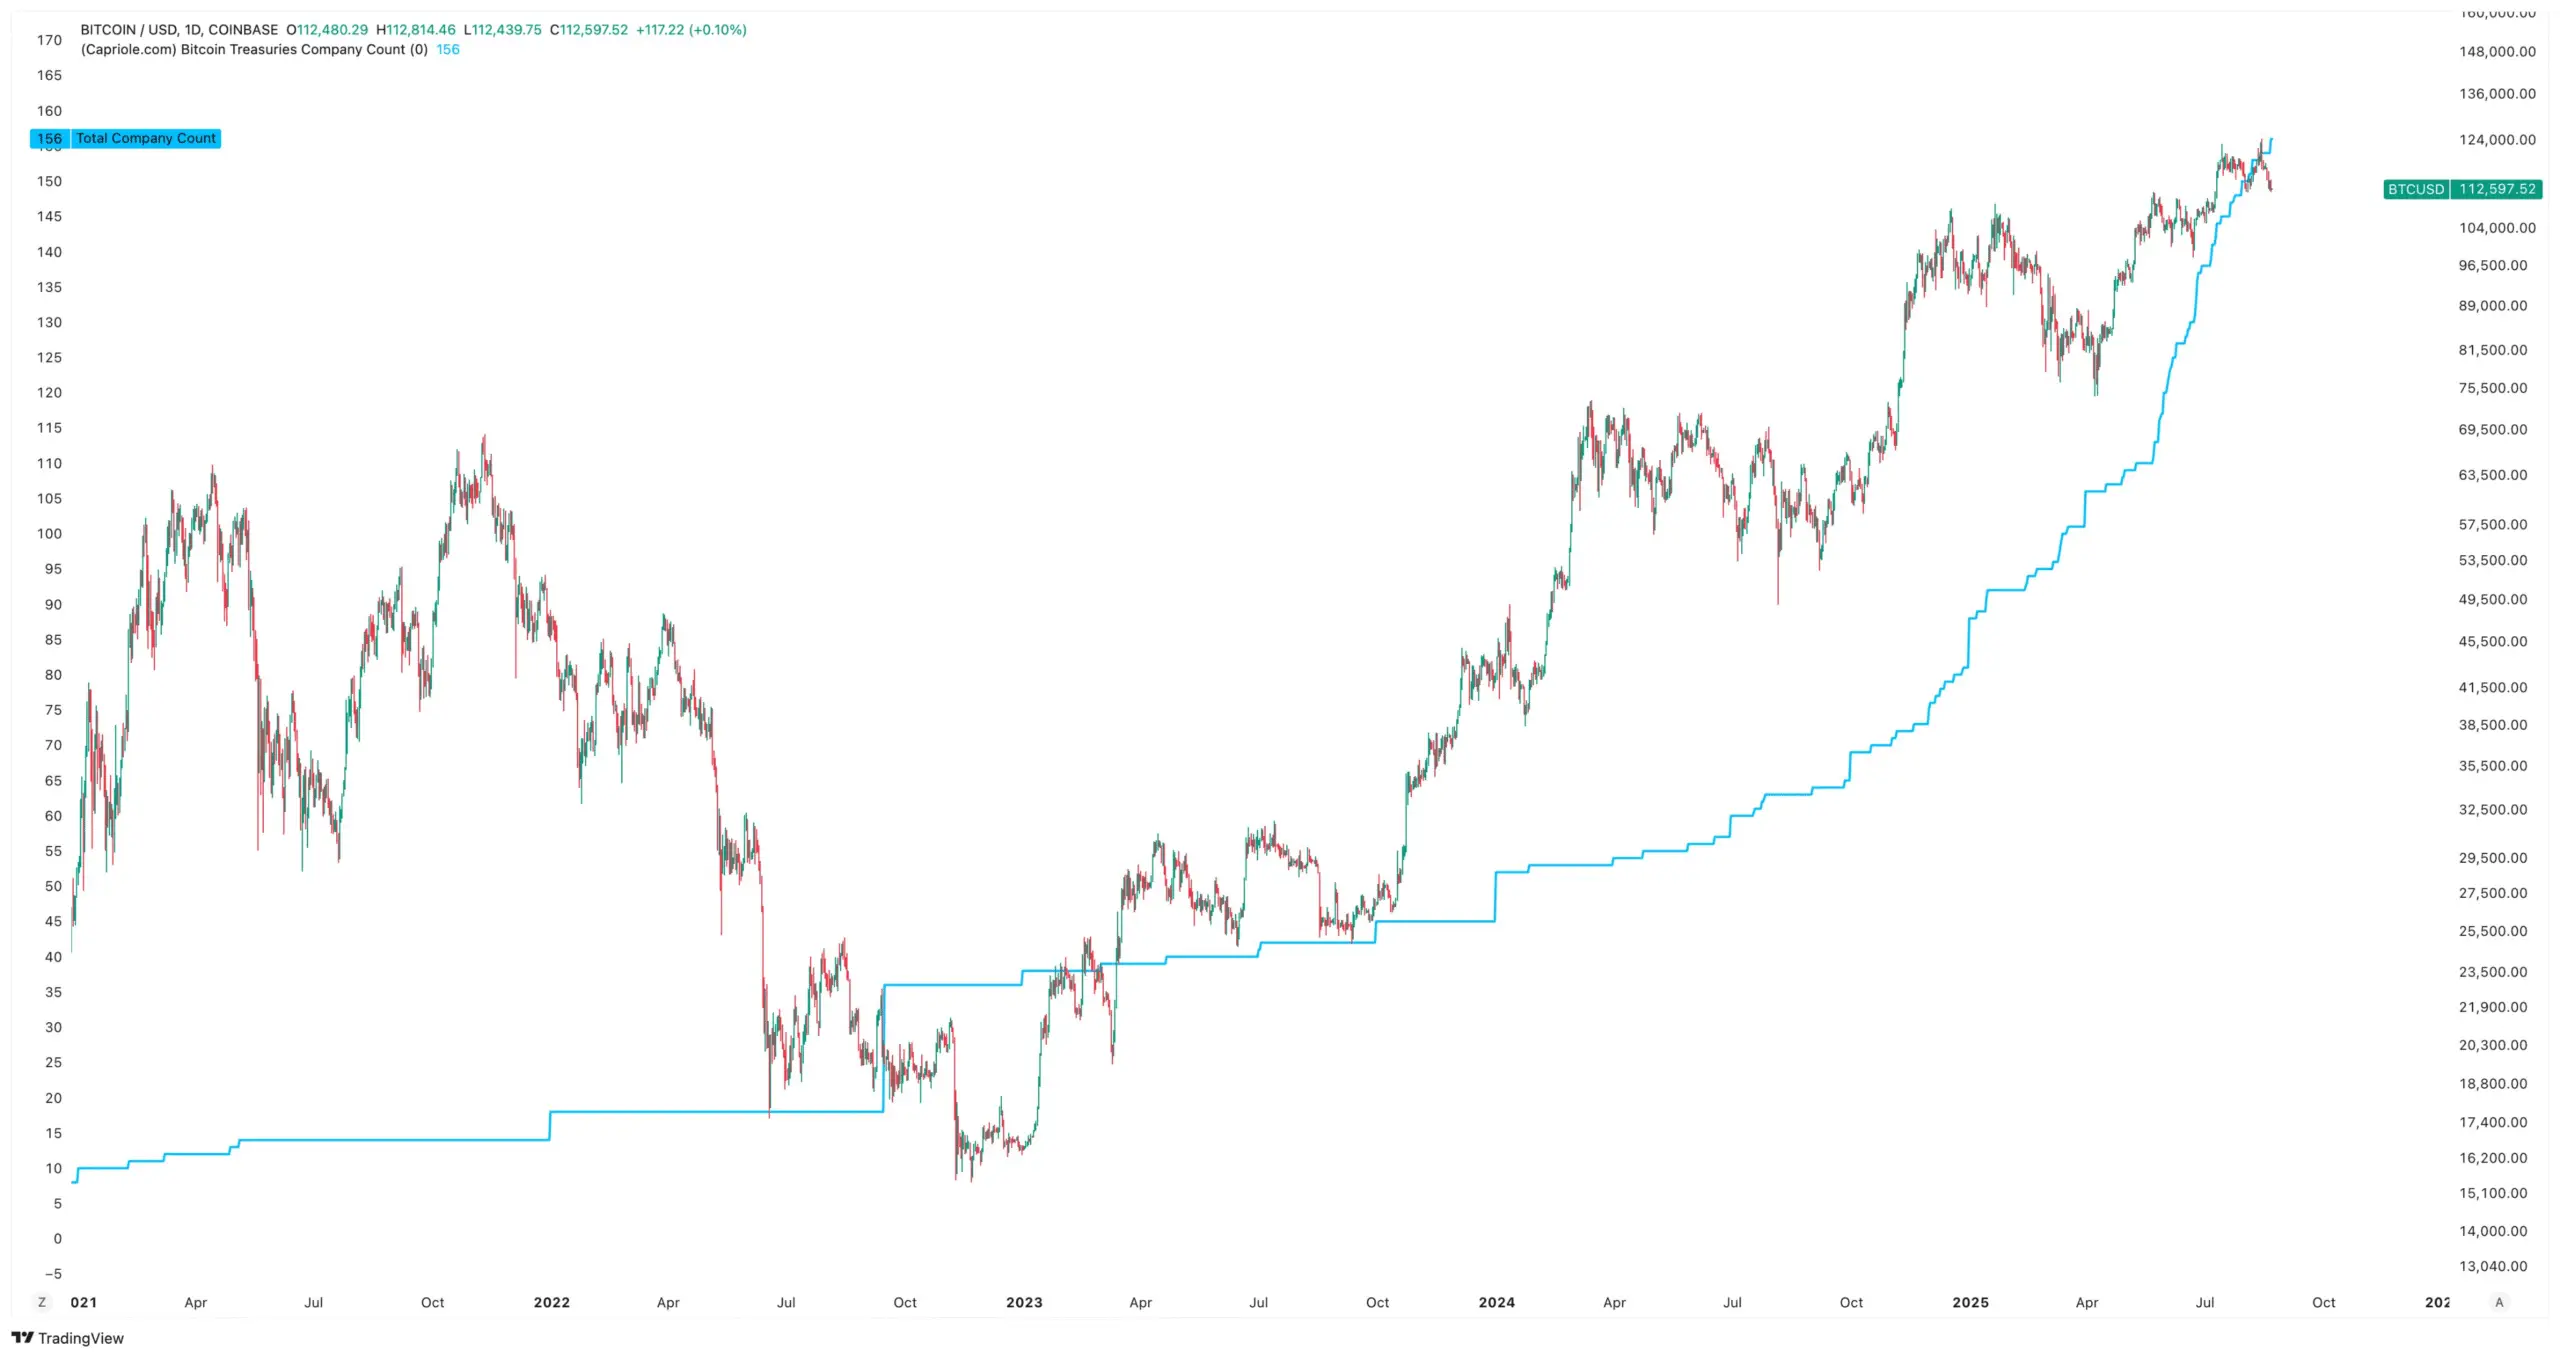
156 public companies have Bitcoin on their balance sheet today. Source: Capriole Charts
Metric 1: Institutional Buying (% Market Cap)
Institutions were recently buying up 600% of the daily Bitcoin mining supply, but today it’s dropped to 400%, the lowest since March. 400% is still a lot. But did something change?
Keep your eyes peeled. If this metric continues to decline (especially if it falls below the daily Bitcoin mining issuance), there would be significant cause for concern.
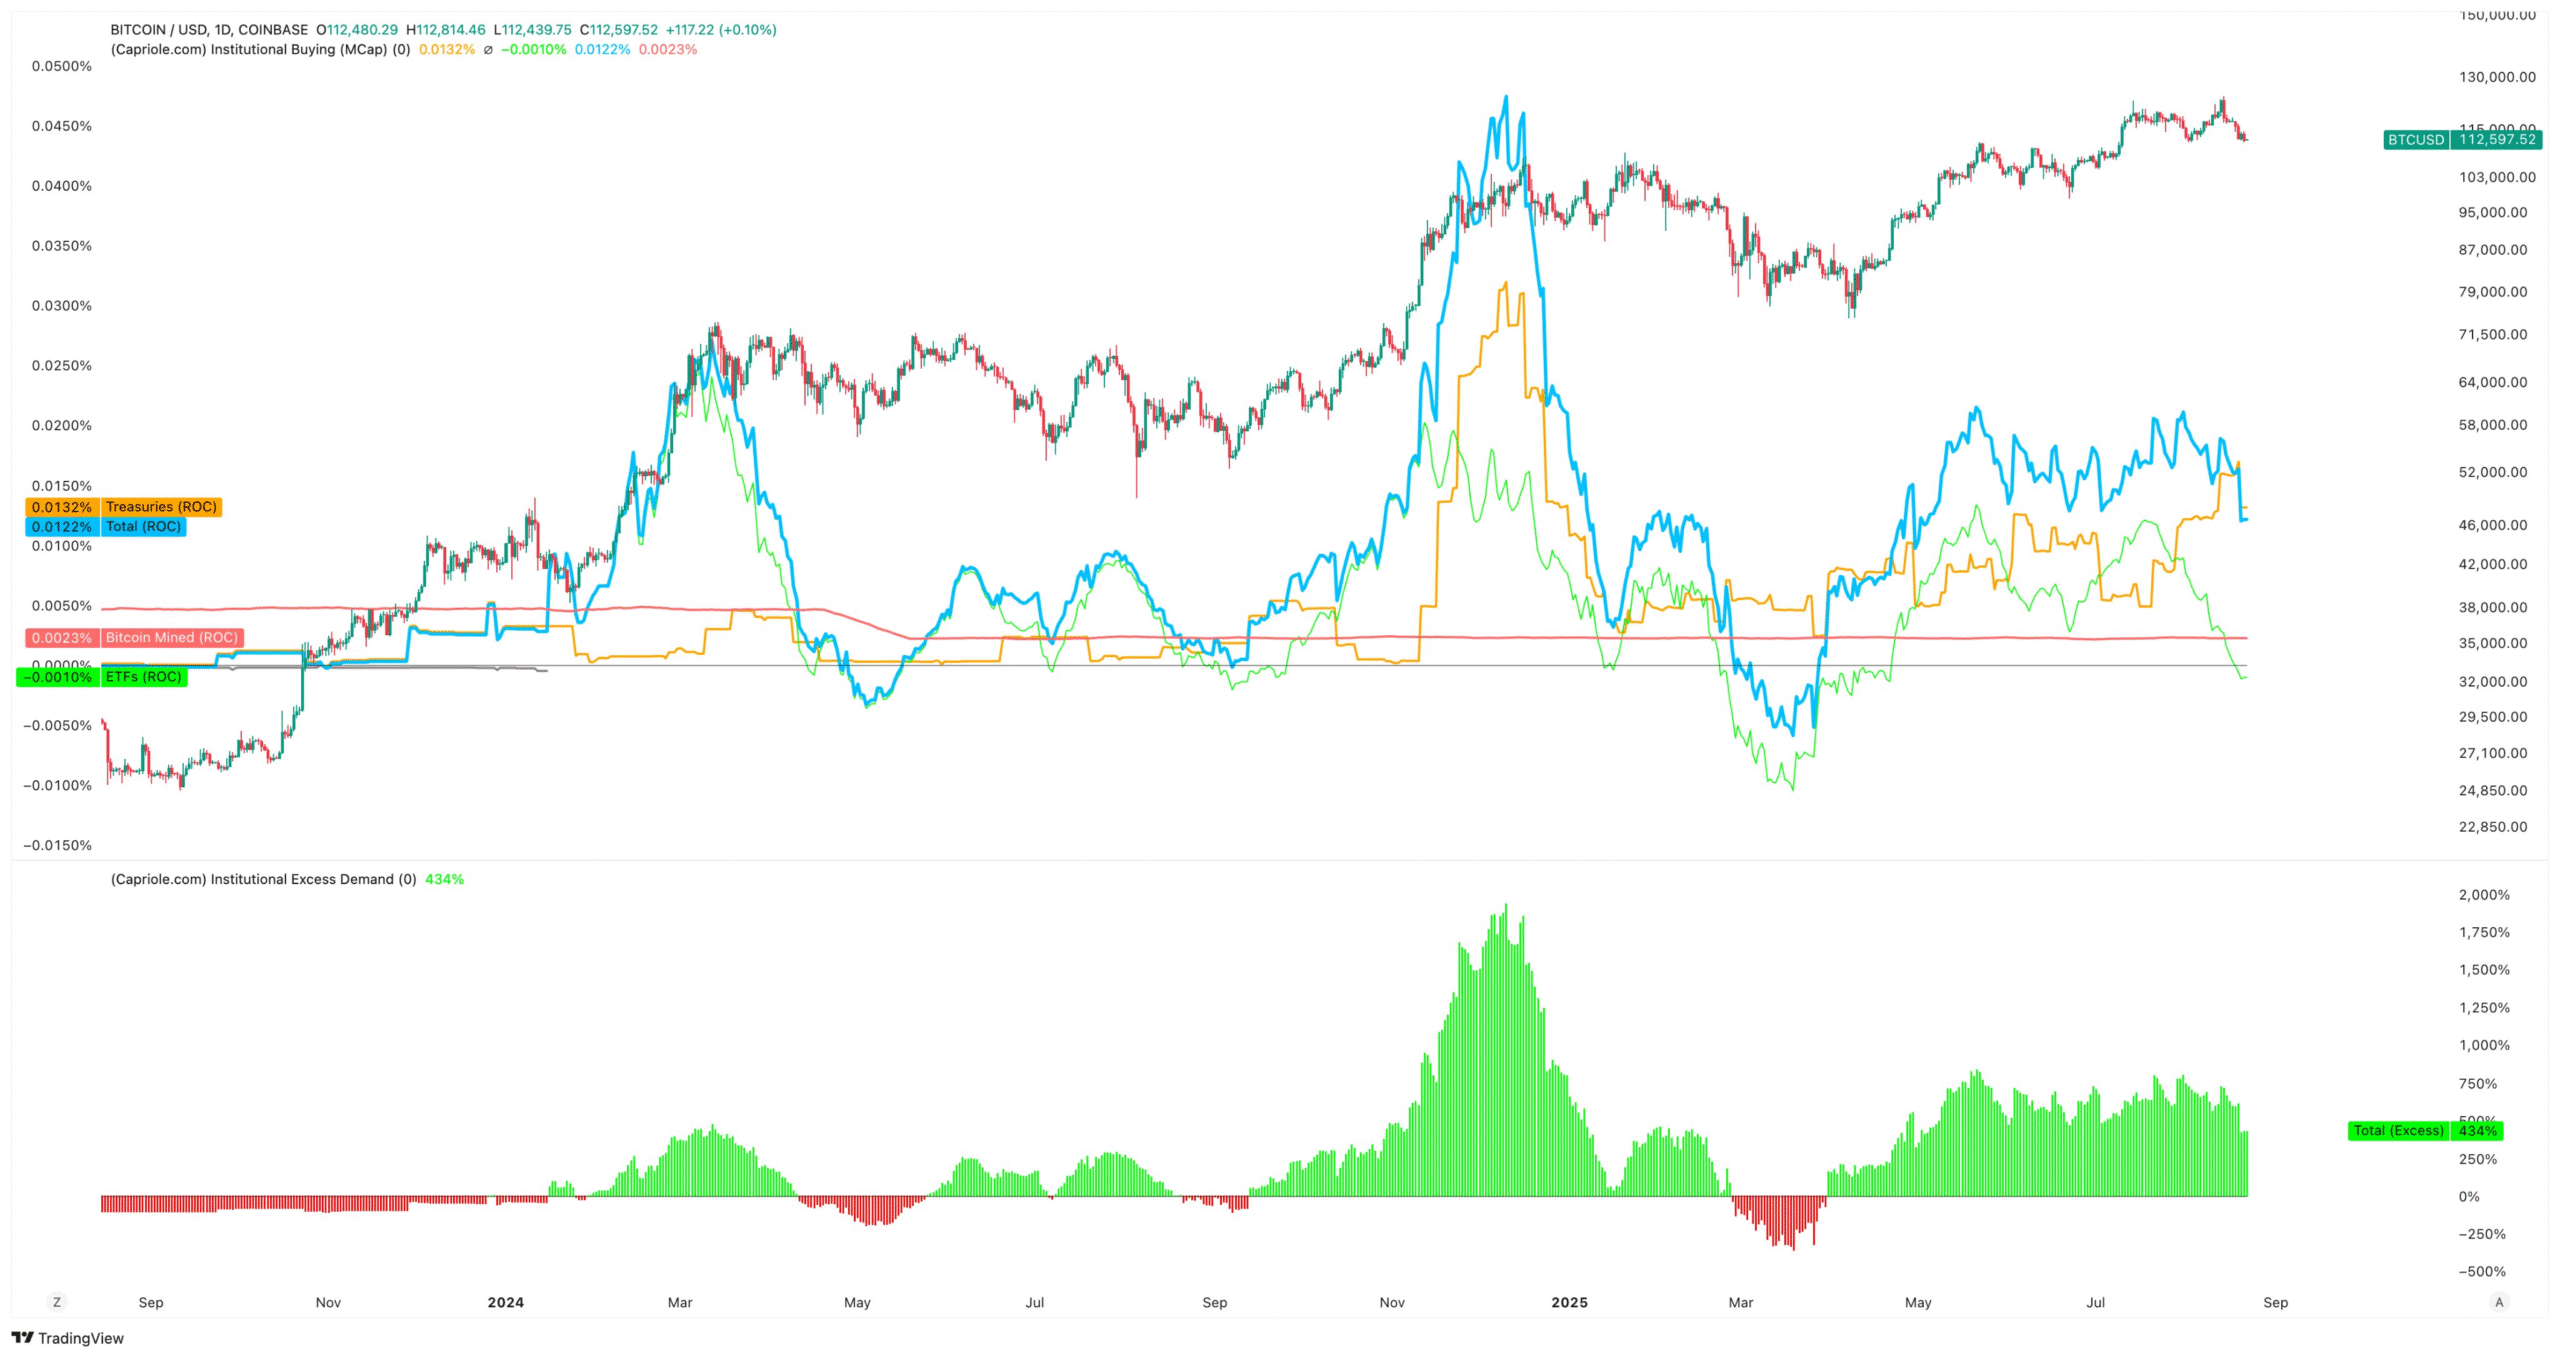
Institutional buying still represents 4X the daily Bitcoin supply mined. Source: Capriole Charts
Metric 2: Institutional Buying (% Coinbase Volume)
Share of Coinbase volume remains high, but has just fallen to 38% from the 50%+ range of the last months. The last time we were here, Bitcoin was at $85K. This could be a short-term dip, but a conservative approach would be to await further breakout institutional buying volume.
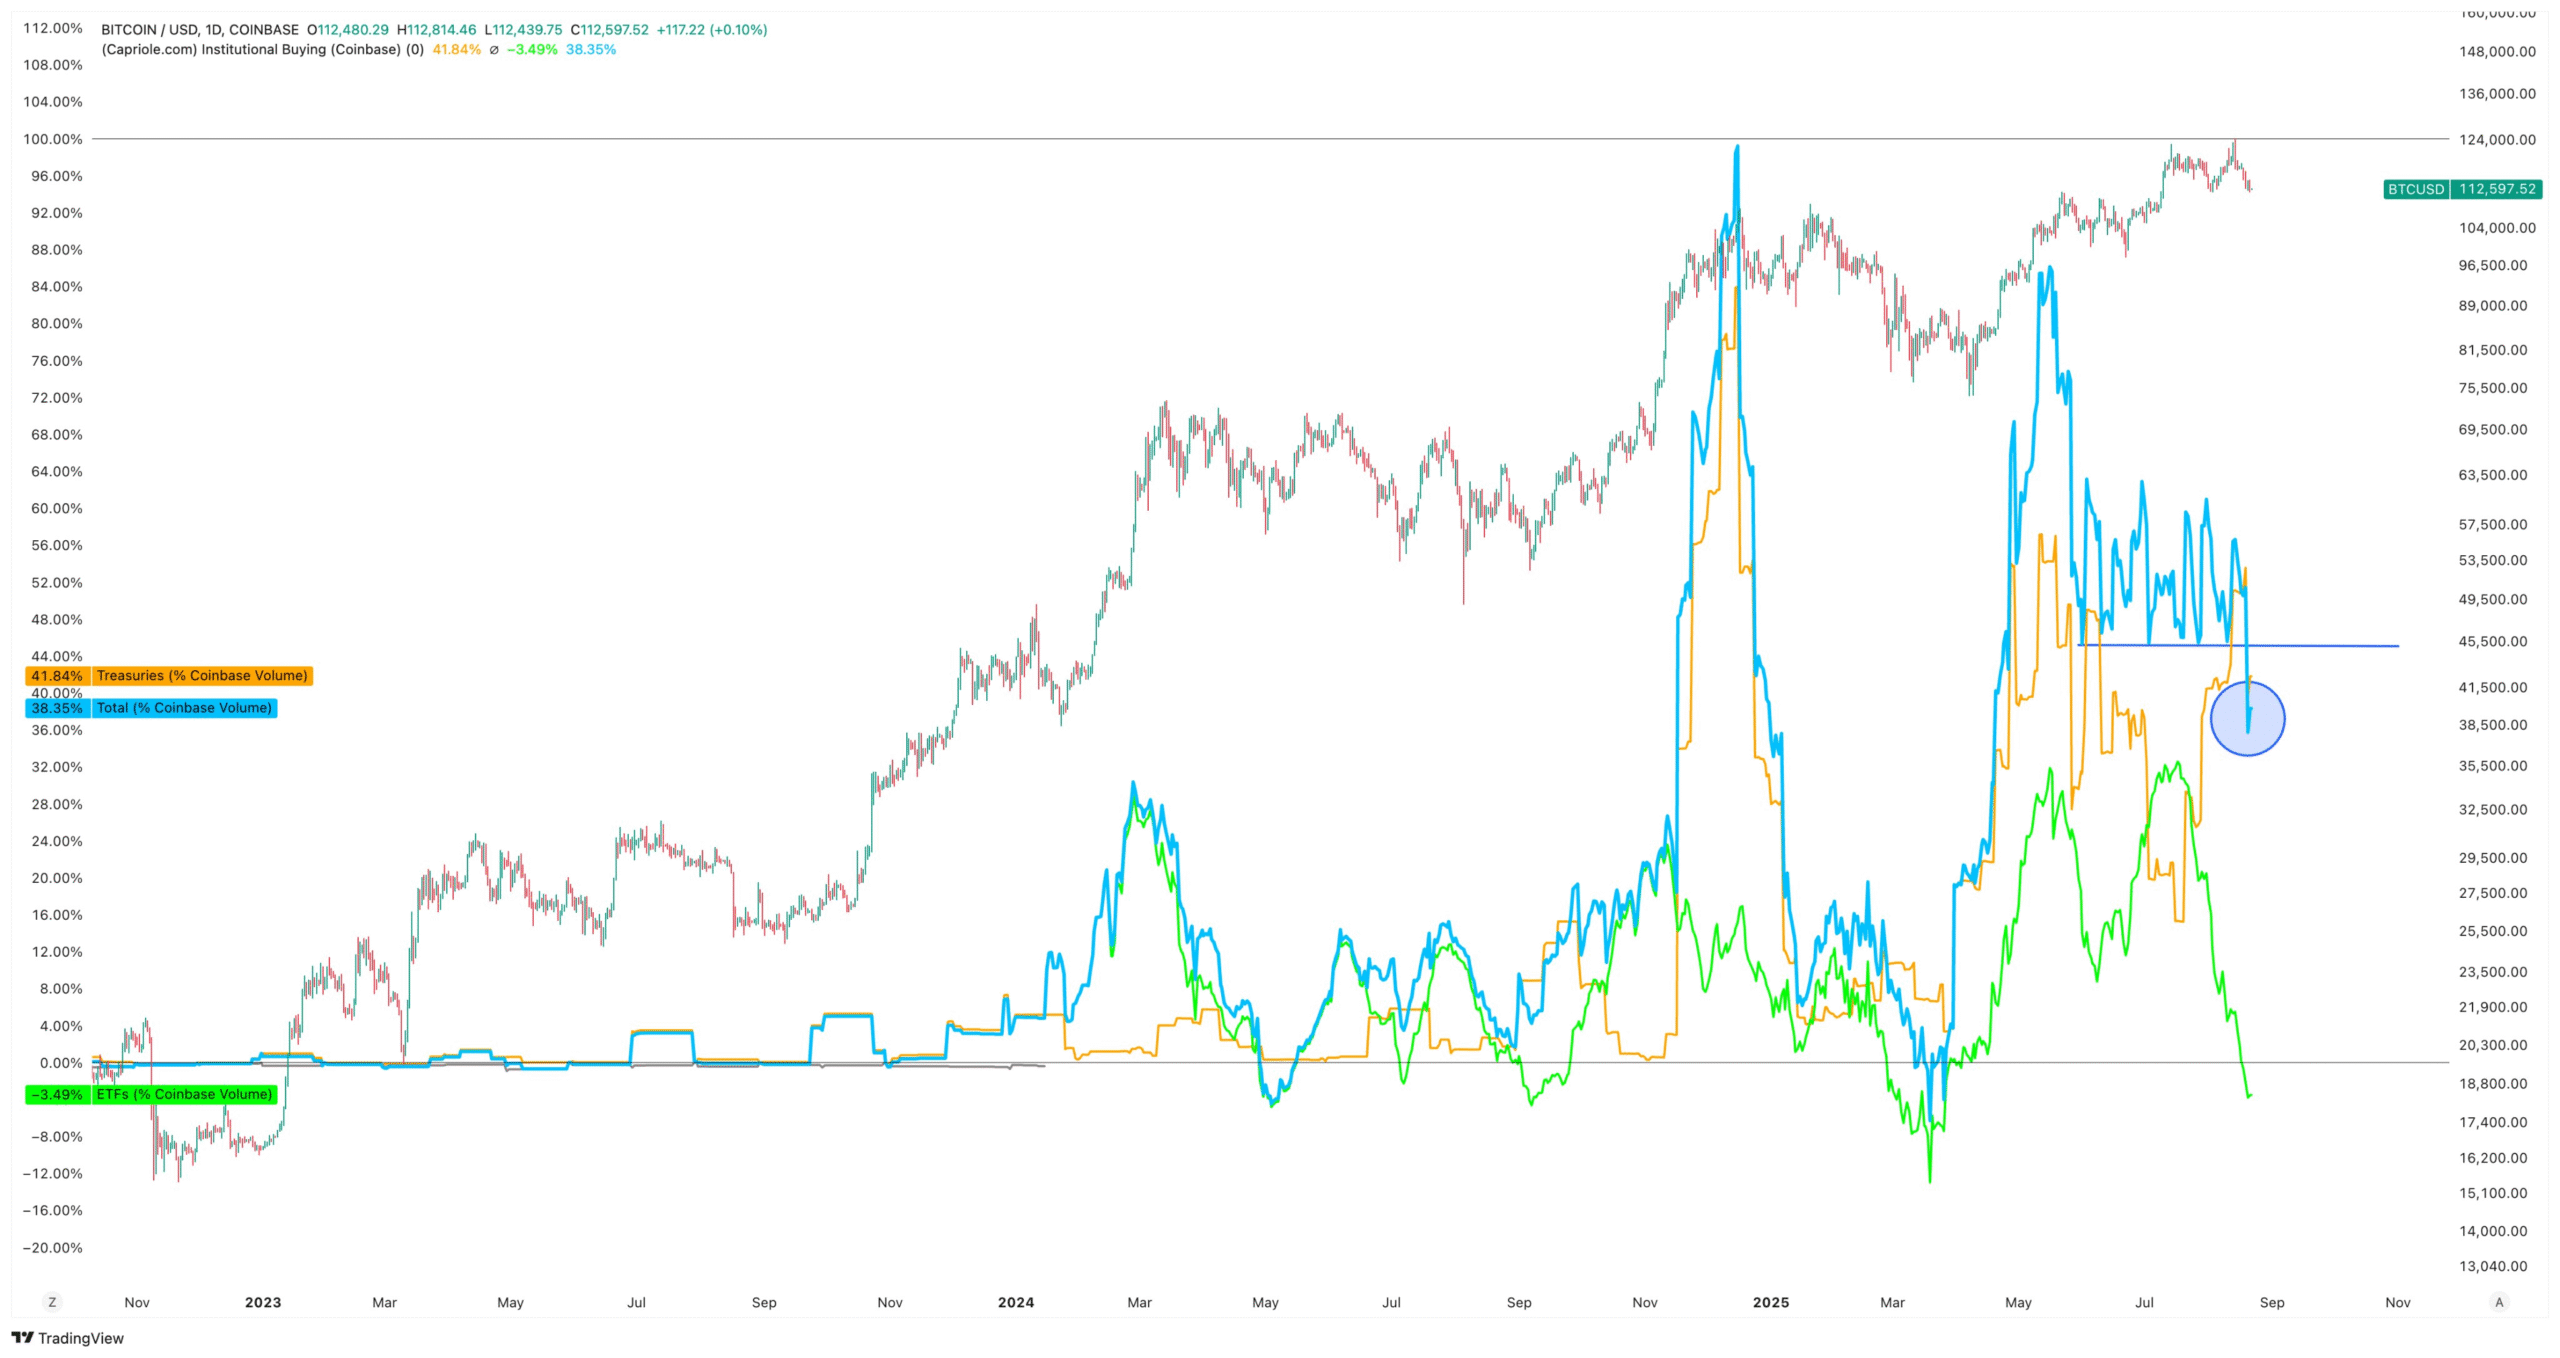
Institutional Buying (% Coinbase Volume) is at its lowest level since $85K. Source: Capriole Charts
Metric 3: Treasury Companies Buyers
The average number of companies buying Bitcoin per day is falling, but is this just a local dip or an early sign of market saturation?
We’ve seen dips like this before that have quickly reversed (circled below) but none from such a high point. It’s too early to tell if this is a local top, but strength could easily proven by a strong bounce up in this metric. Until then, this is starting to look weak.
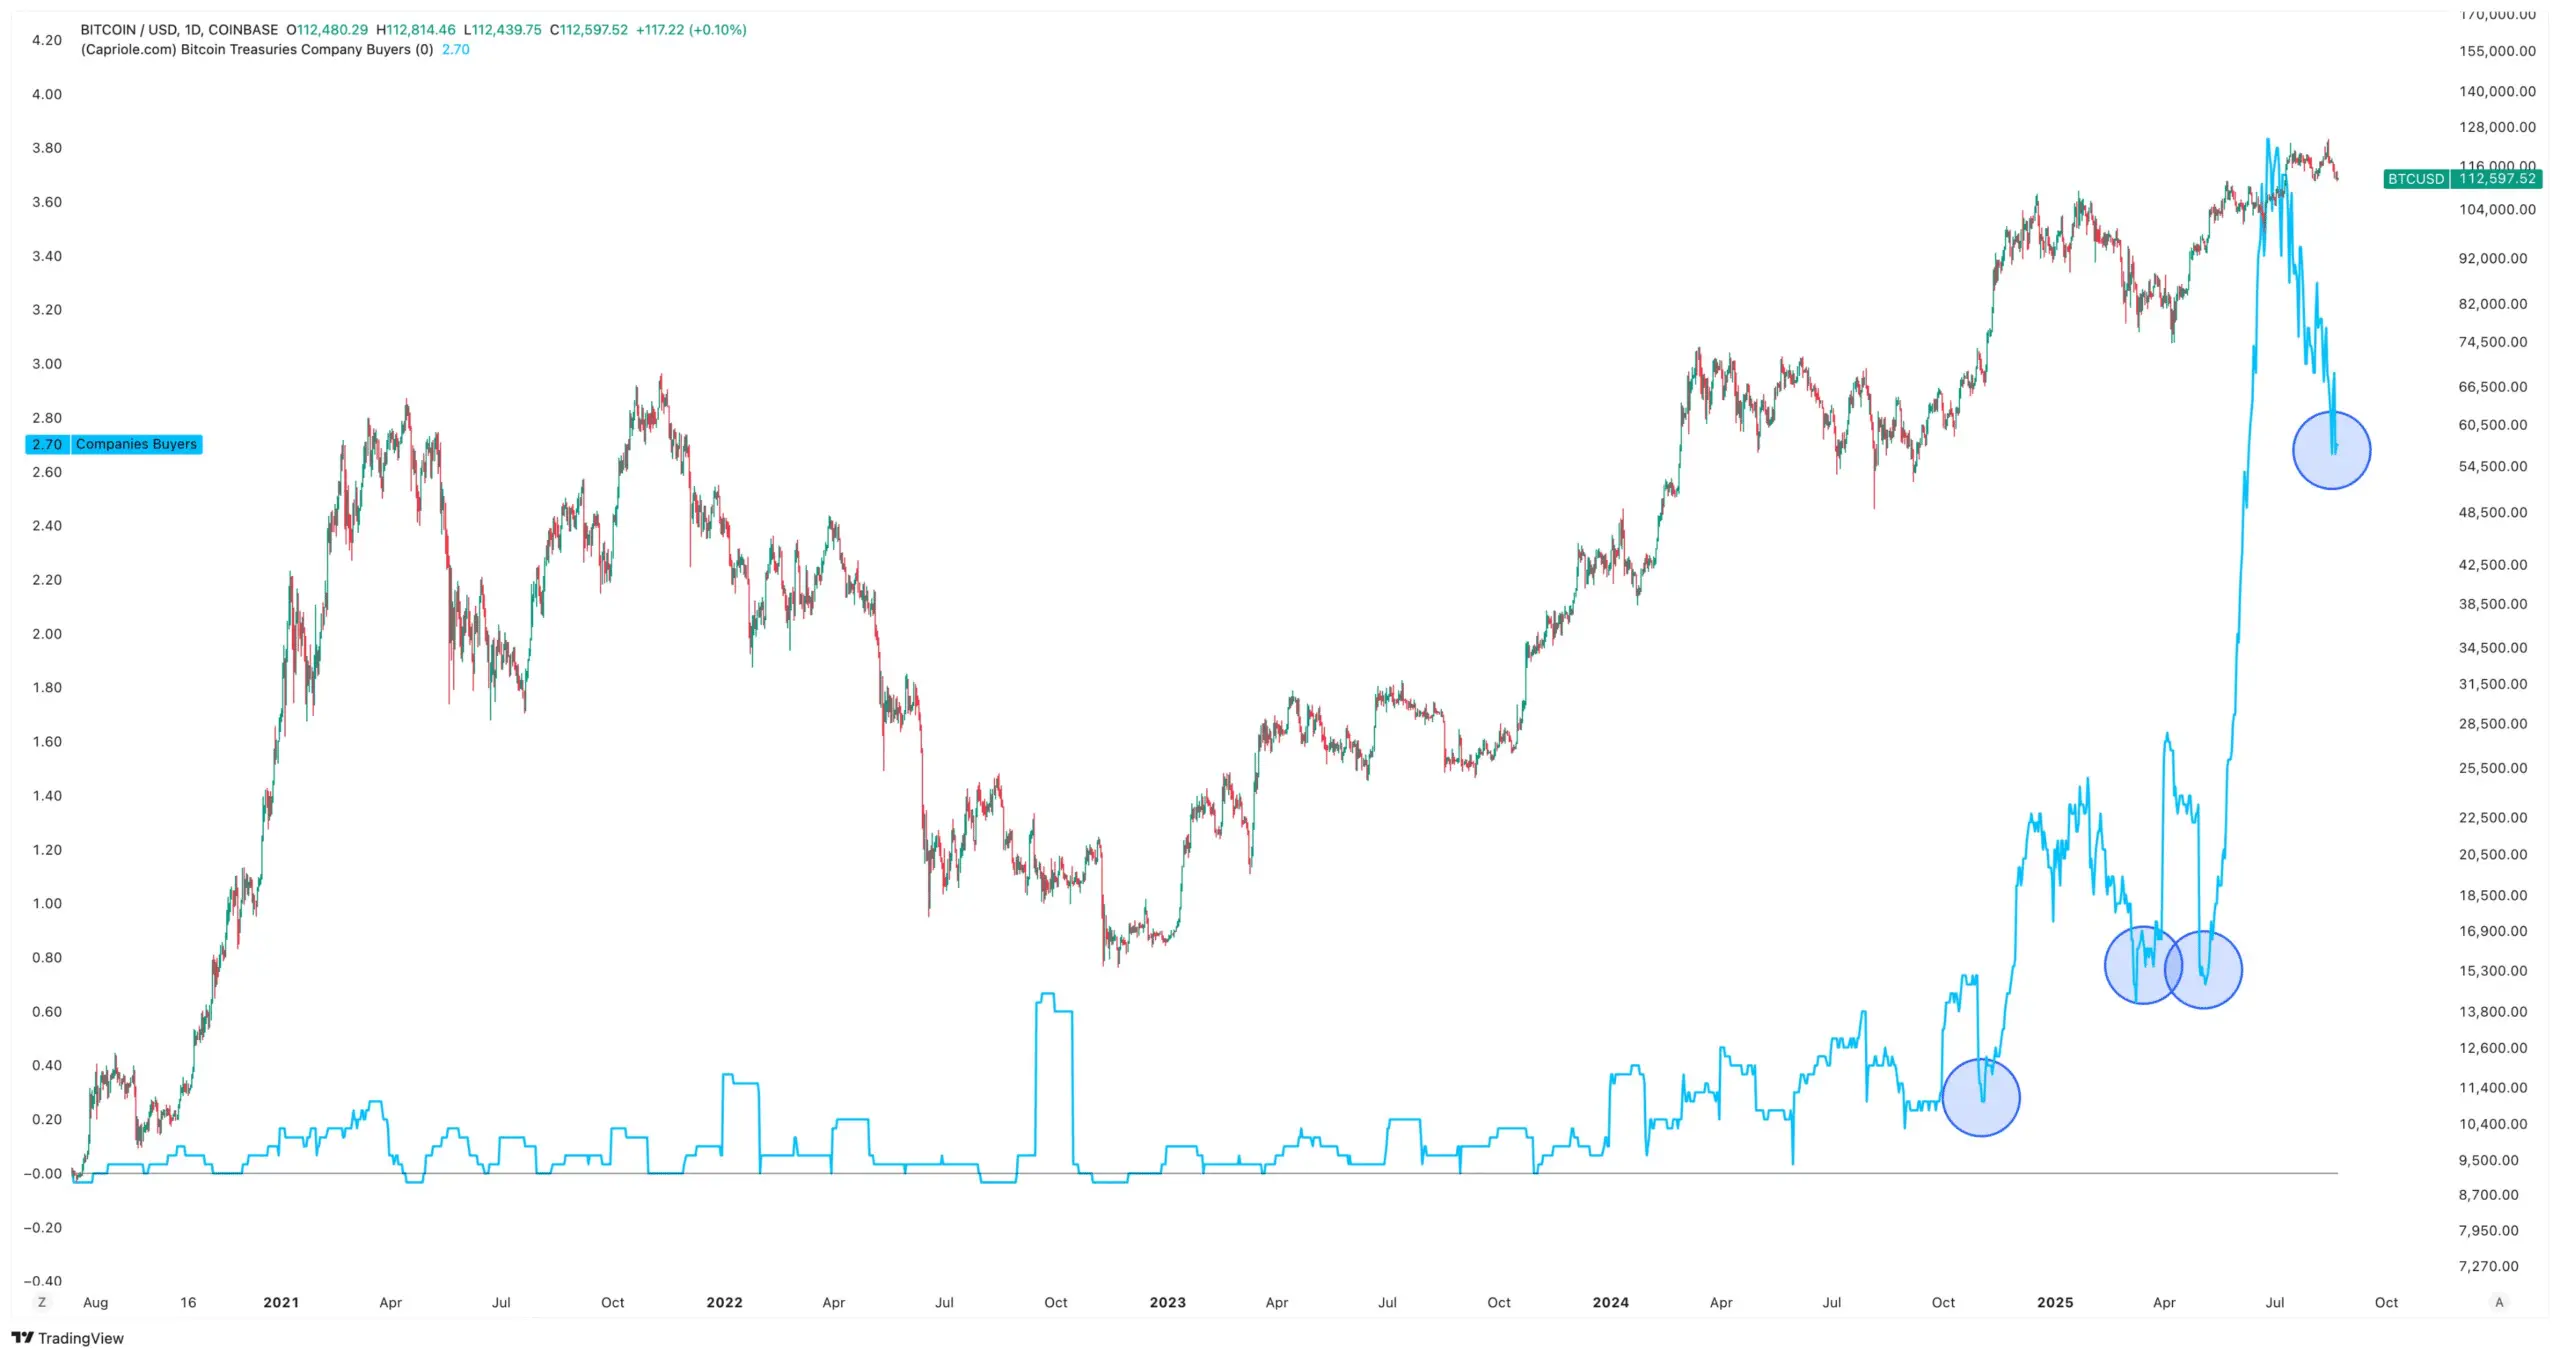
2.7 companies are buying Bitcoin per day on average. Historically incredible. But we are starting to see a concerning drop since June. Source: Capriole Charts
Metric 4: Treasury Company Percent Buyers
On the positive side, the percentage of transacting treasury companies that are net buyers of Bitcoin is very high, 93% today. This is a very important metric to monitor for signs of changing risk and sentiment.
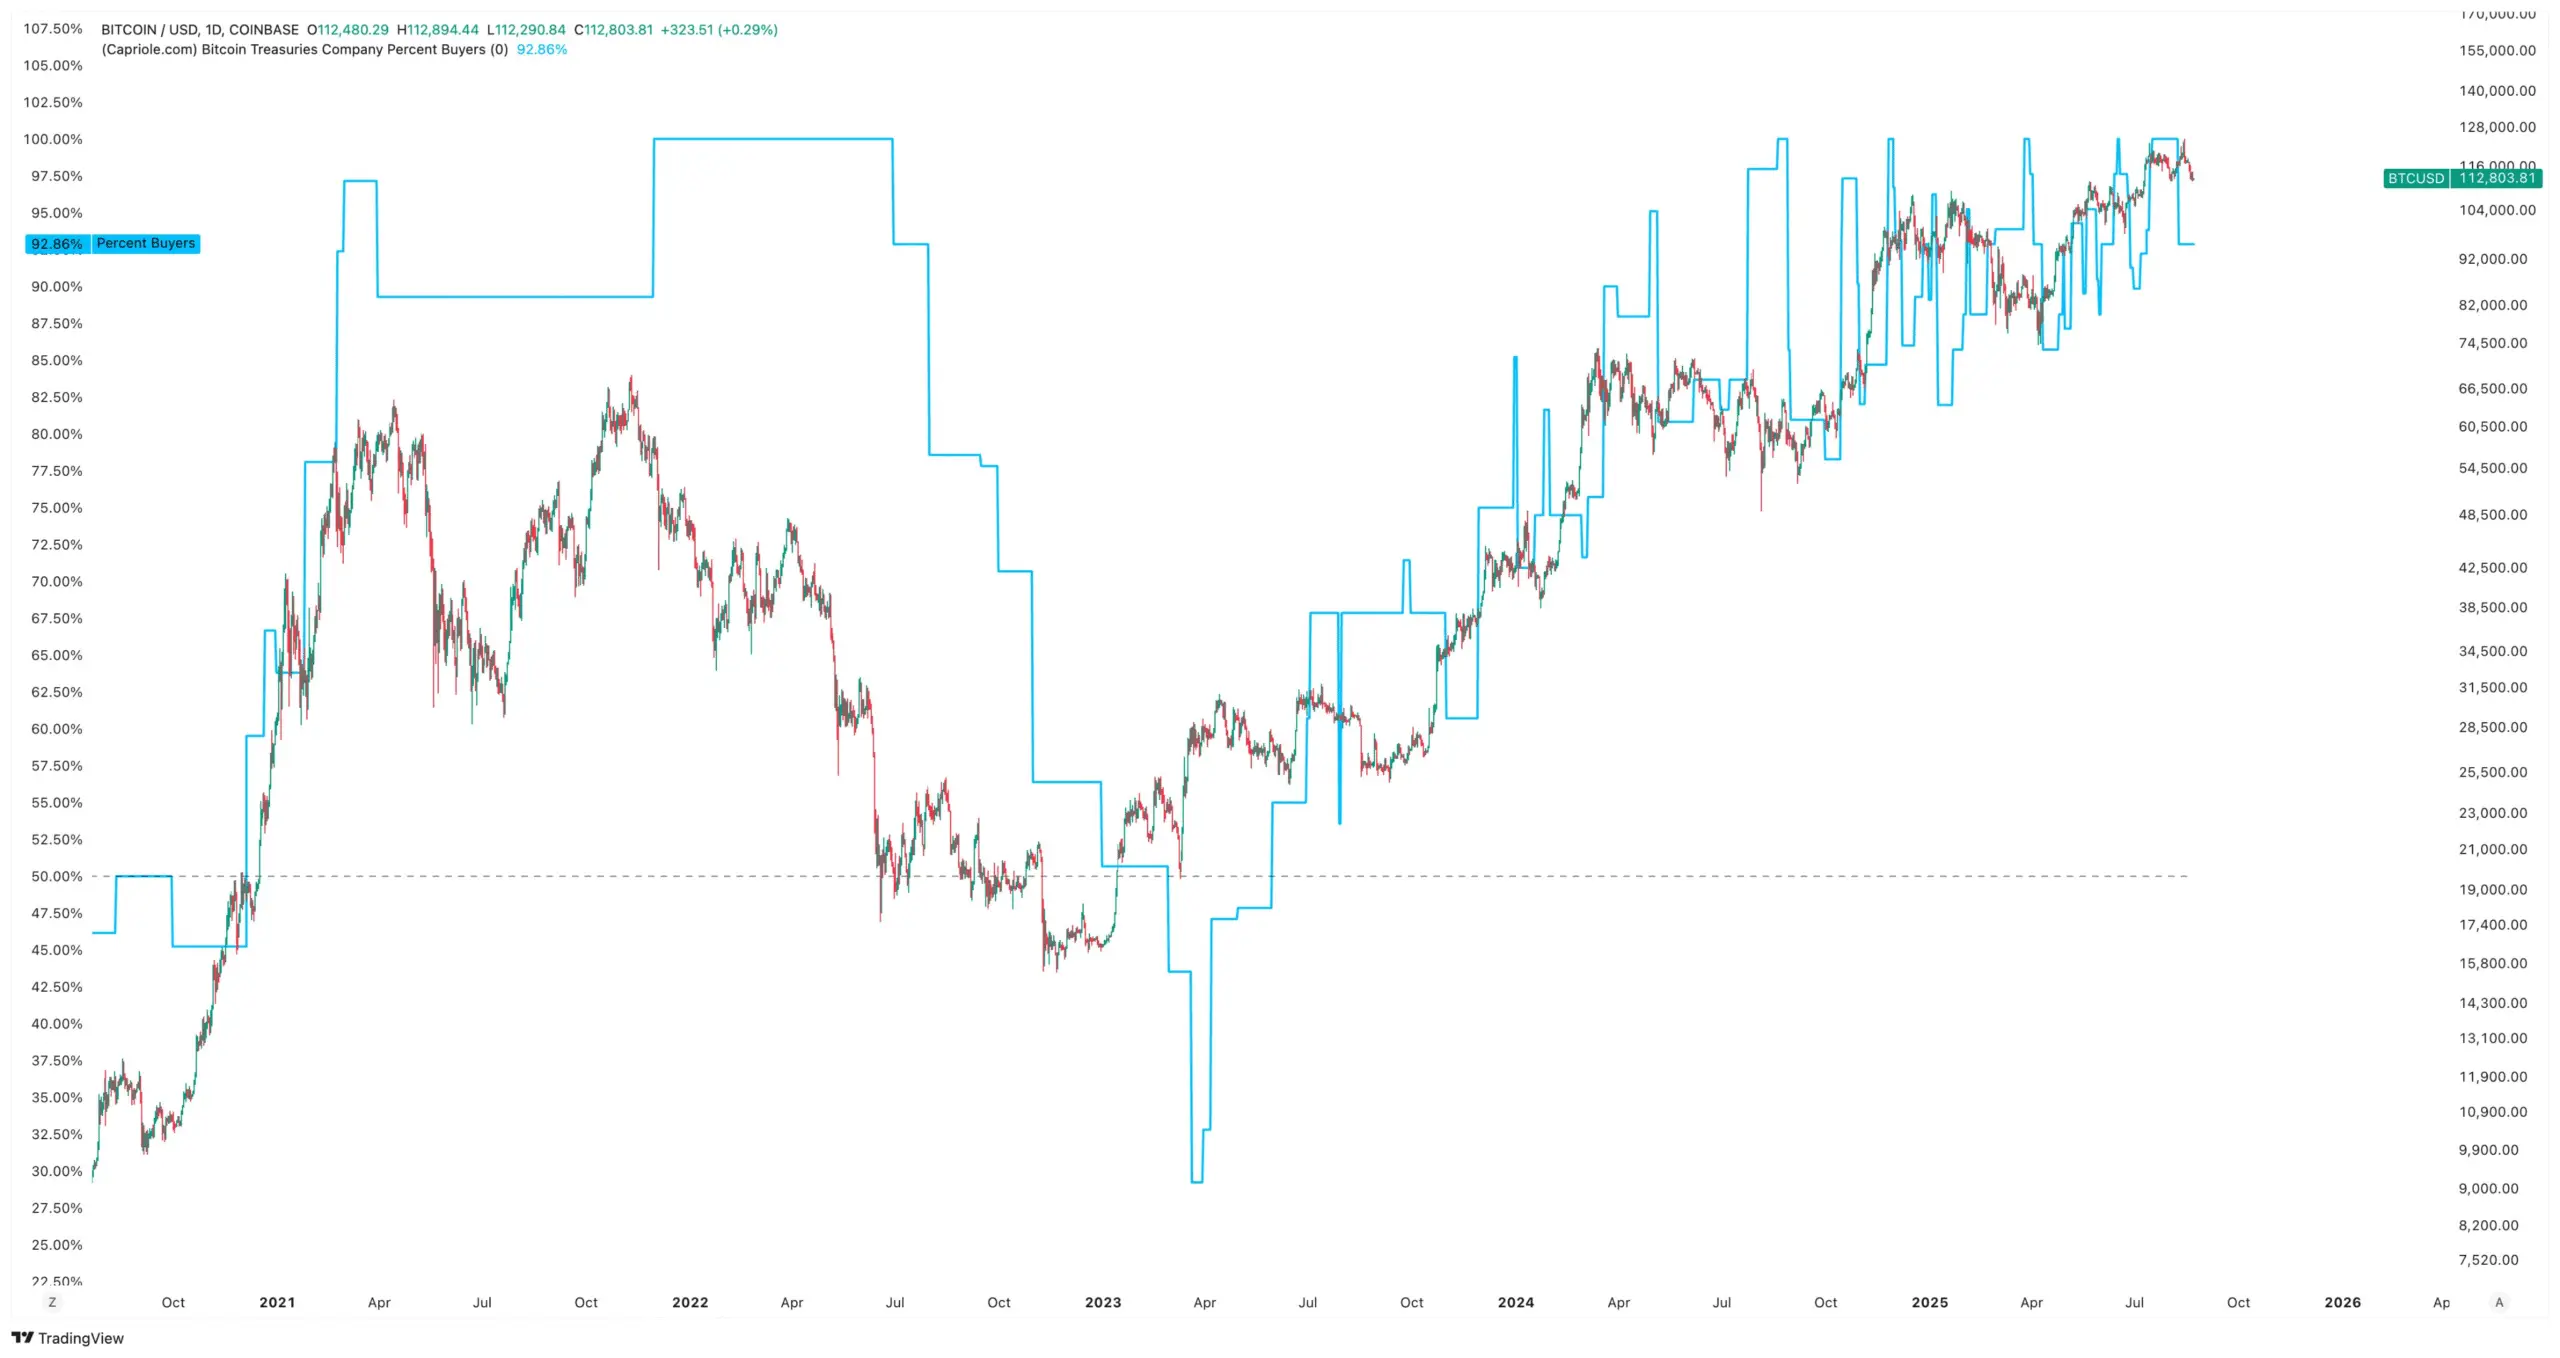
A whopping 93% of treasury companies are net buyers of Bitcoin. Source: Capriole Charts
Metric 5: Treasury Company CVD
Treasury Company buy/sell cumulative volume delta (CVD) is also at a healthy level, suggesting this may just be a mid-term pull back in Treasury Company buying behaviour. To be determined.
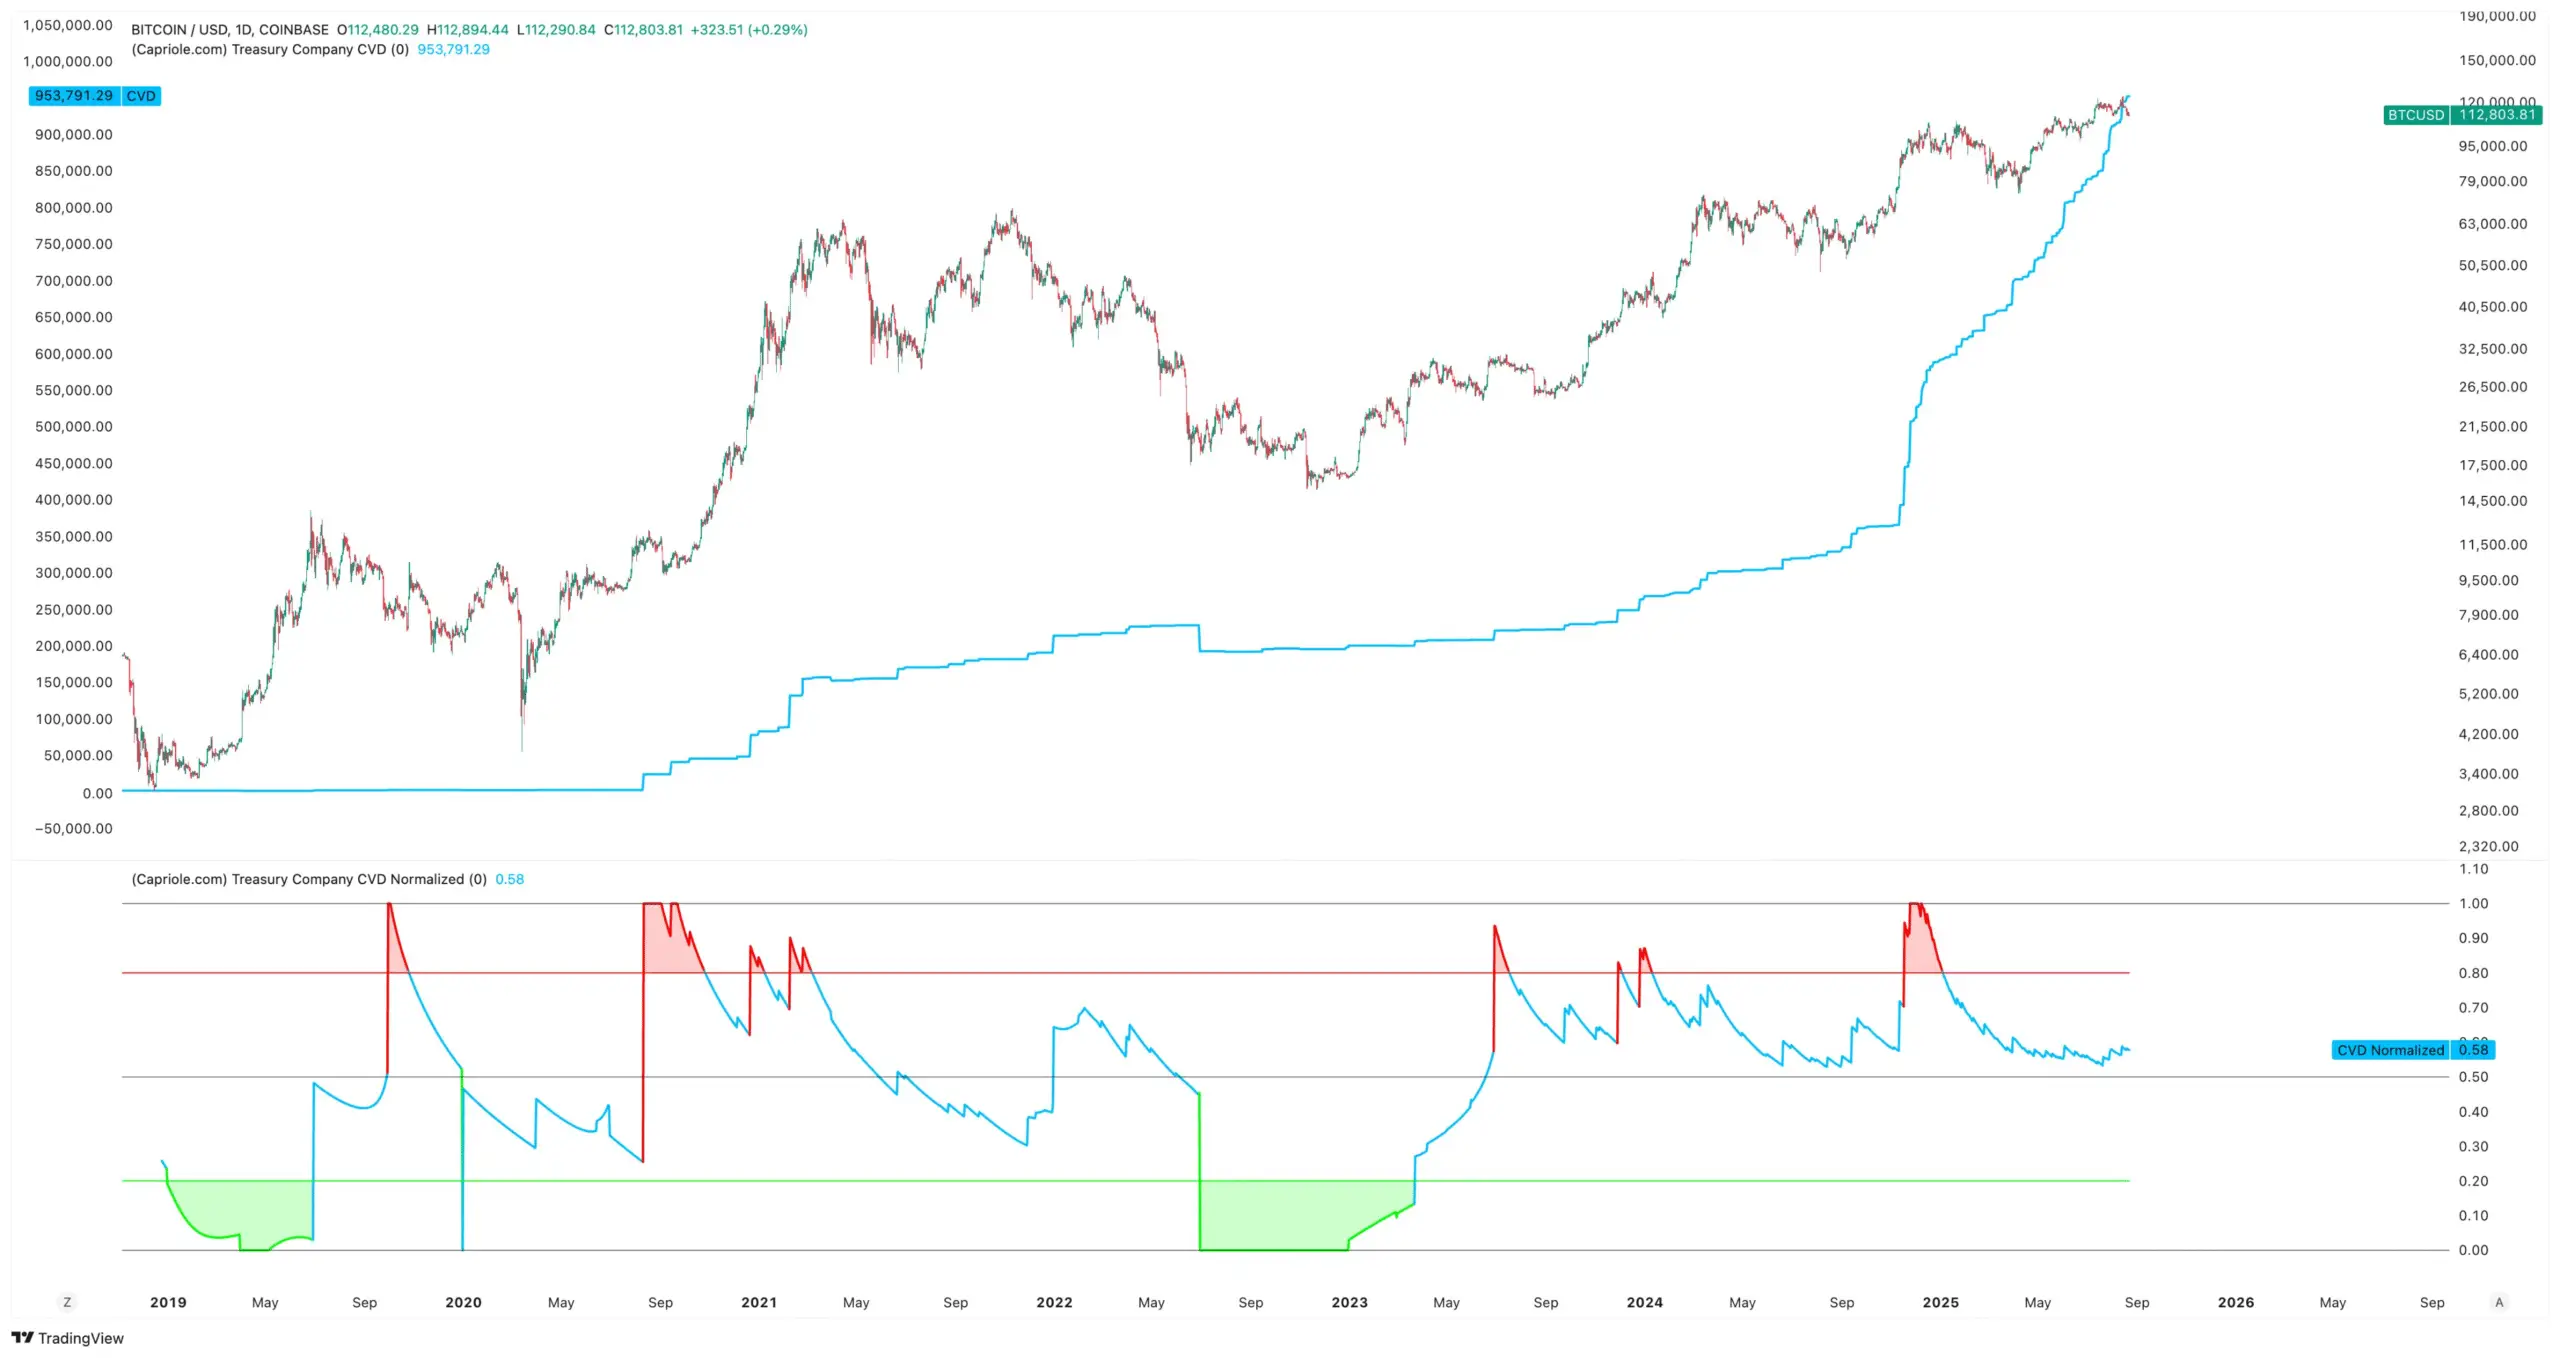
Treasury Company CVD is in the neutral zone. Watch for the next move to the extremities. Source: Capriole Charts
Metric 6: Treasury Company mNAV Percentiles
This is concerning. The percentage of treasury companies with mNAV below 1 just spiked to an all time high of 27%. This means a growing number of companies have market capitalizations less than the value of their own Bitcoin holdings. mNAVs under 1 mean issuing stock to buy Bitcoin is dilutive (bad) and if the situation persists they may be incentivized to buy back stock, possibly by selling Bitcoin. Definitely an important metric to watch short-term as a leading indicator for tradfi capital raising exhaustion.
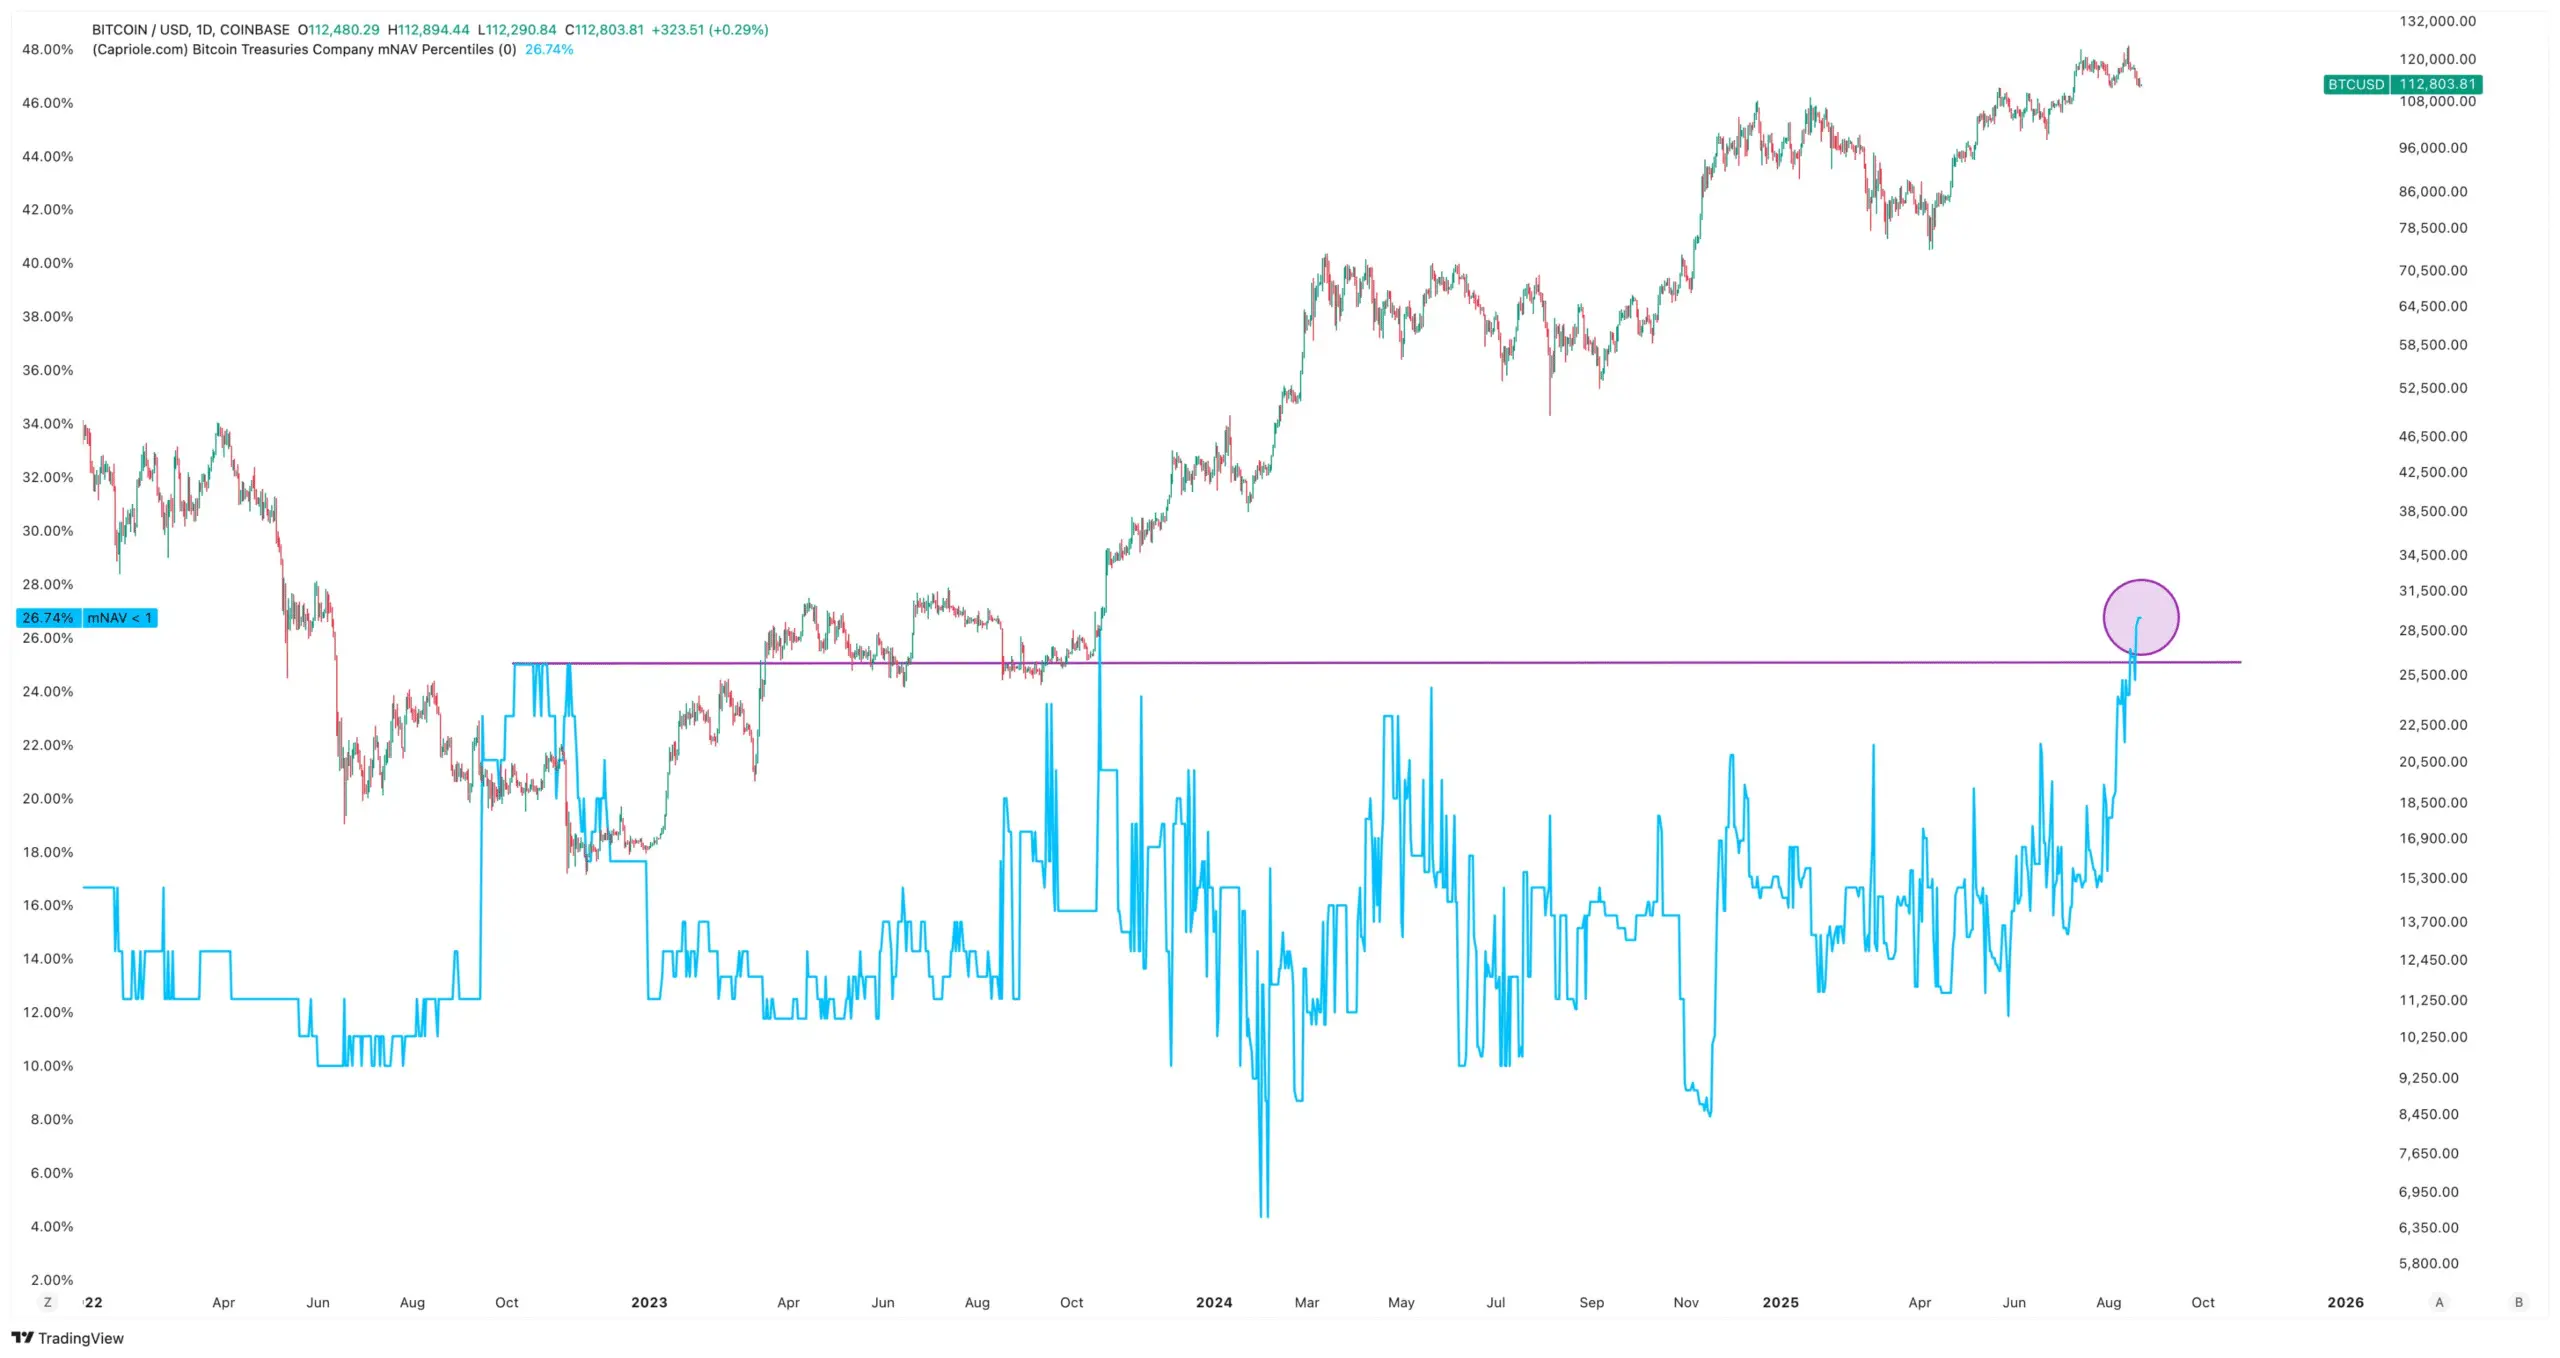
Perhaps the most concerning chart here. 27% of treasury companies now have mNAVs less than 1. Source: Capriole Charts
Metric 7: Treasury Company Mean mNAV
The Mean mNAV of treasury companies has also dropped to an all time low. Still a lofty 2.7. Ideally this would spike back up on growing institutional interest in Bitcoin.
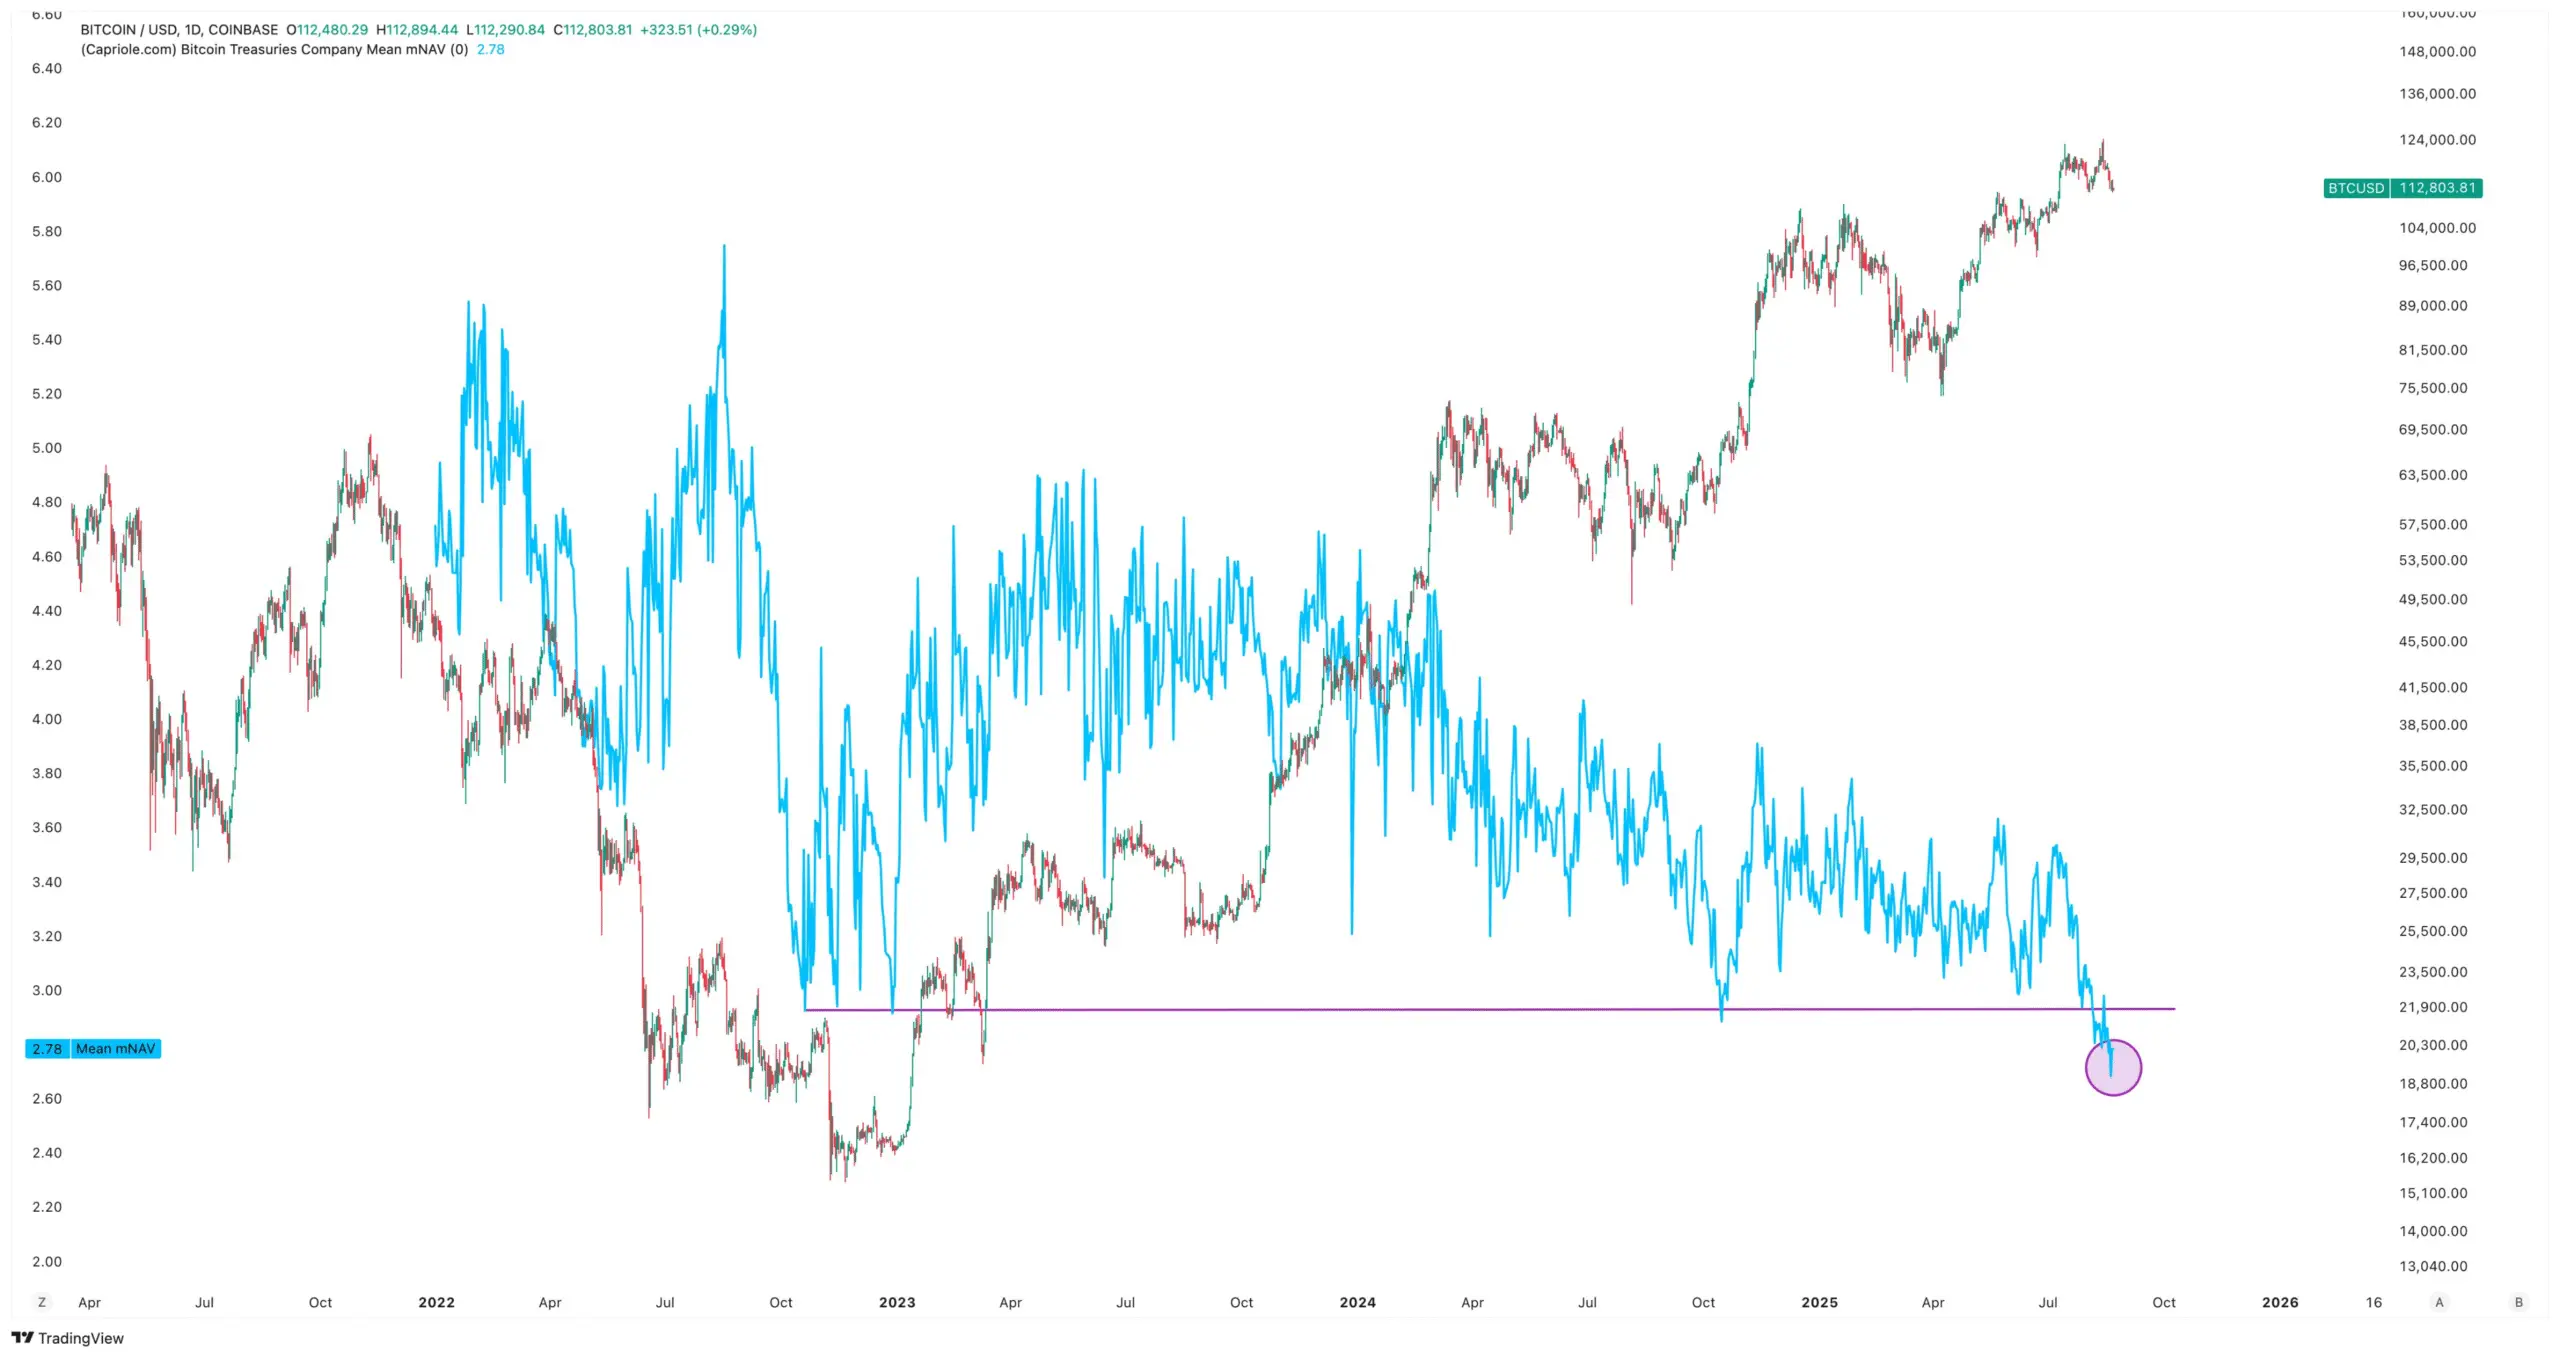
Treasury Company Mean mNAV just hit an all time low. Source: Capriole Charts
Metric 8: Treasury Company Mean Days Cover
Finally, Mean Days Cover (MDC). Mean Days Cover represents the number of days it will take the average treasury company to justify its market capitalization based on its current Bitcoin yield. Lower MDC is in theory better for investors, as they can expect a treasury company to justify its market cap in a shorter period of time.
But conversely recent history suggests higher is better – because high MDC means higher market caps, which means enthusiastic buyers (institutions) are stepping in to bid up the stocks. This allows treasury companies to then issue stock and buy more Bitcoin. In other words, MDC can be thought of as a momentum oscillator. You can see below that Low MDC typically aligns with local tops, and high MDC typically occurs at bottoms and at the beginning of significant rallies.
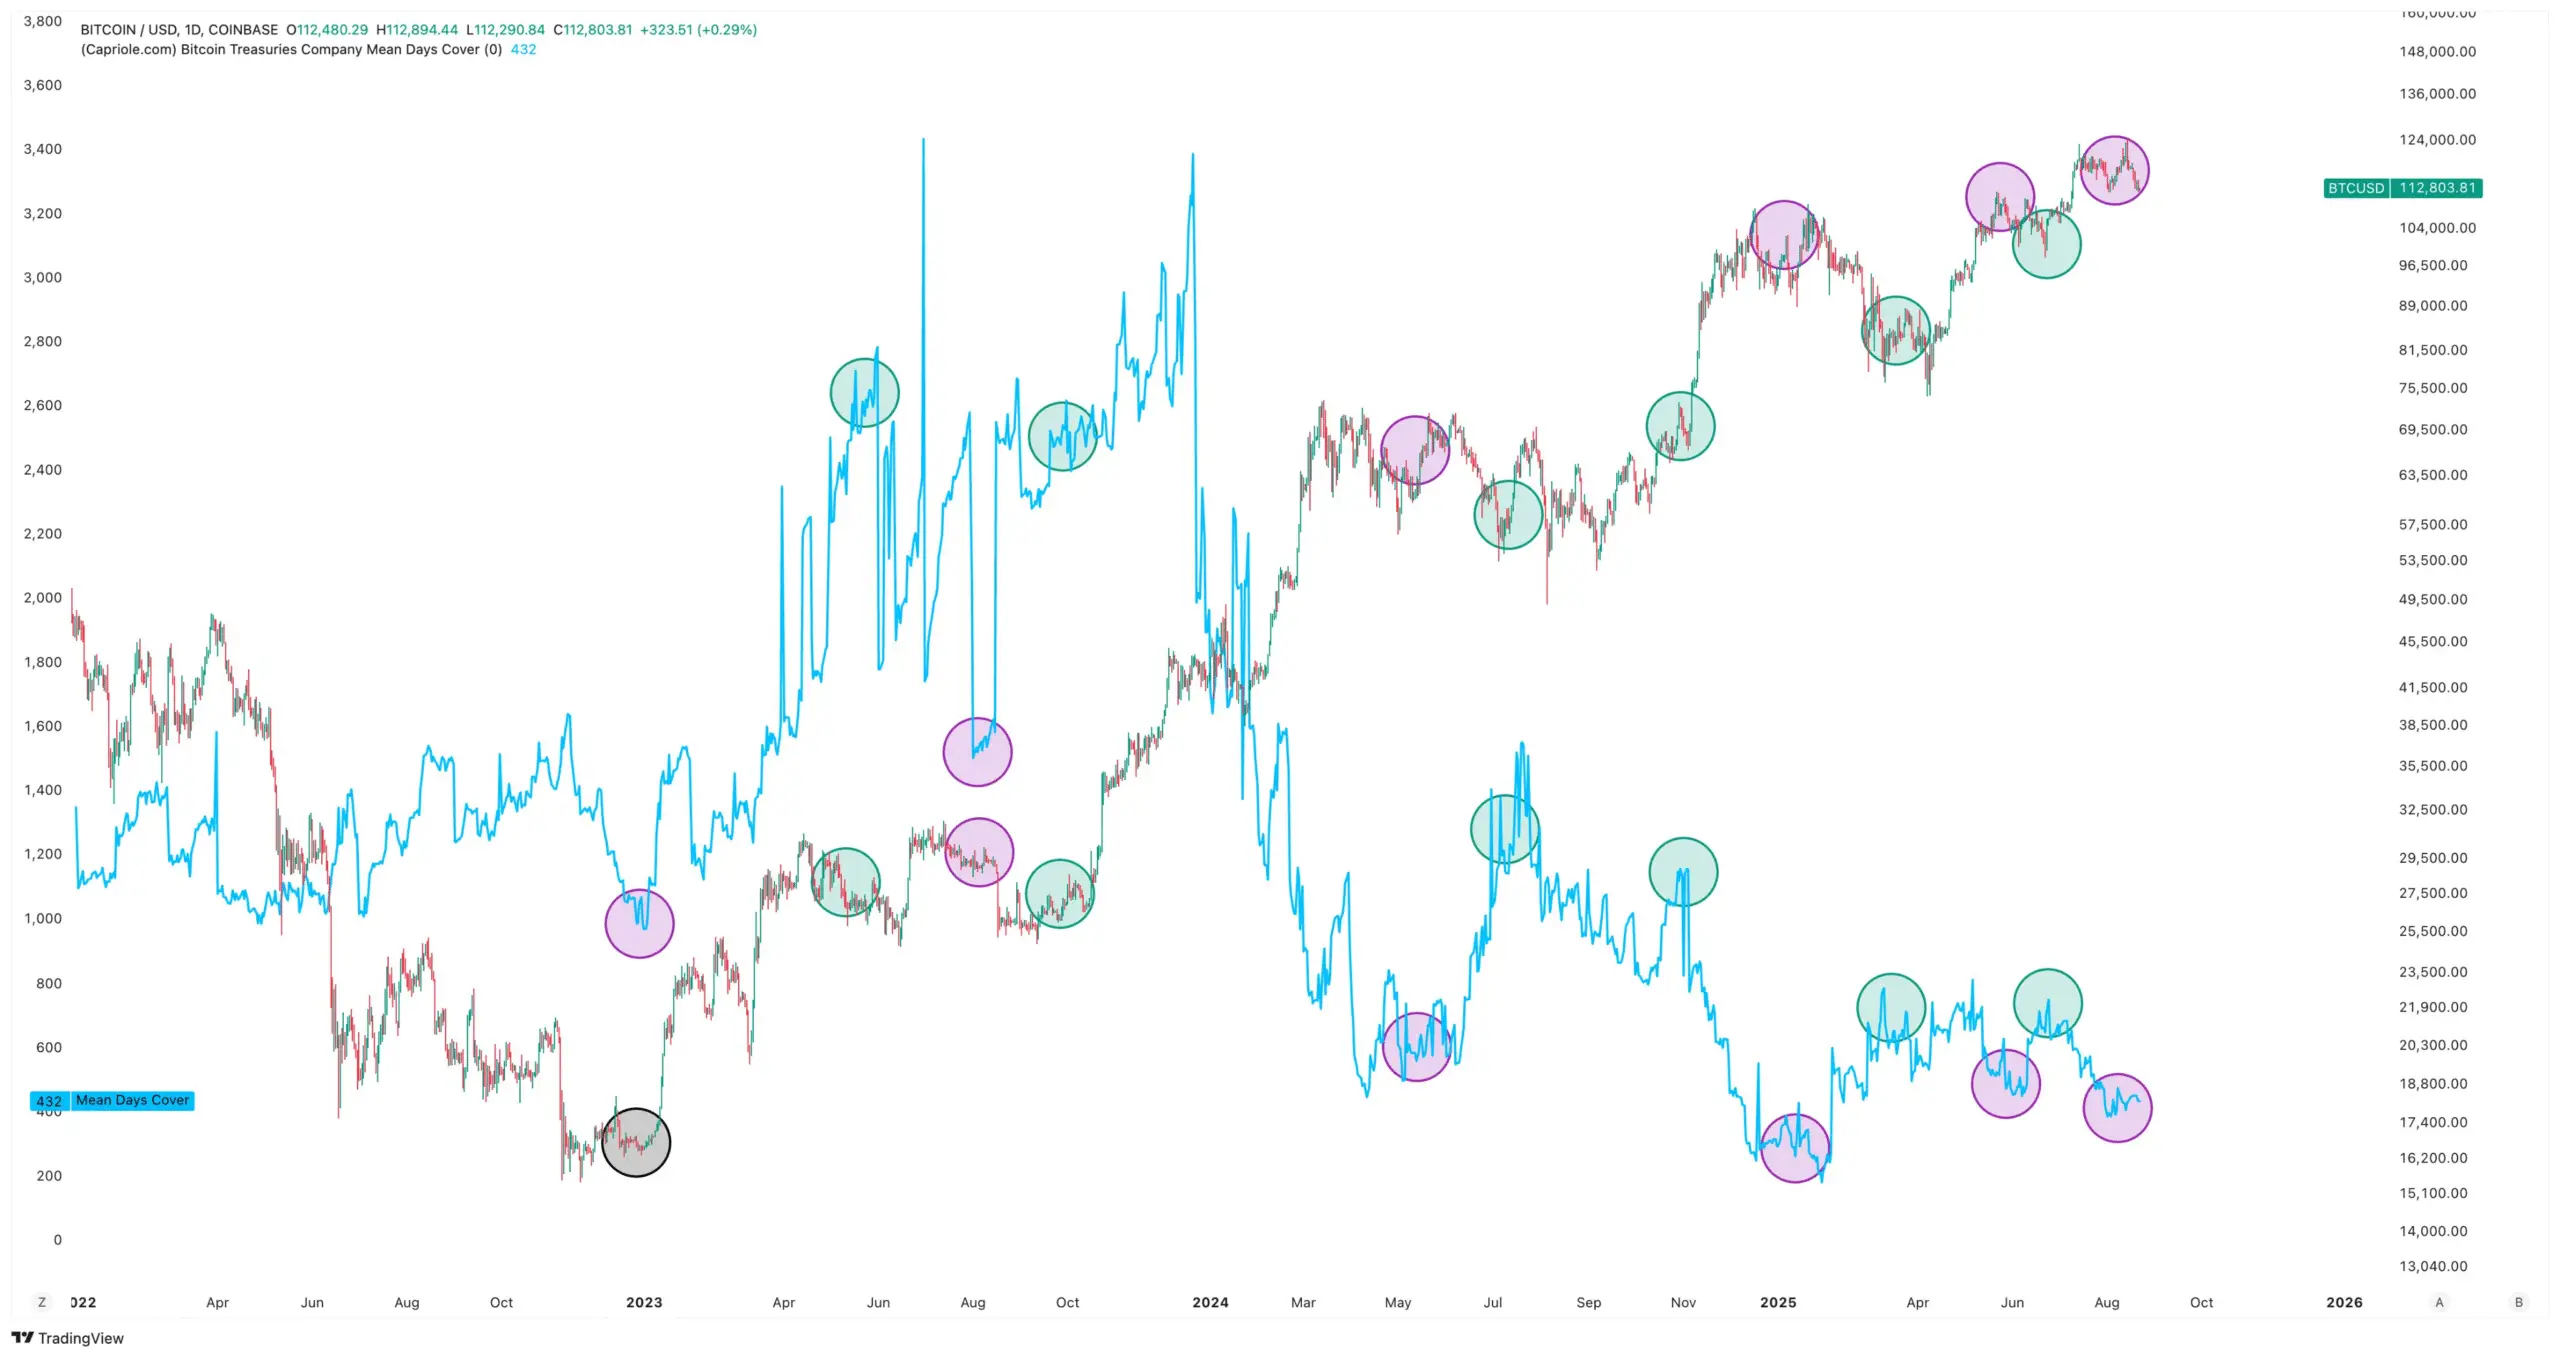
Treasury Company Mean Days Cover counter-intuitively higher is historically better. Today it is low. Source: Capriole Charts
Conclusion
Today we have some treasury company warning signs flashing. Most concerning is the breakout in the percentage of companies with mNAV less than 1. This is putting treasury companies under pressure. But is it just a local dip?
The Percent Buyers metric suggests that on aggregate the buying activity of these companies is still very strong. But some metrics like Mean Days Cover suggest we may have lower to go first.
Perhaps it’s too early to tell. But the longer we have falling mNAVs, the more pressure companies will be under to sell their Bitcoin, adding fuel to fire for any Bitcoin price decline and a risk scenario we should manage accordingly.
For now, the net picture is still healthy (don’t forget they’re still buying multiples of daily supply) but we don’t want to see these conditions worsen, as the treasury company story will be reflexive in both directions.
Capriole just released 5 new charts and about 10 new metrics today. These metrics provide granular insight into Bitcoin Treasury Company risks. You can find some of the charts, and each of their explainers, in the above links throughout this article.
In short: quite a few risks are flagging. These risks can certainly reverse to the upside very quickly, but some of these metrics are also showing their worst readings in history today. Stay tuned… and monitor the data: http://Capriole.com/Charts


One Response
Great data offering solid insights, thank you!