Welcome to Capriole’s Newsletter Update #58. A consolidation of the most important Bitcoin news, technicals and fundamentals.
A fresh start
Welcome to 2025. With Bitcoin in full swing in it’s peak performing months of the Halving cycle, this new year brings plenty of promise. From a seasonality perspective, we are starting one of the optimal quarters of the year that sees an average return of +56% historically. We are also in the optimal 12 month window of the 4 year halving cycle and we are about to get a Bitcoin Strategic Reserve in the US. From a Bitcoin perspective, that sets us up for a phenomenal year ahead.
So what are the biggest risks to Bitcoin as we kick-off 2025?
If anything is going to derail the best year of the Bitcoin cycle in 2025, it’s likely to be a macroeconomic risk factor and an associated risk-off movement across equities. So today, we will focus our market update on macromarkets and review the overall health of equities and bonds, consider the potential for recession and assess the sentiment towards risk assets in general.
Technicals
Before we get into the nitty gritty of macro, let’s first zoom out and inspect Bitcoin’s high timeframe (HTF) technicals. Last update 3 weeks ago, we noted the $98K level as a key support that should hold, with things potentially getting ugly if we lost that level. Within 24 hours it was lost with a daily close at $97K and Bitcoin proceeded to trend us down to $91K last week. Fortunately; we just had a very strong weekly close that has taken us back above $98K and re-established a bullish HTF technical regime for Bitcoin.
However, I would like to see $100K reclaimed on a daily close first. In my thinking we should not have lost $98K so easily in December, especially with the billions of dollars being deployed by ETFs and Michael Saylor into Bitcoin. Nonetheless, long-term holder selling and Bitcoin miner selling was relentless and too significant to keep us above $100K. $100K is a significant psychological level, and given it’s just a few hundred dollars away at present, it makes sense to conservatively await that confirmation if you are not in yet.
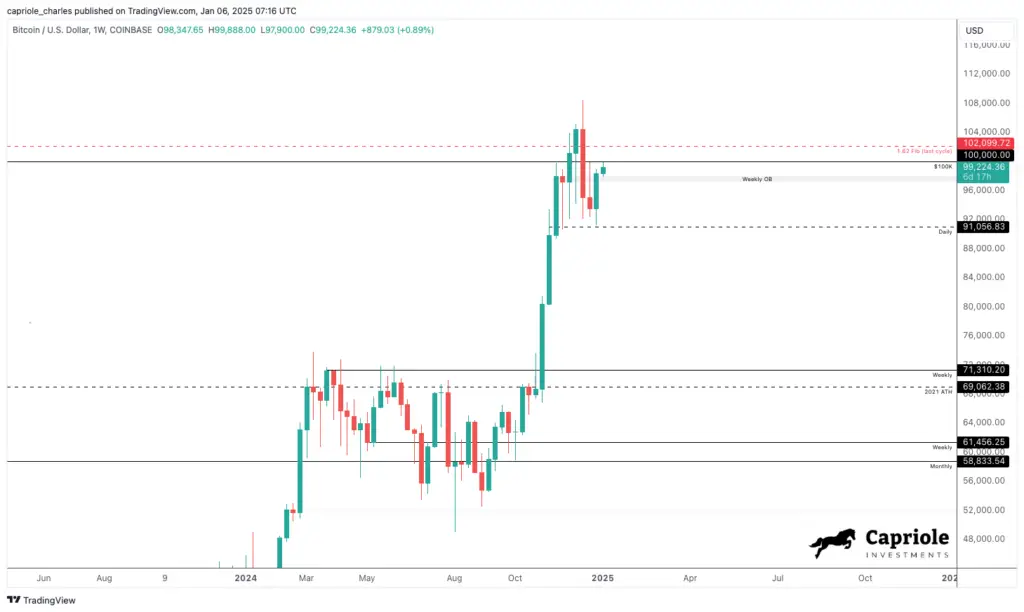
So, bearing in mind Bitcoin is on the precipice of a strong technical breakout, let’s see if macro will be supportive in 2025.
Microstrategy analogy – why macro and equities matter
Capital flows downstream. In the following section we review various bond metrics, as bond markets drive equities. We also review equities, as risk-on/off attitudes in equities also drive Bitcoin. Bitcoin has a high correlation to equities in such periods.
This cycle, Microstrategy is playing an ever increasing role in the Bitcoin sphere. They are fast tracking their 21/21 plan and deploying 10s of billions of dollars into Bitcoin at present. One of the driving factors allowing Microstrategy (MSTR) to raise so much capital is the large market cap premium they have to their Bitcoin holdings, the premium allows them to raise large sums. If equities were to see significant stress, this premium would collapse as it has in the past and diminish MSTR’s ability to raise capital and buy Bitcoin at a breakneck pace. This is not a scenario we are predicting now, but it is one dynamic in which equities stress has a growing impact on Bitcoin. Not to mention the $110B and growing behemoth that is the US Bitcoin ETFs. Our ties to equities are growing.
Bitcoin is a tradfi asset now. We move with macro, bonds, equities and Presidential treasury decisions. Capriole has always utilized macroeconomic and equities market data for our Bitcoin investment decision making. We were one of the first to do so in the industry and have found it invaluable for many years.
It’s importance today has never been greater.
Macro chart book
Grab a coffee and lock in, we are going to dive into macro charts and see what they are telling us today.
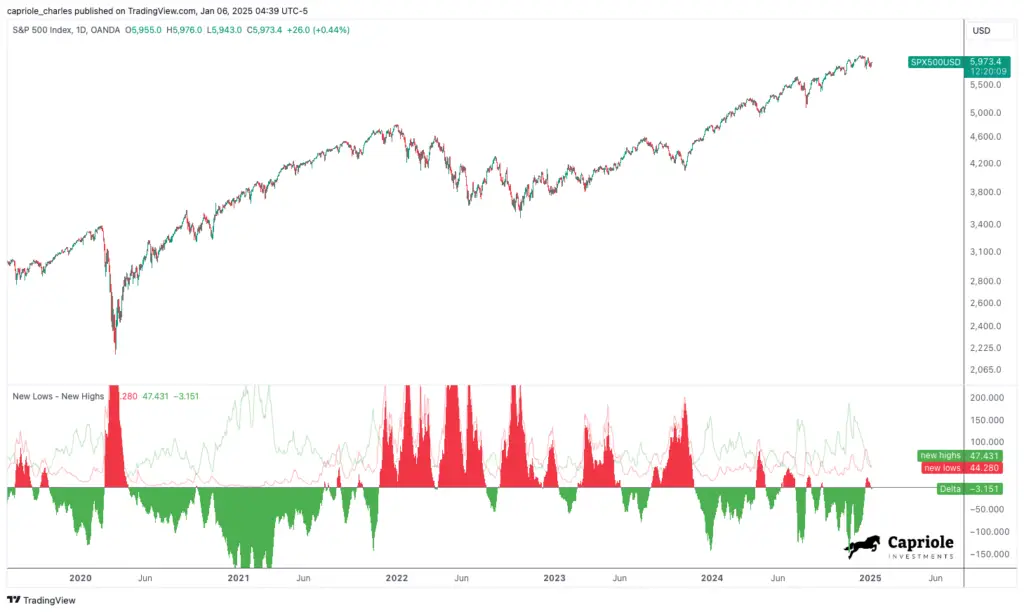
The first chart shows the delta between New Lows and New Highs on S&P500 stocks. Many discuss this metric in a negative light. But as you can see from the red and green zones below, you never really get a measurable pullback while this ratio is green. A Green zone (more highs being set than lows) shows growing strength across the 500 stocks. It just crossed green last Friday.
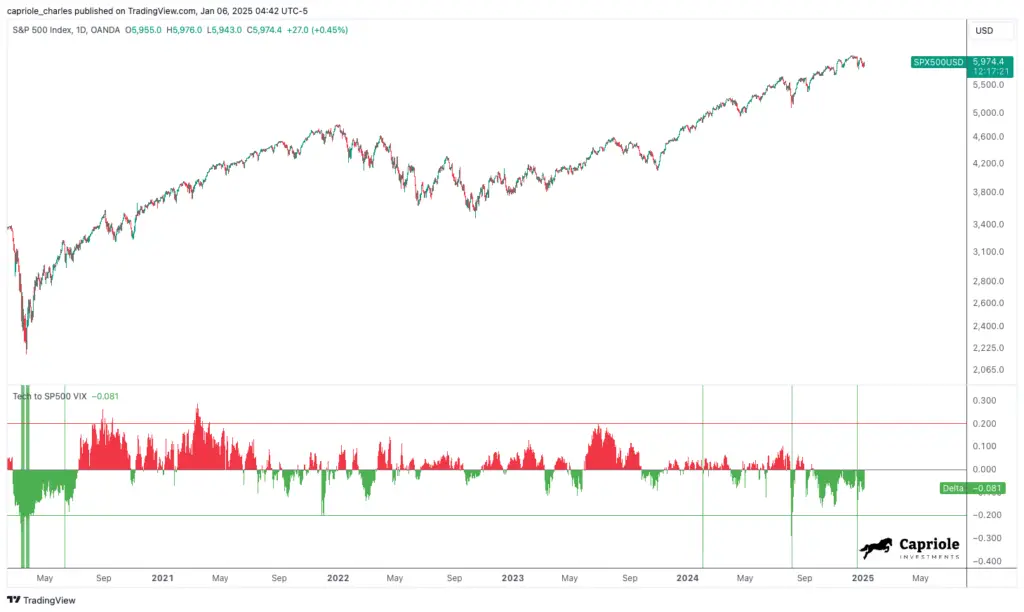
Below we have Tech VIX to S&P500 VIX volatility index ratio. Here again, when it’s red this metric is more concerning. Local bottoms usually form in green zones, like the region we are in today. We also had a recent buy signal (cross under -0.2) just a couple weeks ago, which typically occurs near price lows on the S&P.
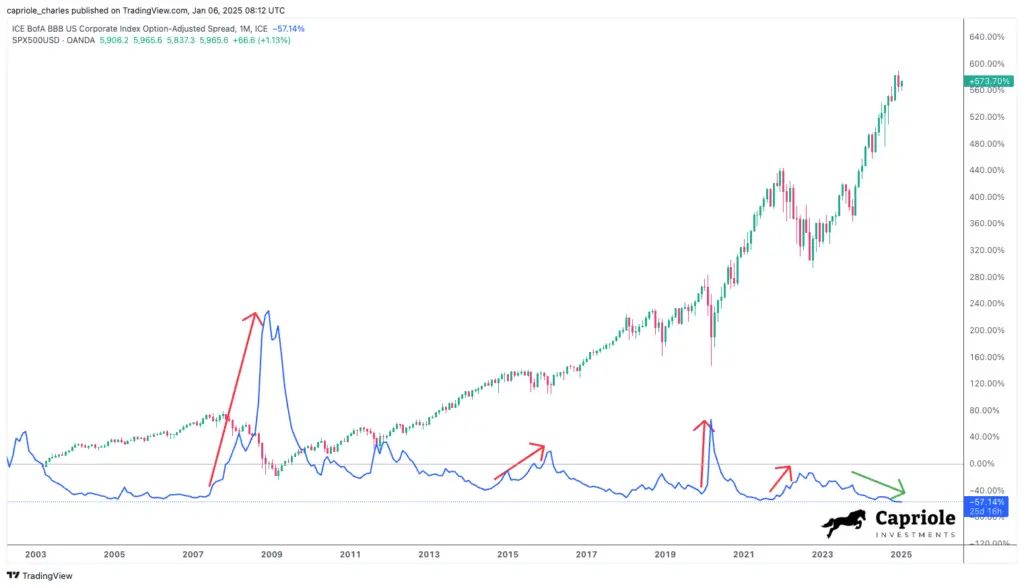
BBB Corporate bond spreads remain tight. Bond market typically lead risk assets. When this ratio goes up, it suggests investors are demanding higher yields on corporate bonds versus treasuries because of perceived risk. Not so today, as bond spreads are trending strongly “risk on” as of writing.
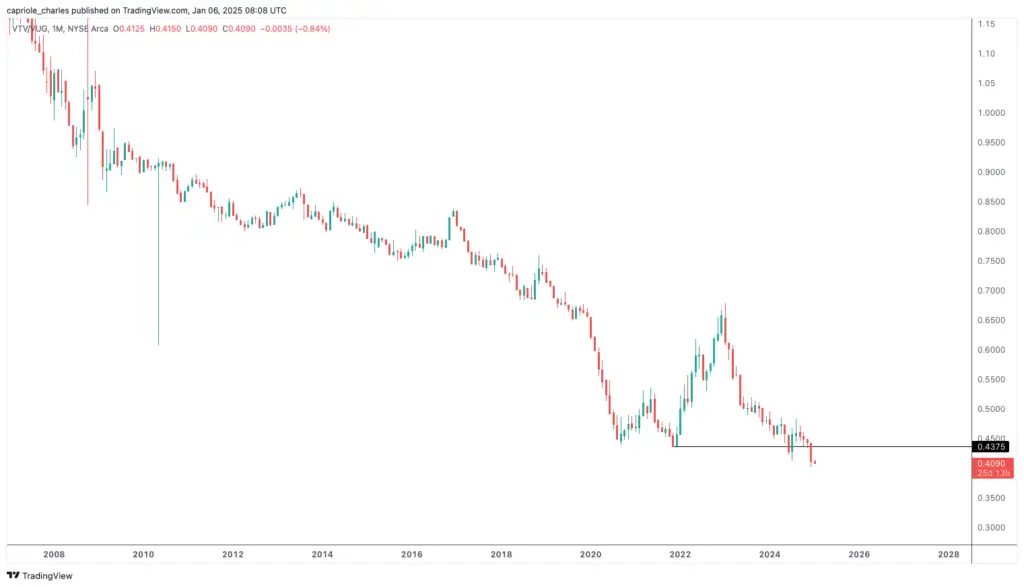
The ratio of Value (VTV) to Growth (VUG) stocks also had a strong breakdown in December 2024. This is bullish equities which are dominated by growth and tech today. This is a metric which rallied into the risk off period of early Covid, and again when the Fed pivoted hawkishly late 2021. It suggests the market is still risk on and growth orientated today, with invalidation close by at the noted level.
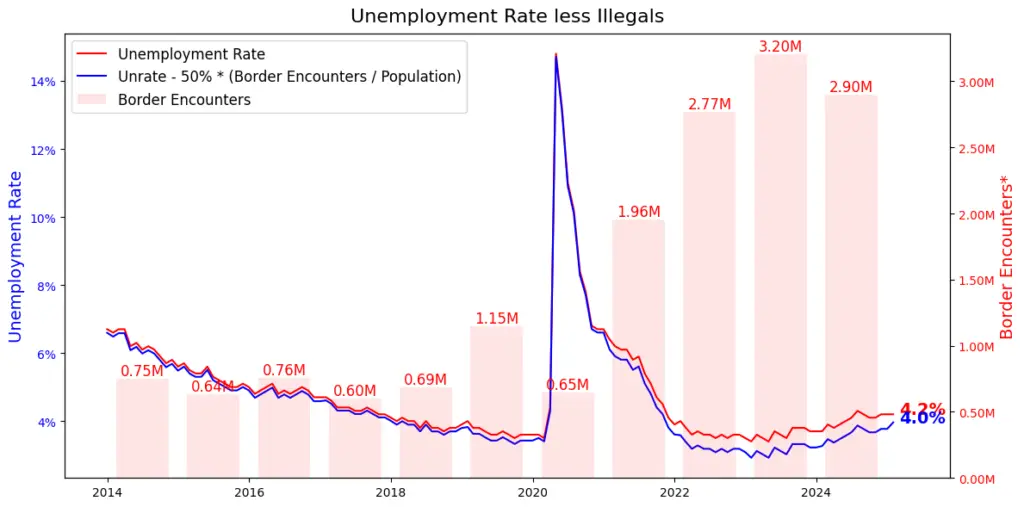
The unemployment rate is starting to show bottoming signs which are a flag to monitor going forward. But so far at 4.2% today, it’s not yet a cause for concern. But if unemployment spikes up, that would not be good for equities short term (until the Fed hits the money printer button). We also had a very positive initial claims reading recently, which suggests employment should remain strong for the near term. If we assume 50% of illegal border crossings are unemployed, we can see a more realistic unemployment rate that excludes illegals is 4% today. Today unemployment is strong, but definitely an important metric to monitor into the future.
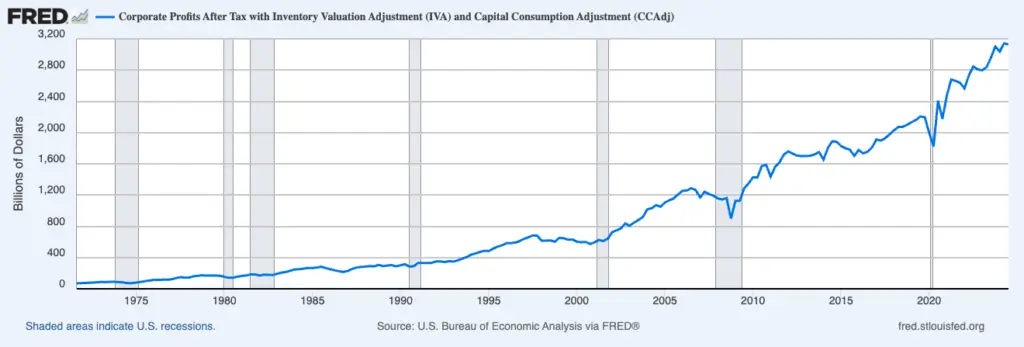
Corporate profits continue to trend up strongly. No surprises here, the economy is strong. As you can see, you would expect to see profits start to roll over into recessions (gray highlights), not the case today.
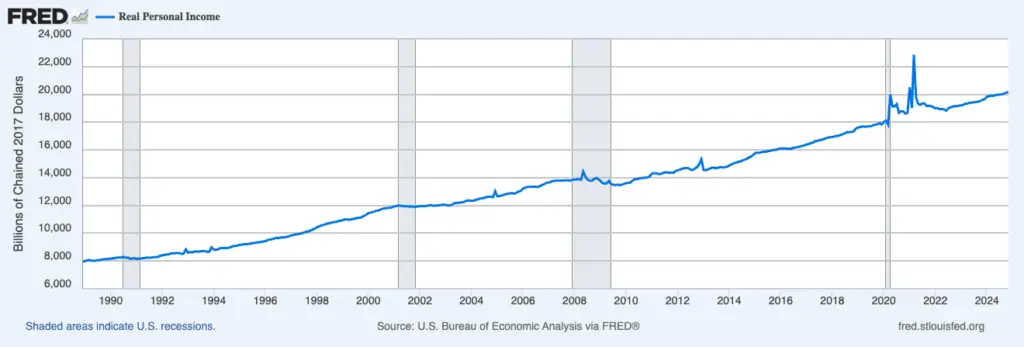
Real personal incomes also remain strong with no signs of a rollover. A strong consumer feeds a strong economy.
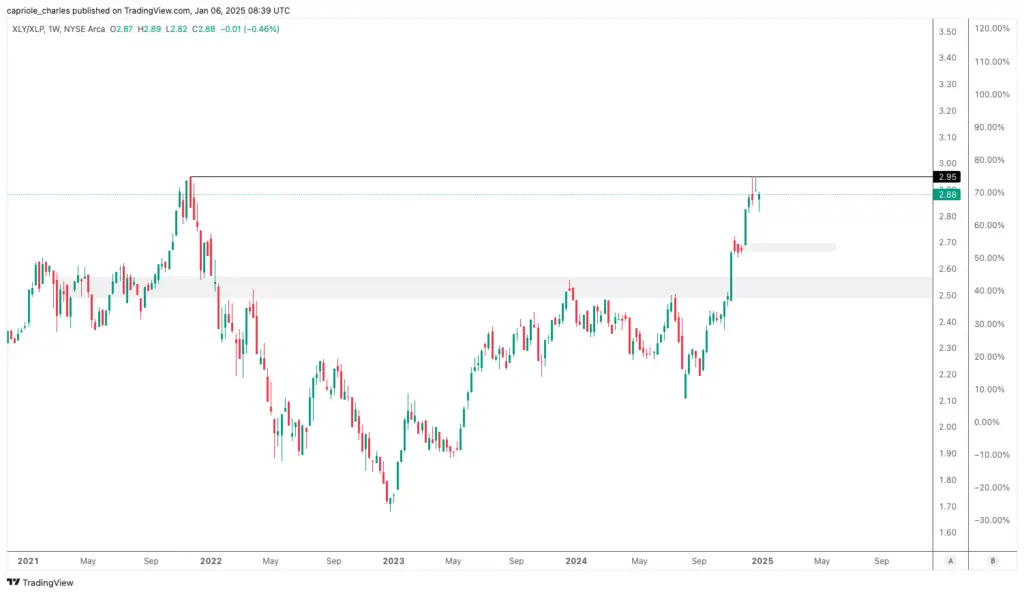
Analysing consumer behaviours further, we can look at the ratio of discretionaries (XLY) to staples (XLK) and see that discretionaries have been outperforming recently, conducive of a strong economy. It’s at a potential local trouble zone here (at 3.0), a convincing break above that level would be very bullish discretionaries. To be determined.
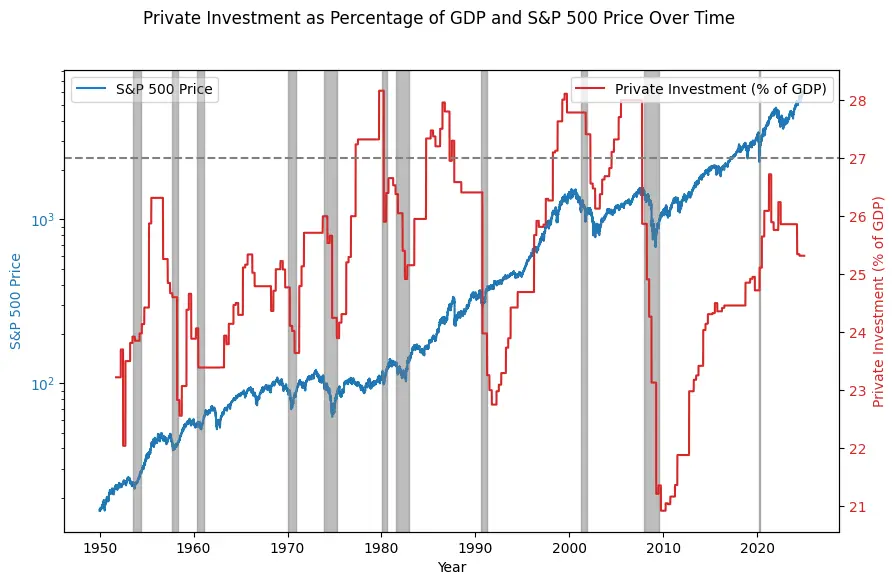
Corporate investments came down with rising yields in recent years. However, since Nixon took us off the gold standard, 5 out of 7 of the last recessions started with Private investments above 27% of GDP. Today we are at 25%. Investments usually take time (read: years) to have a positive return, typically incurring losses nearer term. So when this metric peaks, we are usually late cycle and have a growing chance of difficulty in the near-term.
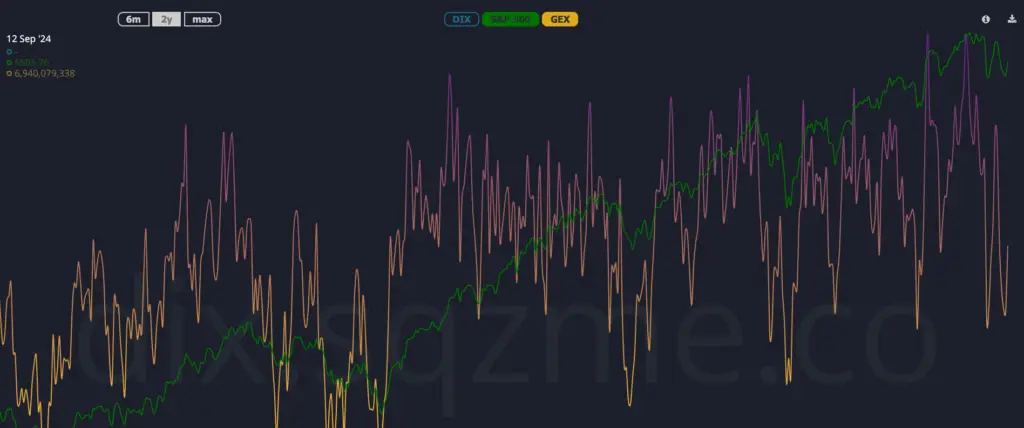
Gamma Exposure (GEX) is a dollar-denominated measure of option market-makers’ hedging obligations. When GEX is high, the option market is implying that volatility will be low. When GEX is low, volatility is high, suggesting diminishing likelihood of near-term losses. It’s quite low as of last week’s dip.
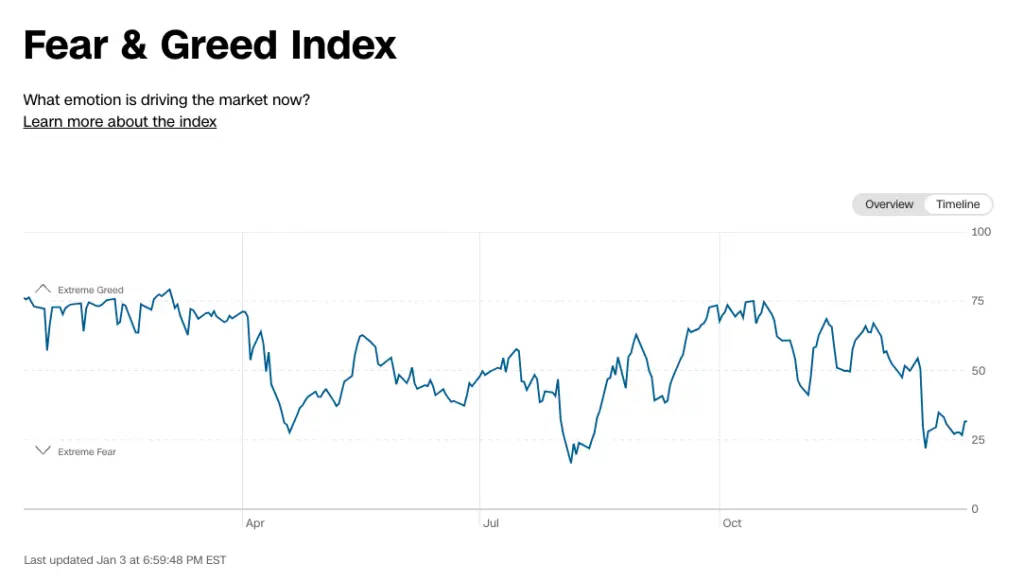
CNN Fear and Greed recently left Extreme Fear. A decent sentiment metric to suggest we have been somewhat oversold on this relatively small equities pullback into the end of 2024.
Capriole’s own Active Manager Sentiment metric also just normalized, having been in the risk-off zone in early December.

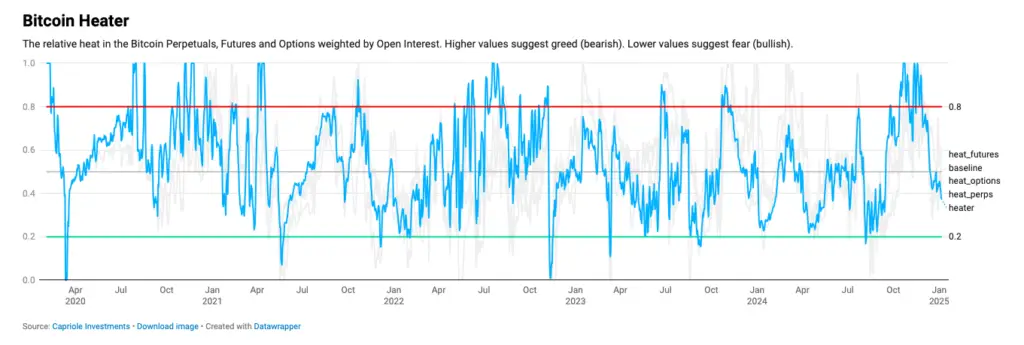
While we are looking at sentiment metrics – a quick look at Capriole’s Bitcoin Heater, shows the weighted average positioning across Perpetuals, Futures and Options has reset in the last week and is currently moving lower towards the buy zone.
So far, most of the macro charts shown across fundamentals, technicals, financials, sentiment and more reflect largely a strong macro market.
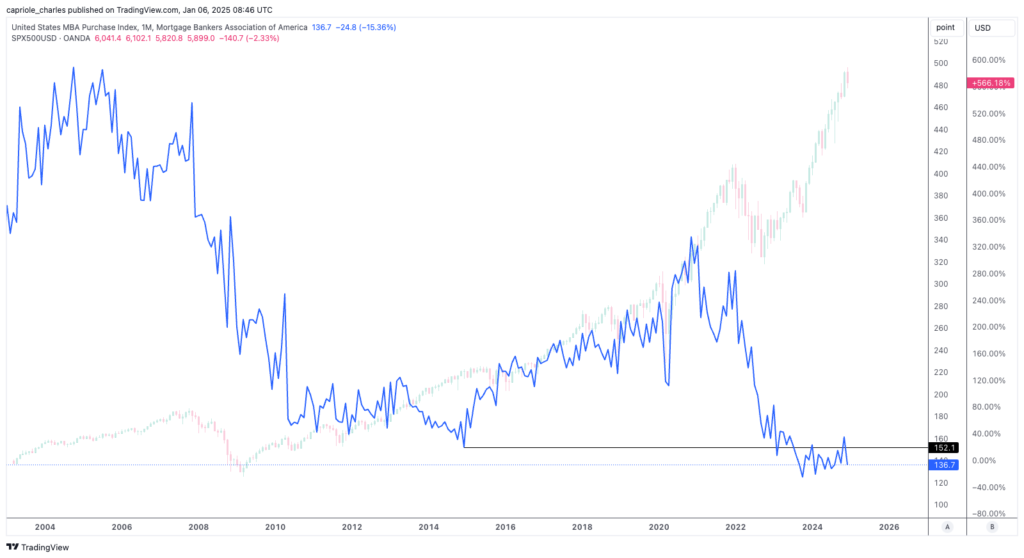
However, the housing market is less rosy. This isn’t surprising when you consider the absolute tear the Fed had been on until recent months raising rates, with the 10 year now pushing 4.6%. As a result, the mortgage loan applications index recently broke down again. People are less enthusiastic about investing in new property today.
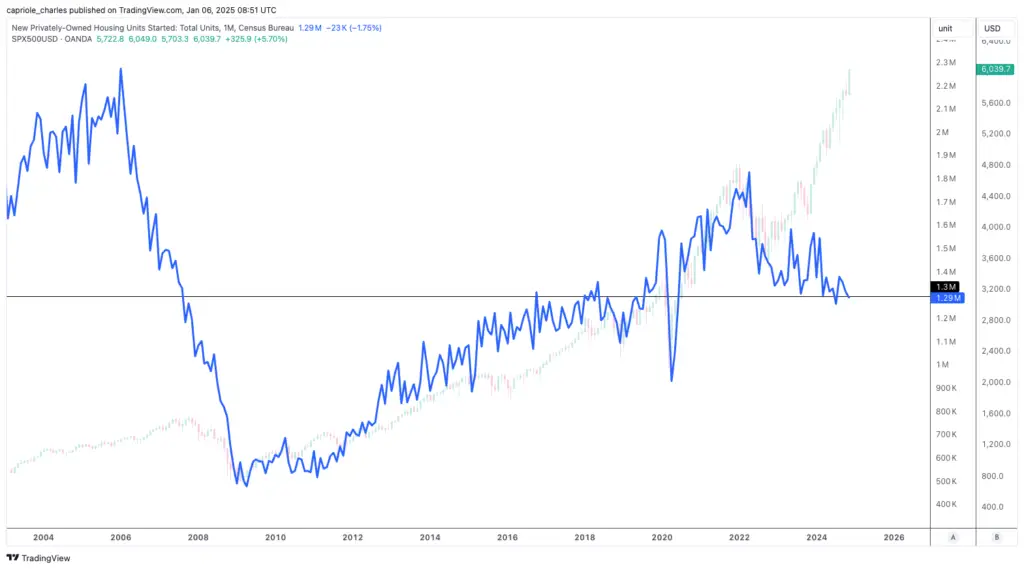
Supporting this, new housing starts is showing weakness at the 1.3M level, a historic level which when crossed has preceded recessions in the past. Given the context with interest rates, and the otherwise broad strength across the macro metrics shown, this is not yet a cause for concern but definitely something to watch. Should we later see broader weakness across housing, as a major part of American wealth and construction, this data could have broader ramifications.
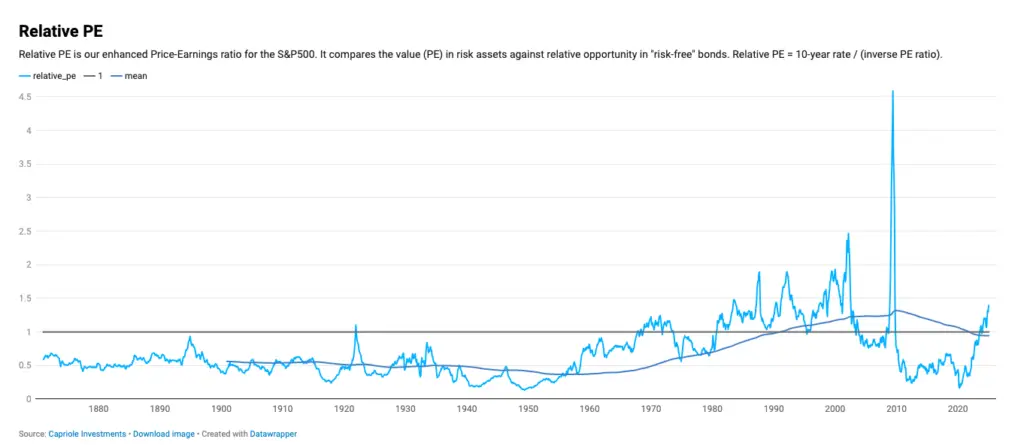
Finally equity valuations suggest we are not early cycle today. Referring to Capriole’s “Relative PE” below, we can see equities are priced dearly compared to risk free assets (treasuries) and starting to trend into historic highs. at 1.4 today, this metric can definitely go higher and for many months. Troublesome times like 1987 and 2000 went to 1.9. On the other hand, years like 1992 saw high readings (1.9) without any significant issues across equities before Relative PE safely normalized on its own. So we are open minded to various outcomes here.
How can valuations safely normalise without measured price corrections?
There are two key levers that can normalize Relative PE without equities prices being affected, namely:
- Declining interest rates, and/or
- Company earnings growing.
There’s a good chance of both at present.
The Fed is still dovish and planning to cut further in 2025. Regarding company earnings; we have a very strong economy as of writing, and are on the cusp of an AI revolution which is driving rapid intelligence and output efficiencies. This will impact GDP. We also have Trump’s incoming presidency – there are a lot of unknowns here (some possibilities discussed here) – but he is planning to drop the company tax rate to 15% from 21%. That alone would add a 29% boost to most company’s earnings and fully repair the “relative PE” ratio all else equal. Trump measures a lot of success from equities, so it’s hard to imagine a world where his policies cause substantial harm here.
Summary
Bitcoin is in the optimal phase of its four year halving cycle. A year where it has historically delivered maximum returns on a rolling four year basis. Equities are set up incredibly strong coming into 2025. Valuations suggest we are not early cycle, so risk could grow with time. We must be prudent to adjust to new data as it comes in. Nonetheless the bond market is signaling risk on, the economy is growing and the consumer is spending. Volatility, options and sentiment metrics suggest this is a buy the dip opportunity. We have to search wide to find red flags, the weight of the evidence is positive.
2025 is going to be a exciting year, and the stage is set very promisingly across equities and macro data to support great outcomes. From the Capriole team, we wish you a rewarding 2025.

Charles Edwards


