Seasonally Optimal
Welcome to Capriole’s Newsletter Update #54. A consolidation of the most important Bitcoin news, technicals and fundamentals.
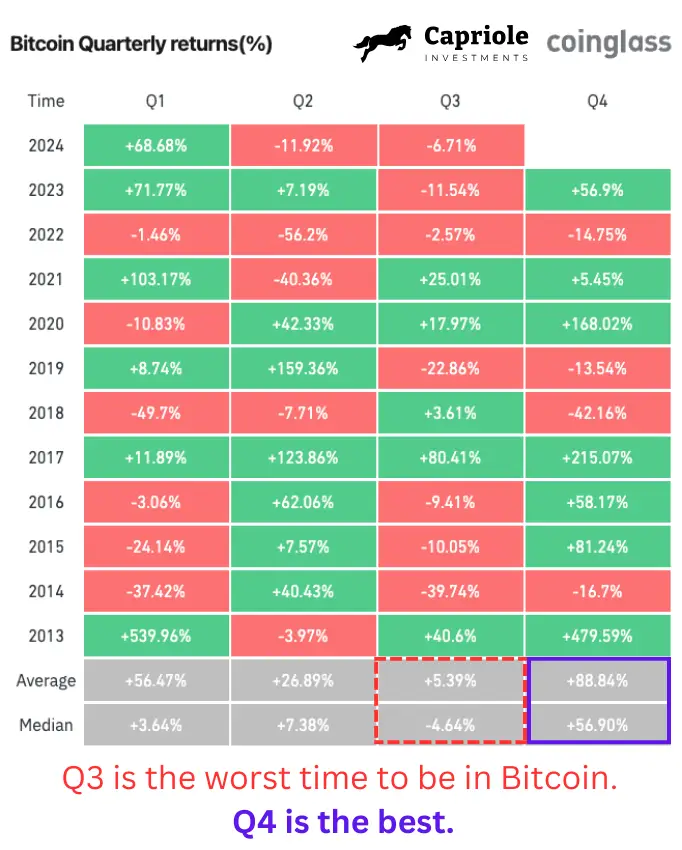
August and September are the two most challenging months through Bitcoin history, and together make Q3 the worst performing quarter to be allocated to Bitcoin. This is simply a period we just need to get through. The good news is, Q4 is historically excellent, with Q1 not far behind.
Let’s take a look at the impact of the Halving. Every Halving sees miner profitability fall, this results in industry consolidation. We can see this in several metrics, including Bitcoin’s Production Cost.
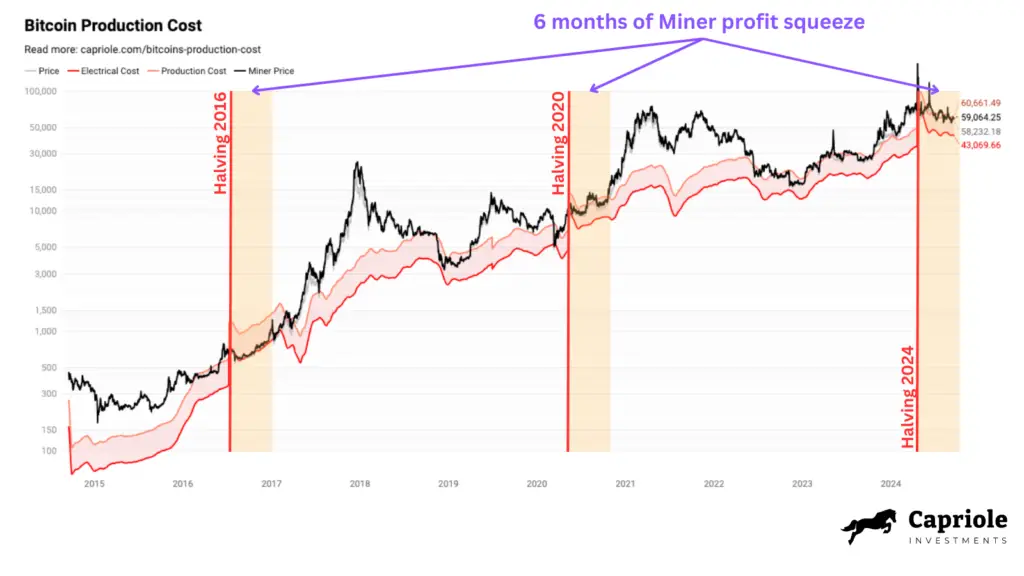
As you can see in the orange highlights, Bitcoin miner profit margins get squeezed for the 6 months following each halving. As Miner Price (Bitcoin’s price adjusted to include block transaction fees) dips below Bitcoin’s Production Cost. Price usually consolidates below all-time highs in this zone. Exactly what has been happening in 2024. And just like volatility; compression leads to expansion. Seasonally this suggests we have a very exciting 12-18 months ahead in this Bitcoin cycle.
Finally, we have the US Federal Reserve’s first rate cut occurring tomorrow. This marks the start of a new dovish Fed policy regime, the first significant change since late 2021, when the Fed notified of their hawkish regime shift and which saw rates rise from 0 to 5.5% in 18 short months. This Hawkish regime also coincided with Bitcoin’s collapse from $60K to $15K. We are now at the start of the exact opposite regime. There’s a 2/3 chance the Fed cuts 0.5% tomorrow, and a 1/3 chance they cut 0.25%. In other words, a cut is priced in as a certainty, with the Fed dot plot seeing us at 2.5-3% rates over the next 2 years.

If the 0 to 5.5% rates saw a circa -75% collapse in Bitcoin, what might a 5.5 to 2.5% rate regime see Bitcoin do over the next 18 months?
Technicals
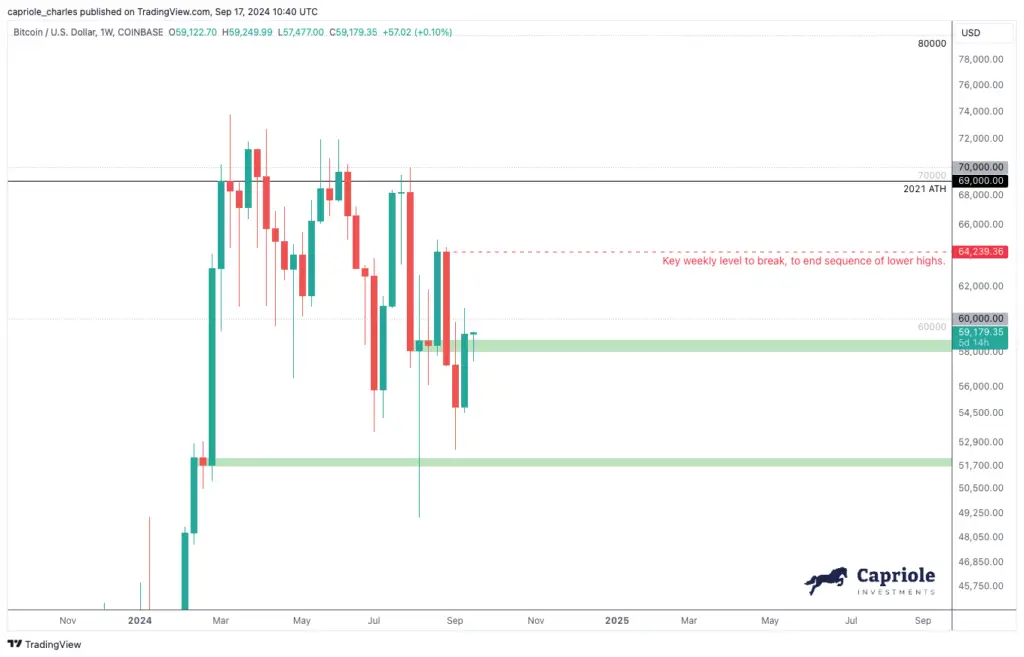
While ugly, and still in a trend of lower highs and lower lows (net “bearish”), weekly support is responding well at $58K today. A weekly close above $64K would end the 7 month sequence of lower highs and likely see us travel back to range high ($70K) with haste, and probably beyond. Nonetheless, the Technicals picture is mixed at best, and bearish at worst, until the range (and monthly resistance at $60K) is reclaimed. Based on the current response to the Weekly $58K level, and given the major Fed event tomorrow, I would not be surprised to see that level taken very quickly to the upside, provided no bearish surprises from Chairman Powell tomorrow.
Fundamentals
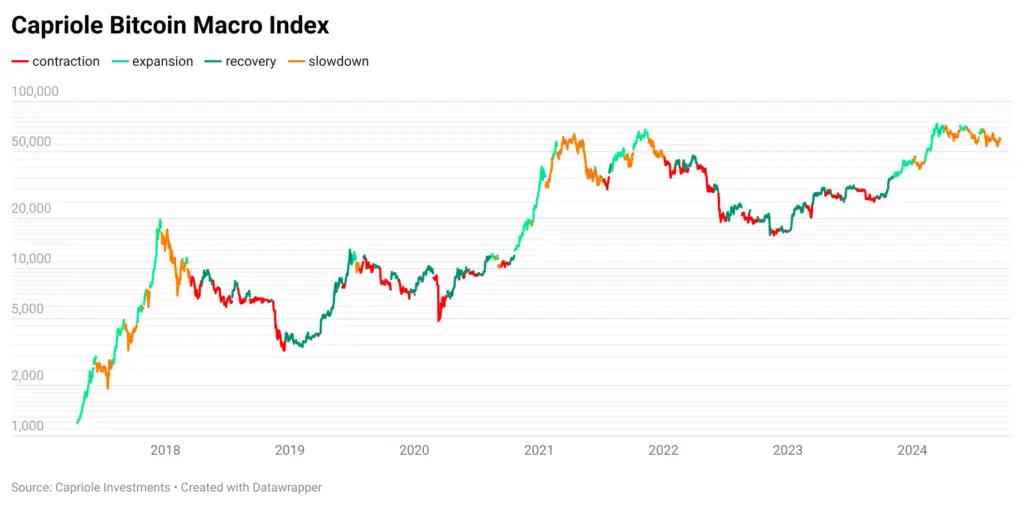
The collective picture as shown through Capriole’s machine learning fundamentals model Bitcoin Macro Index still suggests risk management here, but has a conservative long positioning. This Index includes over 60 of the most powerful Bitcoin on-chain, macro market and equities metrics combined into a single machine learning model. It is a pure fundamentals-only value investing approach to Bitcoin, where price isn’t an input.
Don’t trust On-chain
Bitcoin’s onchain data has been the primary bearish factor in recent months which has made market positioning challenging, oftentimes conflicting with technicals, sentiment and broader macro data. Why might this be?
2024 has seen massive capital re-distribution as a result of the ETF launch and Mt Gox. This capital movement has mischaracterised many on-chain metrics and told us a false narrative.
Many of the most valuable Bitcoin on-chain metrics depend on the classification of long-term and short-term holders. Long-term Holders signify the smarter money at navigating Bitcoin cycles. They are defined on Glassnode as those that have held Bitcoin over 155 days on-chain. A threshold that typically sees a strong relationship with longer-term holding beyond that period.
The US ETFs launched on 11 January 2024. I would argue that by definition, ETF holders should be considered long-term holders, because:
- The typical ETF holder is looking for a safe, all in one, custodied solution to asset class allocation. They are not usually active traders. ETFs are long-term investment vehicles for most people. But based on the onchain data, the capital flows into the ETFs were all considered as “short-term holders” for the first 155 days, as they were transfers to new Bitcoin addresses.
- A lot of the coins going into the ETFs were from long-term holders, that were reallocating from other vehicles, like the cost ineffective Grayscale ETF (GBTC). GBTC saw its balance decline from over 620K BTC at ETF launch to just 200K today. I would argue a major portion of that decline was straight into IBIT and other significantly more cost effective ETFs.
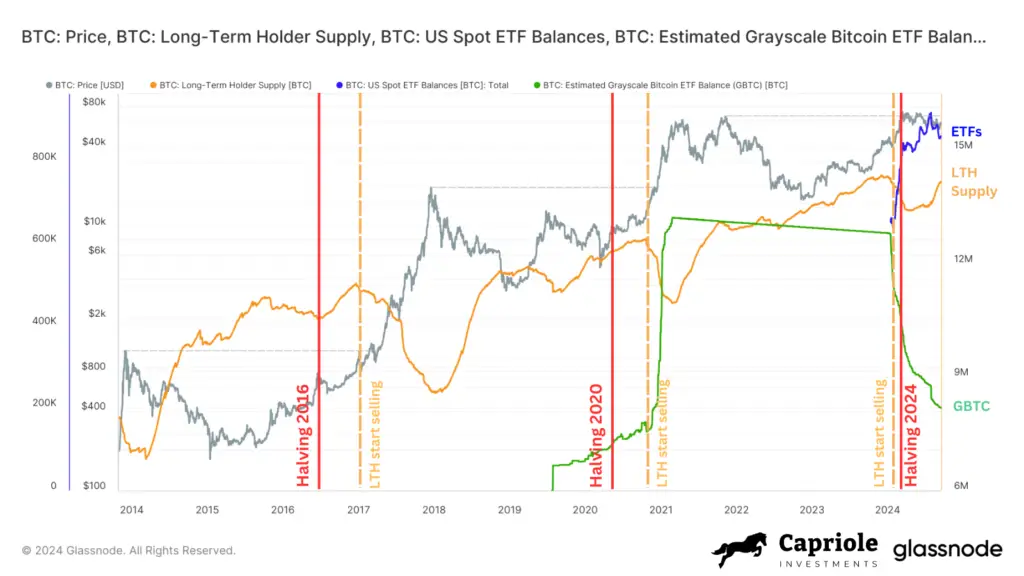
On the below chart, we can see that long-term holders (LTH) normally start selling about 6 months after the halving, and as price exceeds prior all-time highs, the selling (reduction of their total supply, orange line) starts to steeply decline as they sell into profit. However, this cycle, we can see the selling started before the halving. Quite unusual. One might argue this is “front running” – the market is smarter now and selling earlier. But it seems too much of a coincidence that this LTH selling started in the exact same week as the ETF launches.
Zooming in to 2024, we can also see some interesting things:
- Long term Holder (LTH) supply bottomed and started to trend up approximately 155 days after the ETF launch, this is the time duration required for ETF supply to start being classified as Long term using on-chain data.
- As of writing, we have already recovered 90% of the LTH supply reduction!
- Within 3.5% error, all of the decline in LTH supply (approx 820K BTC) can be explained by the gain in ETF balance, the decline in Grayscales holdings (all classified as Long-term) and the forced selling from Mt Gox, the German and US governments over the summer period.
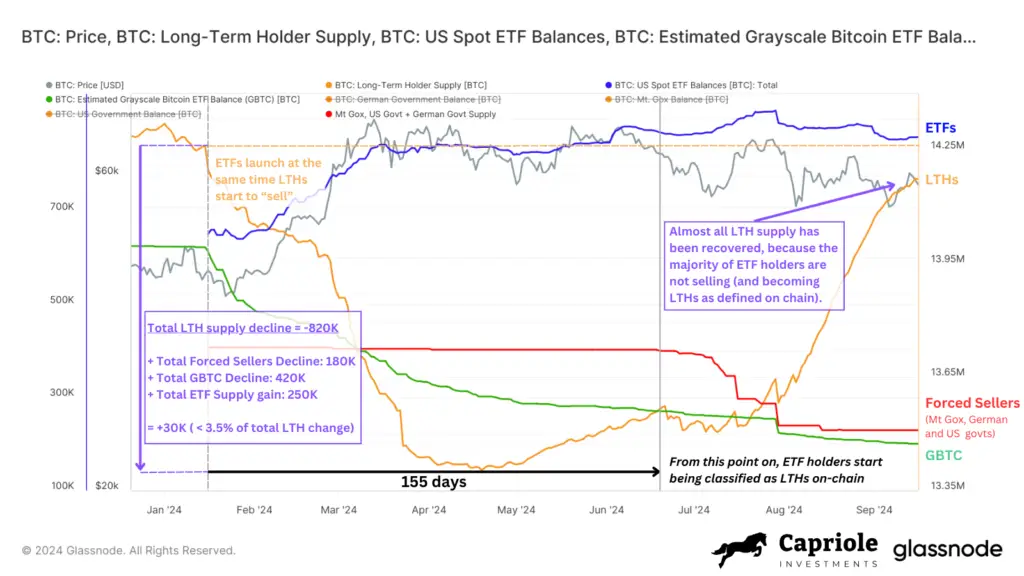
In short, the last 6 months has seen on-chain metrics be massively “manipulated” by huge supply re-classification, which on net did not see any significant organic long-term holder selling. This resulted in many on-chain metrics seeing extremely bearish readings comparable with prior cycle tops, as we discussed 2 months ago in Update 52.
This means that any on-chain metrics with “long-term holder” data, or “supply last active more than XX months/years” cannot be trusted in 2024. Yet these classifications form the basis of a significant portion of valuable on-chain metrics.
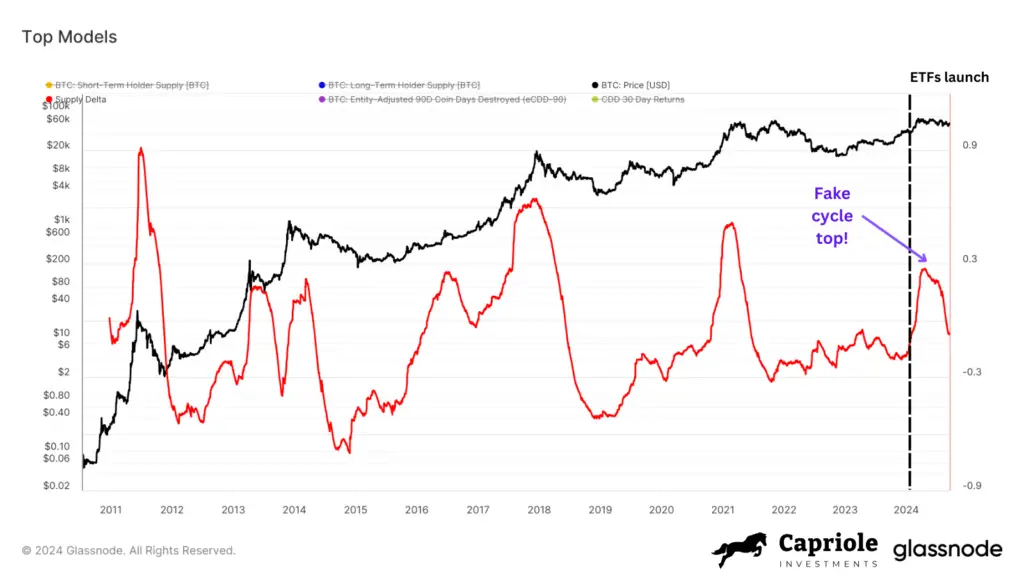
Here is one example of a fake news cycle top, and there are many others. Supply delta shows a fake spike and reversion to norm, which is fully explained by the dip and 90% rebound in LTHs in the prior chart.
This has made our job as analysts this cycle very difficult. While it’s easy to see and explain the above on-chain challenges in 2024, this was not possible in real-time. We did not know the effect each of these supply dynamics would have until they were confirmed. It means we have one less tool in the toolkit for the coming months, or a tool whose weight should probably be discounted.
The next 6 months will be critical for Bitcoin. This coming period will tell us how many of our newly defined long-term holders will remain so, and from the end of 2024, all of the above supply sources will have surpassed 155day thresholds thereby normalising and becoming more reliable. That said, any metrics using supply last active 1+ years ago will be untrustworthy for at least the next year.
So the picture is not as bleak as it seems. In fact, it’s quite promising with this new context.
Chart(s) Of The Week
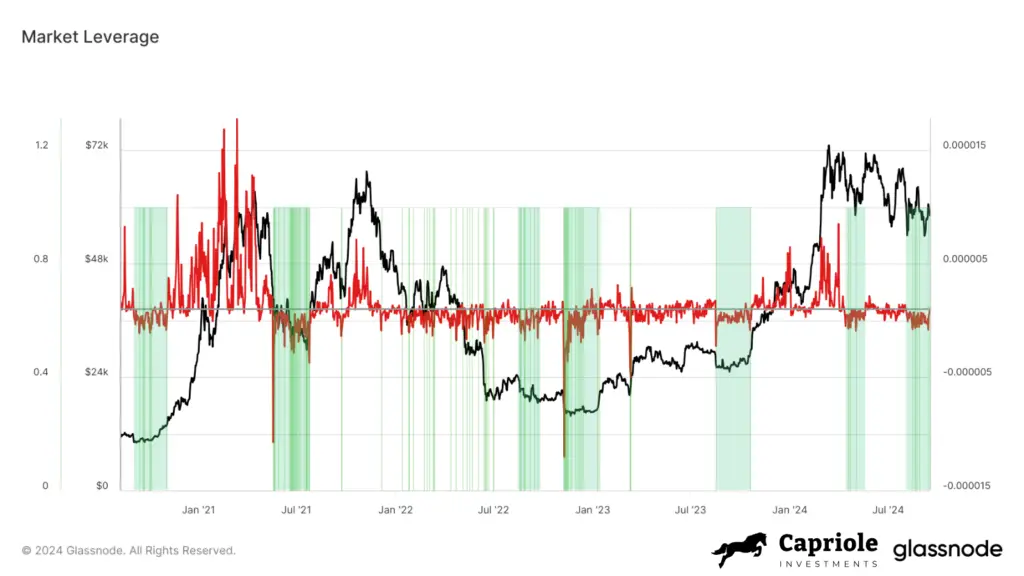
We may not be able to trust on-chain data as much this year, but we have some other powerful tools, such as market leverage, which suggests a deep discount regime has developed in the Perpetual futures market.
When this metric has an extended negative regime (green), it’s incredibly rare for the market to drop measurably, as it is telling us that all those who wanted to sell have, and are in fact positioned net short. We are just coming out of such a negative regime today.
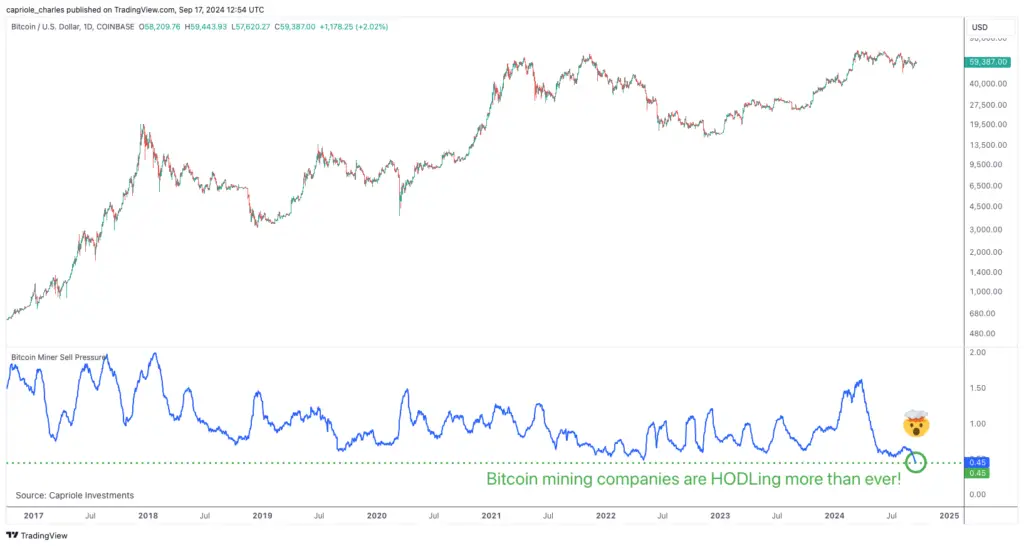
Let’s also take a look at the ultimate Bitcoin OG long-term holders, Bitcoin Miners.
Bitcoin Miners today are HODLing more than ever in history. The relative outflow to their reserves is at an all time low.
The Bottom Line
With Bitcoin trading within 2% of our last update, our view from Issue 53 that we are at a major pivot point remains.
What lies ahead? Seasonally we have the best two quarters just 2 weeks away from us, which are also within the best 12-18 month window to be allocated to Bitcoin every 4 years, and at the start of a dovish Fed multi-year regime which will see growing liquidity injected into risk assets. We also have Gold paving consistent new all time highs since its break out a few months ago. You couldn’t ask for more favorable conditions for Bitcoin.
On-chain data has been giving conflicting signals, which we now consider highly unreliable for 2024. This has made the last 6 months very challenging to manage. But reliable signals which are unaffected by the long-term holder supply flows show a promising outlook.

Charles Edwards


One Response
Would you be able to explain why BTC price has been underperforming since the approval of ETFs, which now hold close to 61bln? How can a finite asset like BTC, with all this interest and buying not be appreciating more?
Total availability on all exchanges is all time low, ETFs are buying almost each day and yet the price is dropping?