Welcome to Capriole’s Newsletter Update #50. A consolidation of the most important Bitcoin news, technicals and fundamentals into a 3-minute update.
Technicals

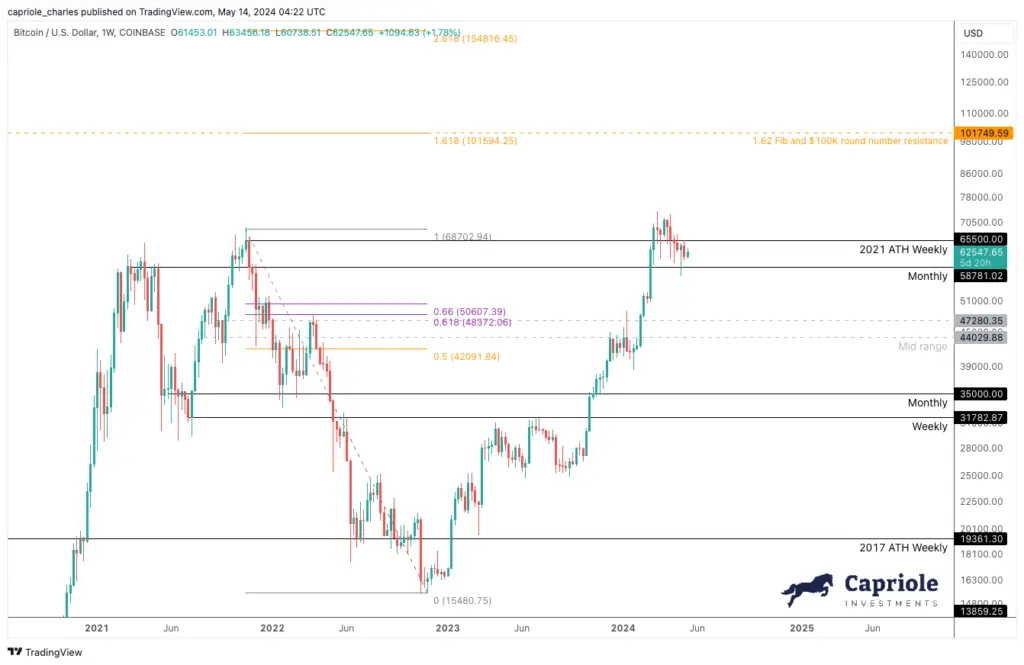
The important Weekly and Monthly levels noted in Issue 48 six weeks ago remain just as relevant today. Bitcoin continues to backtest the cycle range highs in the $58-65K region, with weekly closes above $58K supportive of the long-term trend continuation.
In short: the technical picture remains bullish, provided price holds above $58K. The longer we spend in the range highs, the more likely this structure will merge into a classic ‘cup and handle’ pattern which would typically see strong price appreciation following.
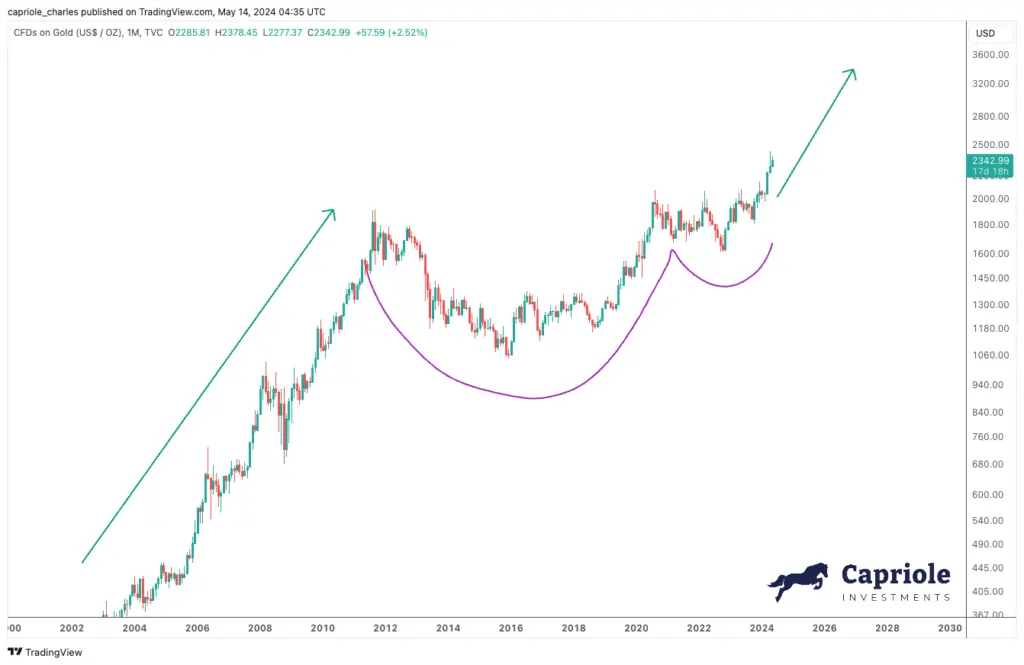
Sidebar: Gold just spent 13 years printing a massive cup and handle and broke out to the upside in March. Gold’s “cup” lasted almost 4 years. The two assets share some similarities, and if the ratio timewise is somewhat similar that suggests the possibility of Bitcoin spending up to 9 months in the range high forming a cup before a measured more up. Nine months is not a requirement, but simply a scenario to consider as a possibility.

Gold broke out of a massive 13 year cup and handle structure in March.
Our assumption is we could spend up to another 4 or 5 months in this region and the macro picture would remain unchanged. That said, given we are now pushing all time records for Bitcoin without a 25% drawdown at 376 days, we should also be open minded to a substantial downside flush at some point during the mid year summer months. Again, not a requirement, but a real possibility.
Fundamentals
The collective picture as shown through Capriole’s machine learning fundamentals model “Bitcoin Macro Index” continues to be risk off. This Index includes over 60 of the most powerful Bitcoin on-chain, macro market and equities metrics combined into a single machine learning model. This is a pure fundamentals-only value investing approach to Bitcoin. Price isn’t an input.
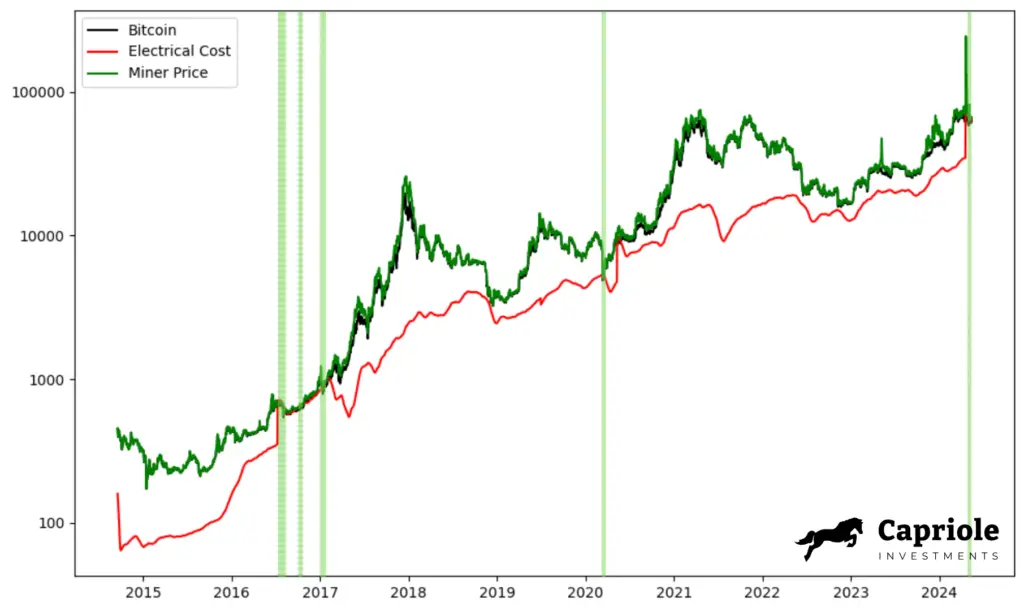
The Macro Index has continued to trend down since the $73K top. However, the counterforce today remains Bitcoin Electrical Cost which has been fluctuating near Miner Price since the Halving in April (see below). This is the typical Halving volatility dynamic we have discussed in recent issues and which can take a couple months to play out. Nonetheless, dips of Miner Price below Electrical Cost continue to be incredibly rare and great long-term opportunities. Read more above Electrical Cost here.

The five times Bitcoin Miner Price has dropped below Bitcoin Electrical Cost in history.
Chart Of The Week:
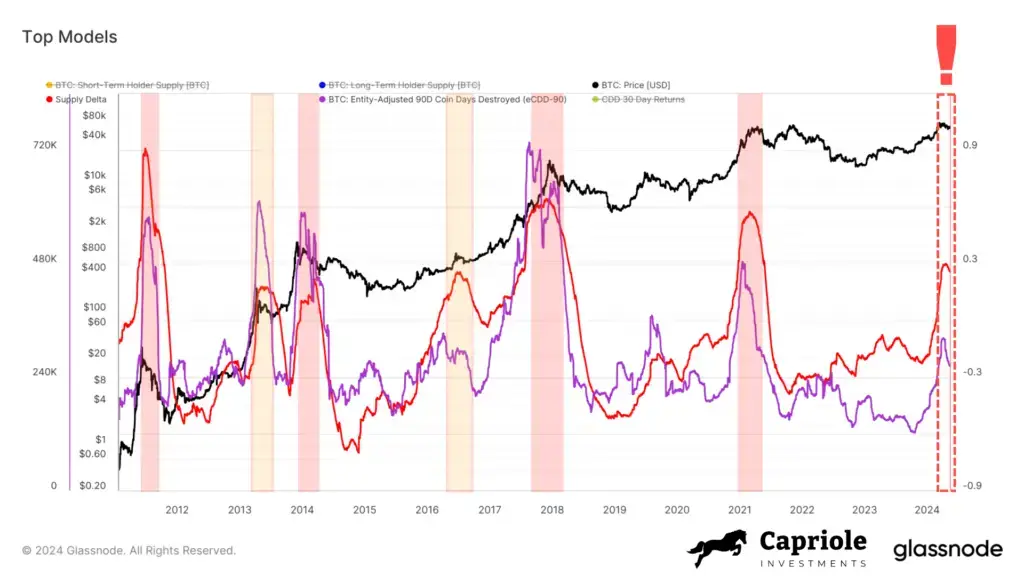
This week we look at Supply Delta and 90 Day Coin Days Destroyed (CDD).
These two metrics are great at identifying cycle tops. You can read more about Supply Delta here. The quick and dirty summary: when these metrics are high, it suggests high long-term holder selling.
After these metrics go vertical, it’s important to be cautious of rounded tops, which can signal the cycle top is in. Unfortunately, both metrics have formed rounded tops today. The possible exceptions here are the two mid-cycle zones highlighted in Yellow below. There’s reason to believe we are at a comparable mid-cycle pit stop as the magnitude of each metric today is close to these two cases (especially Supply Delta, the Red line), not to mention the comparables with various other on-chain indicators that suggest a similar mid-cycle point.
Regardless, this chart is telling us to expect at least a few months (possibly up to 6 months) of sideways chop and volatility before trend resumption. We are at the two month mark today. The timing of these metrics with the “Sell in May” adage doesn’t go unnoticed. There are quite a few reasons like this to expect a quiet Bitcoin summer.
This major warning sign is from some of our favourite cycle top signals. Fortunately, most of the other metrics still suggest this cycle has quite some room to run.

Supply Delta and CDD Metrics suggest major caution and likely a few months of volatility (at the least).
The Bottom Line
The overall Bitcoin picture says we should expect at least a measured pause here which could last anywhere from days to months through the summer period. From a technical perspective this is also a warranted pit-stop and does not necessarily impact the macro bullish trend. Fundamentals have also cooled off as discussed in Issue 49 and we might expect those to ramp up again by Q3/Q4. That said, if the fundamentals do not improve in through late summer across Bitcoin onchain data and broader macroeconomic liquidity, that would be a big red flag.
For now, Bitcoin is telling us to ‘touch grass’ while still representing value for the coming 12-24 months.

Charles Edwards


