Welcome to Capriole’s Newsletter Update #48. Where we consolidate the most important Bitcoin news, technicals and fundamentals into a 3-minute update.
Market Summary
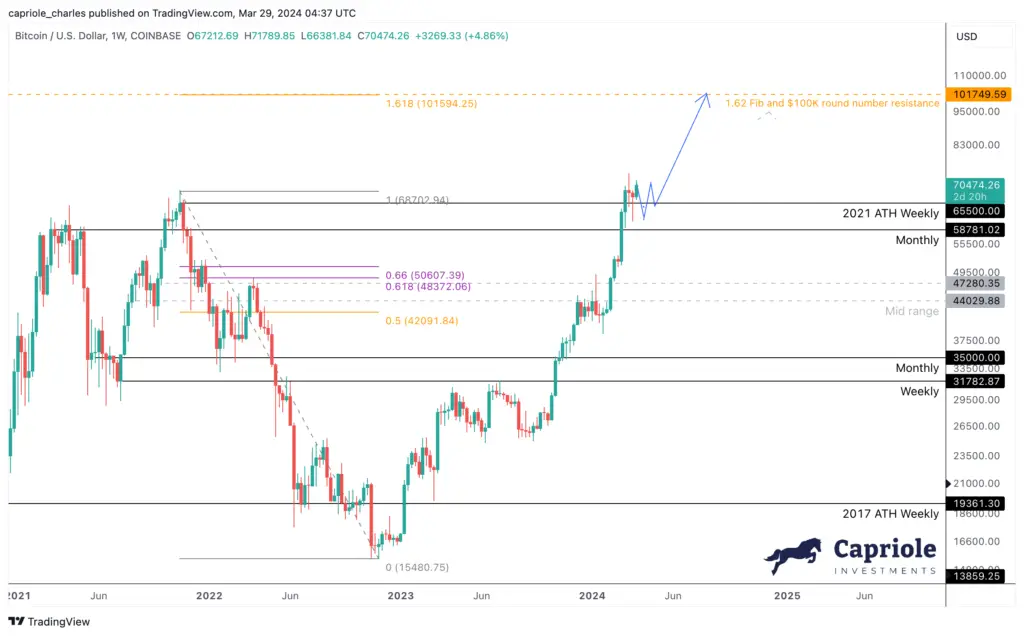
In early March we discussed the increased probability of volatility and consolidation in the $60-70K region. That’s exactly what we saw, with price now pushing last cycle’s all time highs at $70.4K as of writing. This is the formation of the zig-zag “SOS” coiling structure we also outlined could be expected to occur in the prior issue.
At the same time, we also saw ETF flows stagnate last week, which now looks like it may be on the mends (TBD). This is all very typical price action behaviour in the zone of all time highs, and is also normal for both months either side of the Halving. I also discussed this consolidation dynamic in the below Tweet:
It's normal for volatility in the 1 month either side of the Bitcoin Halving. At this point, everyone who wanted to buy into the Halving mostly has. Following the Halving we have inefficient miner shutdown and other transitory effects. Somewhat like the 1 month post ETF launch…
— Charles Edwards (@caprioleio) March 20, 2024
The biggest Halving in Bitcoin’s history is just days away. For the first time, Bitcoin will become harder than gold, with half its supply growth rate. Pent up institutional demand via the ETFs, a programmatic supply squeeze from the Halving and Bitcoin taking the title as the world’s hardest asset. There’s a lot to look forward to in April.
Technicals

High Time Frame Technicals: Price is trading at new highs on the Weekly and Monthly timeframes having retested support twice in the last month. This is price discovery territory. A very bullish technical structure. There are no significant resistance levels of note above $70K. The best we can do from a purely technical perspective is look to round number resistances (psychological boundaries at $10K increments) and Fibonacci extensions. This leaves $100K as the next most likely major resistance level, with $101K being the notable 1.618 Fibonacci extension from the 2021 all time high ($69K) to the 2022 cycle low ($15K).
You can also imagine quite a few investors would be happy seeing six digit Bitcoin and taking profit in that zone. Though how much of a hurdle $100K is remains to be seen, I would be highly surprised if we didn’t see prices a lot higher over the next 12 months, given the 12 months from the Halving is usually the best risk adjusted period to allocate to Bitcoin through history.
Further price structure developments will allow us to establish lower timeframe daily levels and technical structures as the year develops. For now, open skys are the best thing could ask for.
Fundamentals
Fundamentals and on-chain data help us understand which way the probabilities are skewed at important inflections, and were critical to our navigation of this cycle and identification of the bottom at $16K.
We believe the full picture of fundamentals is best summarized by Capriole’s Bitcoin Macro Index, which we publish live with weekly updates here. This Index includes over 60 of the most powerful Bitcoin on-chain, macro market and equities metrics combined into a single machine learning model. This is a pure fundamentals-only value investing approach to Bitcoin. Price isn’t an input.
Fundamentals continue to trend positively, with continued growth across the Bitcoin Network. However, the rate of change in growth has declined substantially versus the incredible strides taken in February. Suggesting the potential for a possible turning point to emerge, or perhaps simply a speed bump. Nonetheless, while on-chain fundamentals continue to improve, albeit at a slower rate, it’s hard to present a bearish case today.
Chart Of The Week
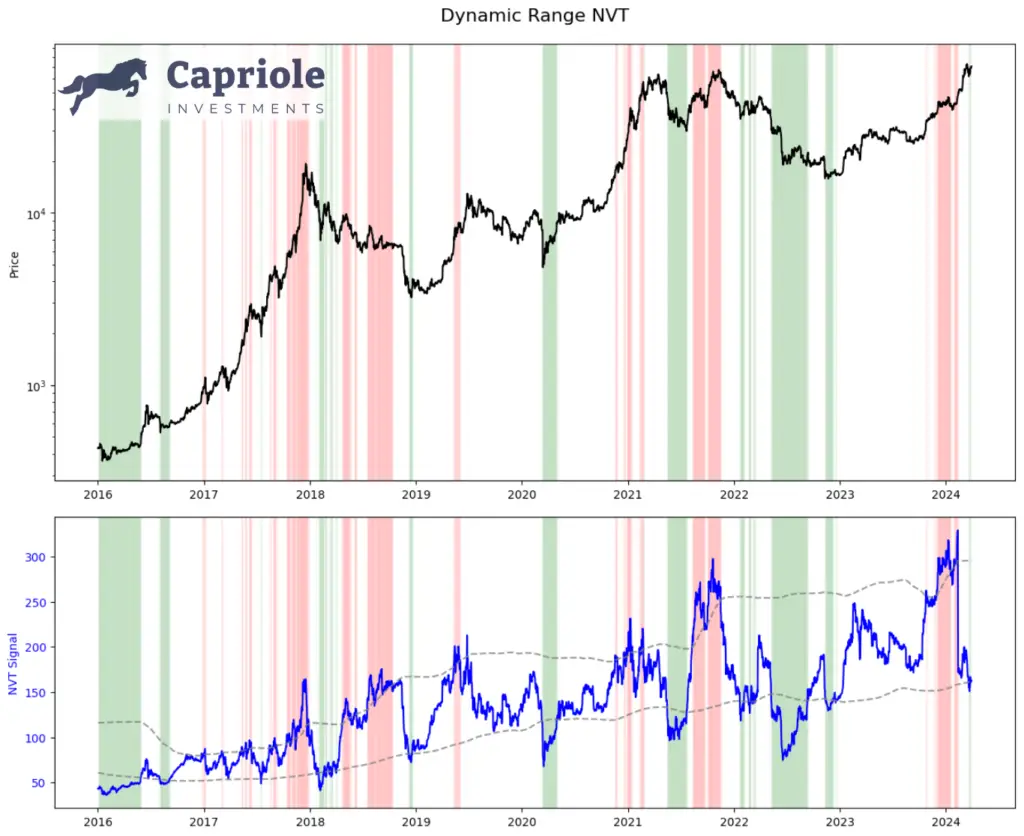
Introducing Dynamic Range NVT (DRNVT), published live now on Capriole.com/Charts.
NVT is often referred to as Bitcoins “PE Ratio” as it assesses the relative value of the network by considering the onchain transaction throughput to Market capitalisation. We first shared DRNVT back in 2019 (here) as a dynamically adjusting valuation technique to account for NVT’s upward drift. As far as I am aware, the DRNVT metric now published live on Capriole.com/Charts (which uses the original BCHAIN datasource), is not available anywhere else, as TradingView’s data feed stopped in January.
What’s fascinating at this point of the cycle is that DRNVT is currently in a value zone. With price at all time highs, this is a promising and unusual reading for the opportunity that lies ahead in 2024. It’s something we didn’t see in 2016 nor 2020.

The Bottom Line
Technicals and fundamentals are very positively positioned going into the Halving. We are in price discovery territory with the next notable resistance level being $100K. That said, the month of the halving often sees volatility and consolidation, much like we saw through March. As always we should remain open minded to various outcomes over the coming month as a result. Nonetheless, probabilities are starting to skew to the upside once again.
Happy Easter!

Charles Edwards


2 Responses
Appreciate your work in the space, Charles.
Would it be possible to overlay bitcoin price chart onto the indicators such as the DRNVT and others for easier tracking of the indicators’ historical performance? Would you guys also consider adding more exchanges such as Kucoin and MEXC into the Guardian Exchange Risk Report? Thank you!
Hi Billy, Yes definitely possible, but we would need to implement a more advanced charting UI at Capriole.com/Charts for that. Something that is on the to-do list for the future!