Welcome to Capriole’s micro update. Where we consolidate the most important Bitcoin news, technicals and fundamentals into a 3-minute update. Two technical charts, two fundamental charts and our chart of the week.
Market Summary
From a technical perspective, nothing has changed in the last 2 weeks. Bitcoin’s price remains at $29K, in a sideways consolidation that has created one of the absolute lowest volatility periods in Bitcoin’s 14 year history.
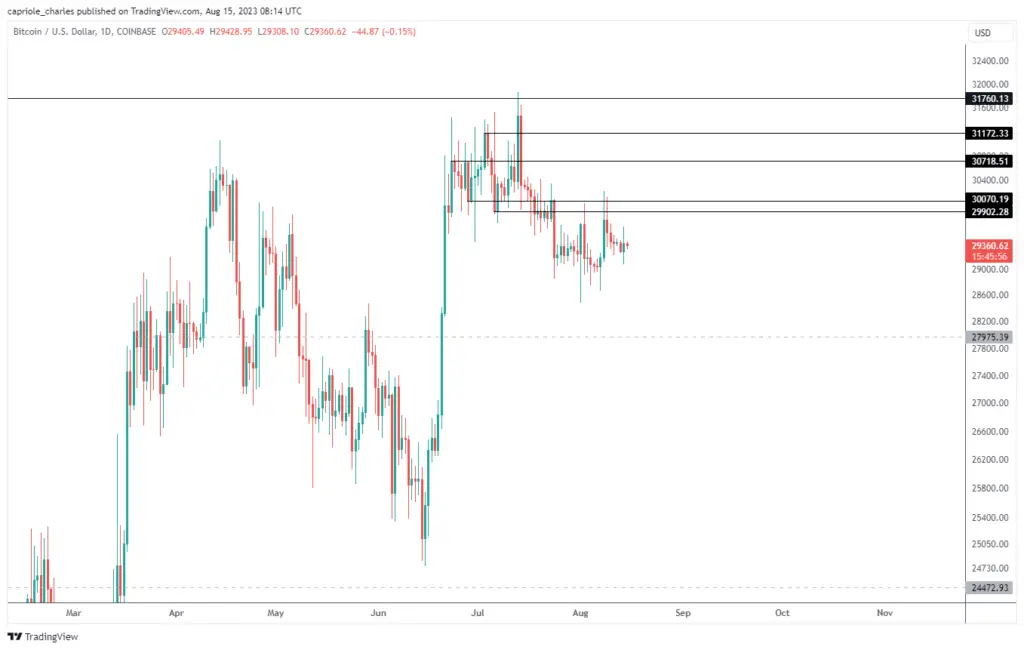
While we are still in a technical bearish breakdown from $30K, the lack of a downward follow through in Bitcoin’s price is somewhat promising. The reason being, if price was going to collapse, we would usually have seen that follow through by now. Nonetheless, a close back above $30K on the daily timeframe is required at the minimum as a technical confirmation of a failed breakdown. When that happens, we would consider that quite bullish.
The fundamentals for Bitcoin’s onchain data remain in contraction, though the rate of decline has decelerated considerably in the last days, suggesting a turn may occur soon. To be confirmed.
Finally, we have a number of Bitcoin ETF approval decisions on the immediate time horizon. An approval could cause a break from the current low volatility range. Best not to pre-empt this though, as these decisions often get pushed. Confirmations are key to mitigate risk.
Technicals

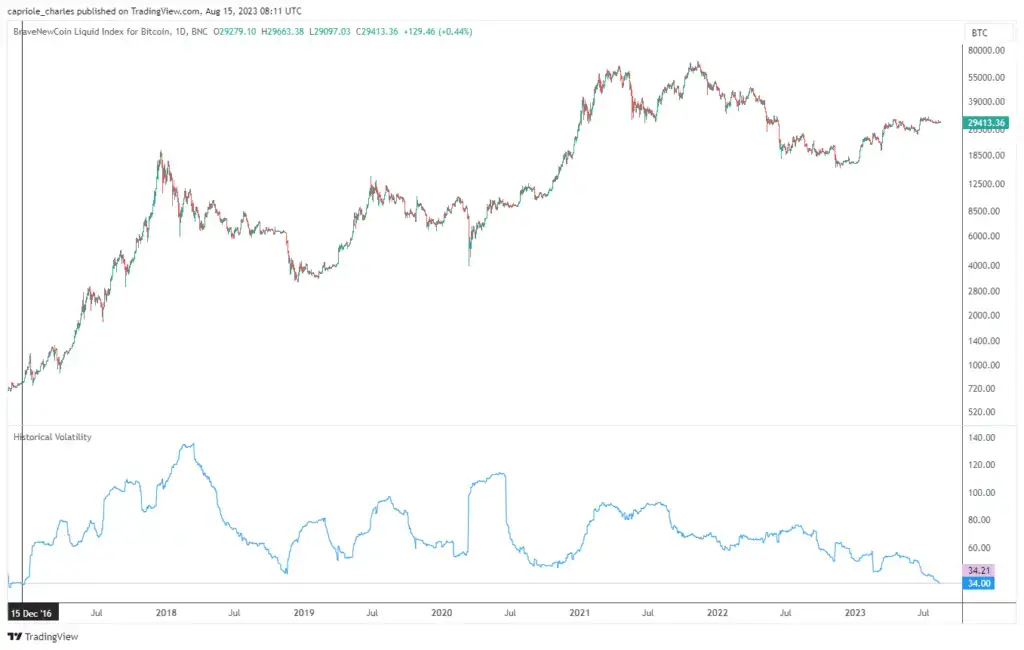
High Timeframe Technicals: Since 2010, Bitcoin’s historic volatility has only been lower than today in 2016. Suggesting a big price move is on the horizon when volatility expansion (reversion to the mean) occurs. Interactive Chart here.

Low Timeframe Technicals: Bitcoin’s $30K breakdown has (so far) failed to follow through and we remain in bearish “no mans land” at $29K. A close back into the Wyckoff structure at $30K would signify a failed breakdown and therefore be a very positive technical signal. Interactive Chart here.
Fundamentals
Price is only half the picture. What about on-chain flows? What are retail and institutional investors doing with their capital? Is the mining network and security growing? How can we incorporate macroeconomic changes, equity market risk and broader market sentiment into Bitcoin? Finally, how do all these metrics compare on a relative basis to prior Bitcoin cycles?
We believe the full picture of fundamentals is best summarized by Capriole’s Bitcoin Macro Index.
Over 40 of the most powerful Bitcoin on-chain, macro market and equities metrics combined into a single machine learning model. This is a pure fundamentals-only value investing approach to Bitcoin. Price isn’t an input.
Current Bitcoin Macro Index Score: -0.36 “Contraction”
Bitcoin Macro Index: The Macro Index today remains in a period of relative value (below zero), suggesting decent long-term value for multi-year horizon investors.
Our interpretation: long-term bullish, short-term neutral
If you like the Bitcoin Macro Index, we share a weekly update of the of it and the Ethereum Macro Index here. The Capriole Fund actively trades the Macro Index model on a daily basis, but what we present here is updated on a semi-static, weekly basis.
Chart of the Week
Bitcoin Production Cost is a classic valuation model created by Capriole back in 2019.
“Bitcoin Production Cost” is the all-in cost to mine a Bitcoin based on the global average electrical consumption of Bitcoin miners.
“Bitcoin Electrical Cost” is the raw electrical cost to mine a single Bitcoin – simple put the effective power bill of Bitcoin miners, on a per Bitcoin basis.
This chart has been live (updated quarterly) on TradingView for four years, but only as of today is it available on daily granularity and with automated updating – on Capriole’s very own website!
You can read more about the derivation of this model here.
We are also sharing the live chart for you to monitor here.
Bitcoin Production Cost shows that Bitcoin is still trading in a region on long-term value. I would be surprised if this holds into 2024.
Bottom-line
The net picture today is long-term value, amidst slightly less bearish technicals. The period of value shown by Bitcoin’s Production Cost today is unusually long, comparable only with 2016. The value opportunity today, combined with the current very rare low volatility period and lack of follow through in the bearish $30K breakdown leans me towards expecting a bullish breakout above $30K on the horizon. All else equal, Bitcoin is like a beach ball submerged underwater. Nonetheless, we remain in a technical breakdown. We don’t know how long that hand will hold the ball underwater for. Prudent risk-management will await a technical confirmation before acting.

Charles Edwards
Founder
Capriole Investments Limited


