Issue 13: The Supply Squeeze
Bitcoin is up over 30% to date in October, reaching as high as +53% last week. We printed new all time highs last week, but quickly rejected as excessive leveraged long positions piled up. Today we find ourselves at $58.5K.
There are signs of froth in the market, but let’s check out the full picture…
The News
There wasn’t much bad news in crypto this month. The key milestone for October (and likely this quarter) was the SEC’s approval of multiple Bitcoin ETFs. The products and success of these ETFs is not so important, but the SEC’s stamp of approval is. It confirms in black and white that Bitcoin is here to stay and the US financial industry supports it.
Here’s this month’s highlights:
The Good
- Bitcoin hit a new all time high of $66,999 on Coinbase
- First Bitcoin ETFs get approval by the SEC including ProShares’ $BITO which became the first ETF ever to trade over $1B in its first 2 days.
- El Salvador officially started volcano powered Bitcoin mining
- Mastercard to allow all banks and merchants on its network to use crypto services
- The Korea Teacher’s Credit Union, which manages $47 billion, is investing in Bitcoin
- CME Futures Open Interest hits an all time high and tops all other crypto exchanges
- Payments giant Stripe says its reentering crypto
- Coinbase becomes the exclusive cryptocurrency platform partner of the NBA, WNBA NBA G League, NBA 2K League and USA Basketball
- Walmart, the largest company in the world by Revenue, begins hosting Bitcoin ATMs
The Bad
- CoinMarketCap hack reportedly leaks 3.1 million user email addresses
The Rest
- Biden administration seeks to regulate stablecoin issuers as banks
The Fundamentals
Bitcoin fundamentals are excellently placed. It’s hard to find a bearish on-chain metric despite the massive price rise in October.
For this stage of a bull market, it doesn’t get much better than this.
Supply Side
Supply held by whales (those holding between 100-10K BTC) continues to rise, showing no signs of potential weakness, as it has in prior risk regions.
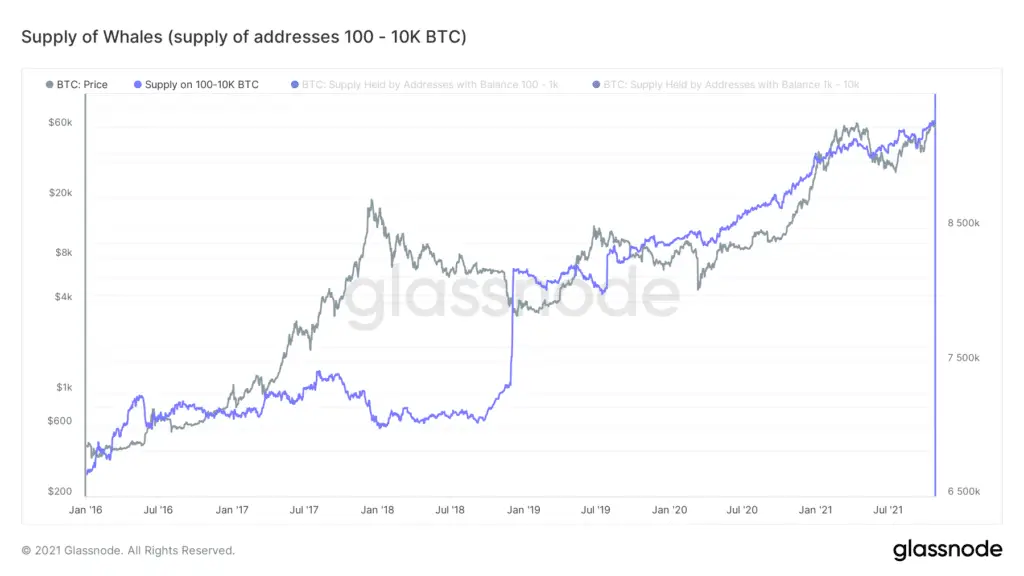
Total Bitcoin held by Whales (those holding between 100 and 10K BTC). Data: Glassnode
Illiquid Supply Shock, a metric developed by Willy Woo and WIll Clemente, shows a strong bullish trend. This metric represents the relationship between long-term holder supply (less liquid) and short-term tradable supply (more liquid). When the ratio is high, more supply is trapped with entities that don’t trade often, meaning there is less available supply for everyone else to buy or sell. For the same level of demand, increasing Illiquid Supply Shock is bullish. It’s pushing all time highs today and not showing signs of distribution.
Another way of slicing Supply Shock is to simply look at the inverse of supply held on exchanges or “Untradable” supply shock. Unsurprisingly this shows a very similar profile to Illiquid Supply Shock and has pushed significant new multi-year highs.
In fact we have seen over $3B of exchange outflows in the last couple days alone. Both of these metrics tell us there is a relatively low level of available supply and long-term holders have not been selling into the current Bitcoin strength. Both set the stage for further price continuation as long as these trends hold against a similar or growing level of demand.
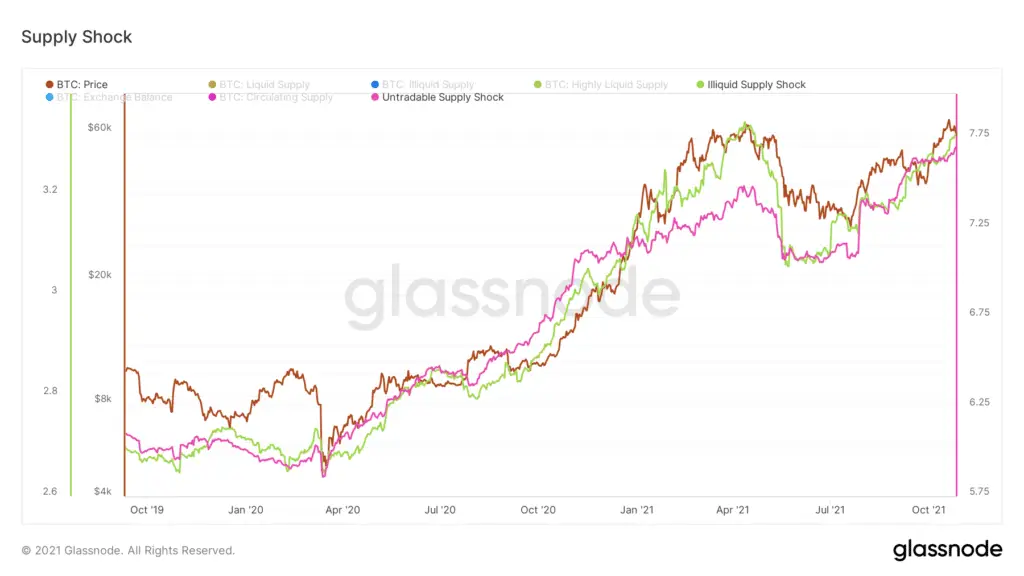
Supply Shock and Untradable Supply. Data: Glassnode
Hash Rate is pushing new all time highs, with only 6 other days achieving higher rates in history. This is an incredible sign of strength. 60% of the network turned off 5 months ago with the China ban. That immense hardware, heavy infrastructure, warehousing and business operations have completely respawned elsewhere around the world in less than half a year. It shows how powerful Bitcoin is. It shows the immense resilience of the asset. And it increases Bitcoins Energy Value at the same time.
As applies in many respects to investing and trading, when the data (price, supply, etc) does the exact opposite of the narrative, reverses a fake out, breakdown or other distributive event in a very short period of time, it is usually very bullish.
The majority of the most powerful computer network in the world just got turned off and banned by one of the most powerful countries in the world. That same network fully reclaimed its lost infrastructure in less than half. Wow.
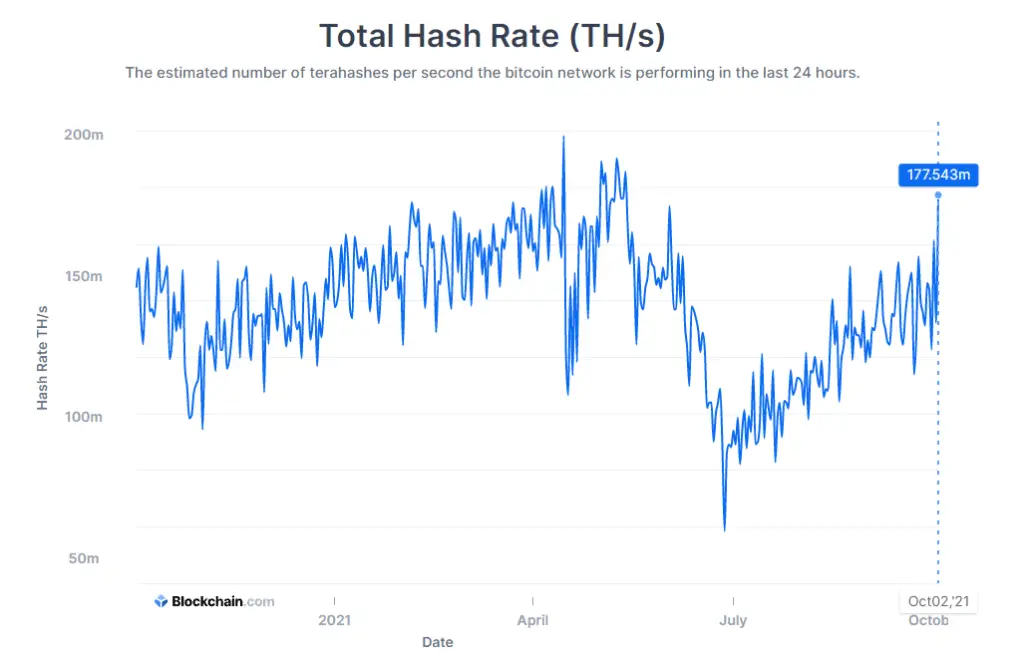
Bitcoin’s Hash Rate has only been higher on 6 other days in its 13 year history. Data: Blockchain.com
Demand Side
Both entity adjusted and standard Dynamic Range NVT, or Bitcoin’s “PE ratio”, show that Bitcoin is in a normal or discounted area here, trending between or below the dynamic range bands. Neither metric shows any signs of relative demand side overvaluation at the macro level.
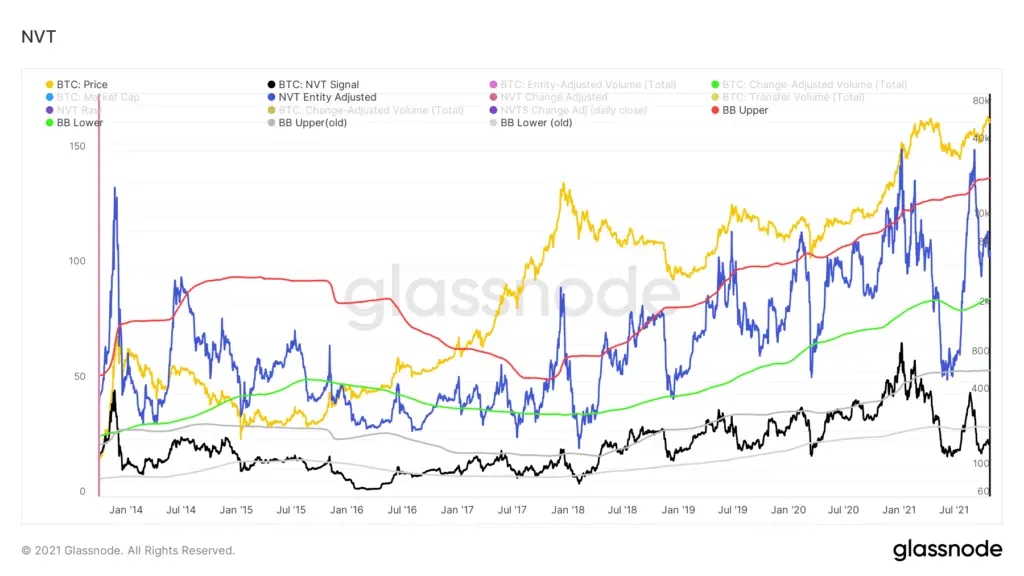
Entity adjusted (blue line) and standard Dynamic Range NVT (black line). Data: Glassnode
Active Entities, the number of daily active unique parties (individuals or institutions) using Bitcoin is still on the low side. This highlights that the recent rally has been driven by supply extraction of institutions. We have also seen this with the consistent $1B blocks of Bitcoin being withdrawn from exchanges over the last months. We believe this is representative that retail demand is still very low for Bitcoin which is both a pro and a con:
- PRO: Low retail demand while price is pushing all time highs and supply is compressed is massive untapped potential. It means that once price clears and holds all time highs (and provided supply remains constrained) fresh demand and entity growth can fuel the next major parabolic price rally.
- CON: Bitcoin needs sustained demand to continue to appreciate. If active entities were to plateau or start trending down here we would be concerned.
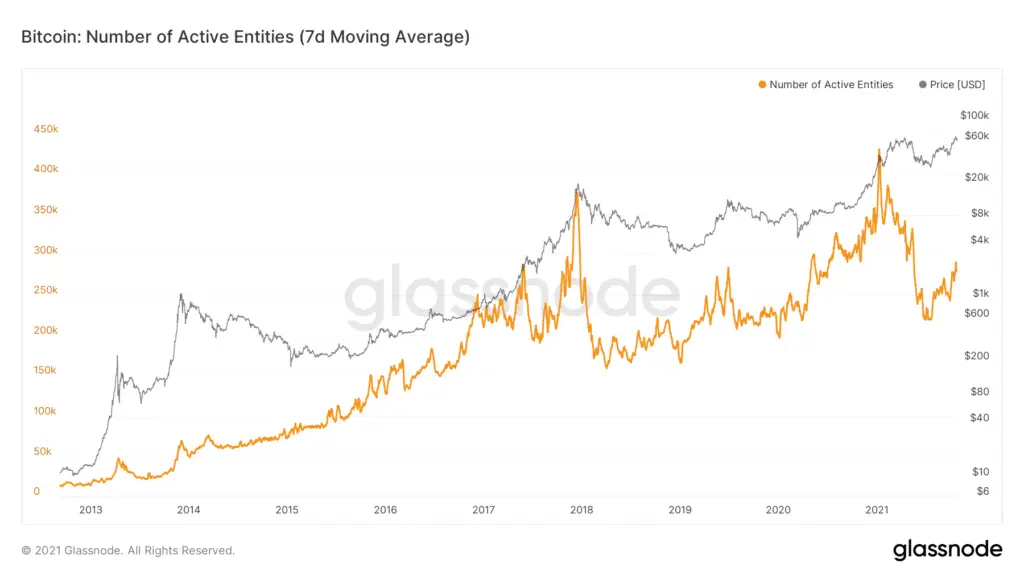
The number of Active Entities in the Bitcoin network is growing, but still miles below early 2021 levels.
Bitcoin’s untapped demand is also shown in Google search results for Bitcoin, which are as low as they were in May/June when Bitcoin was just $30K. We expect that once Bitcoin achieves a sustained breakout, and re-occupies news headlines, these trends will start to rise as will renewed retail interest.
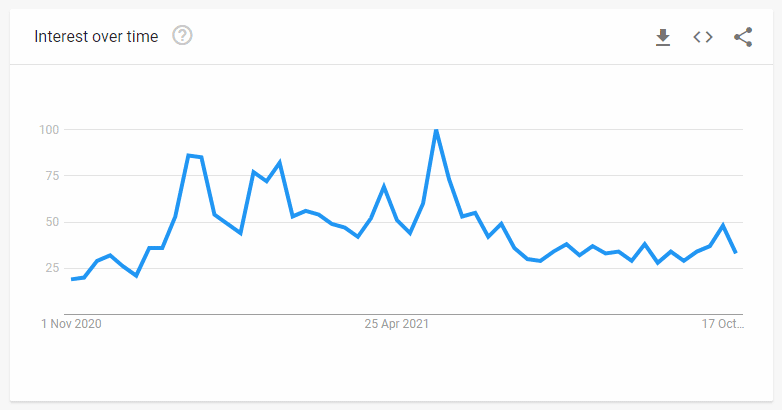
Google Search interest in Bitcoin is near the lowest it has been all year, lower than when Bitcoin was at $30K. Data: Google Trends
The Technicals
Bitcoin is currently trading above all meaningful weekly support/resistances. With the one main hindrance being the rejection of the all time high. Consolidation above $58K is bullish consolidation at resistance, which given the fundamentals should have a higher probability of upside breakout.
After what was a 50%+ rally, it’s not out of the ordinary to see some correction and consolidation here (-13% so far), as we re-fuel for the next leg.
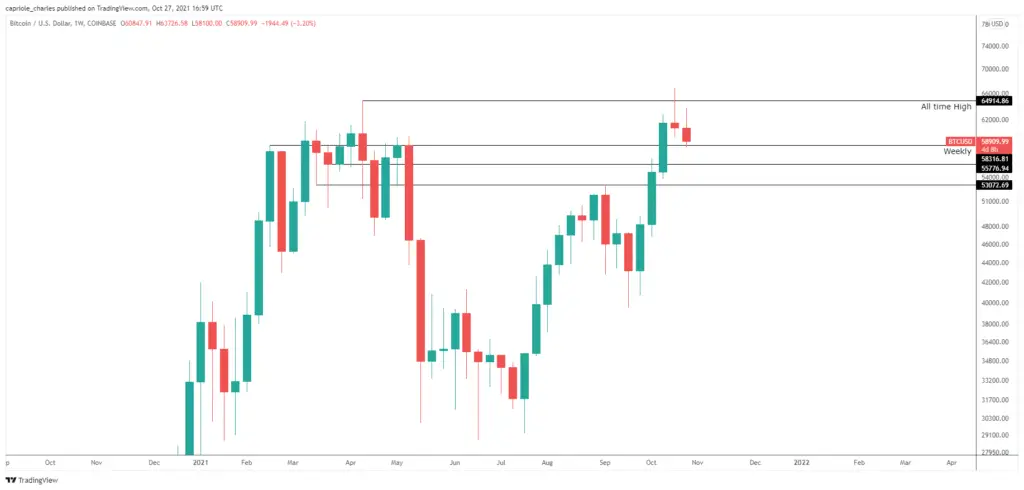
Technical levels of interest. Data: TradingView
The Less Good things
However, there are two main concerning factors which grow with importance the longer they persist:
1. Leverage got out of control
Leverage in Bitcoin Futures went more vertical than Bitcoin as we hit a new all time high last week. It’s normal to expect some of this on a new all time high, but nothing like funding rates pushing 5-8X baseline levels that we saw. This needs to calm down for sustainable price discovery. Fortunately it has somewhat today (27 October 2021), but we need to see how this trend develops over the next days and weeks.
2. Altcoins and memecoins are pumping into Bitcoin weakness (again).
When Bitcoin goes sideways/down and altcoins, specifically meme coins like SHIB and DOGE, start pumping it can be suggestive of froth. A desperate search for yield. Under such conditions, when Bitcoin can’t hold strength, the entire market will often collapse down further. Good examples of this are the 2017 top, the 2021 May top and again early in September 2021. So far it doesn’t look that extreme yet, Bitcoin held its own very well for most of October, but there is a noticeable change since last week. If Bitcoin fails to hit all time highs over the next weeks and this trend continues, we would be concerned.
The Bottom-line
Fundamentally, Bitcoin is in great shape here. Supply is tightening, institutional demand is strong, and retail demand remains untapped.
Technically, Bitcoin looks good, we are above all major resistances. But the fact we struggled so much to maintain all time highs shows we are still completely lacking retail interest, as also shown by the data. We have not yet seen fresh retail demand. The existing owners of crypto drove excessive short term movements by leveraging up positions to levels not seen since the May crash. We needed to see more fresh demand (spot buying) come in to sustain that trend. But it hasn’t yet.
Short-term traders disappointed by their Bitcoin returns began cycling into memecoins again over the last week. If history tells us anything it is that crypto rallies cannot sustain long without Bitcoin strength. On an all time high breakout, Bitcoin should be leading the pack (at least for a few weeks) and we want to see that happen next time as a sign that a new leg up in this bull market is sustainable.
Statistically, all time highs are great times to invest, with odds being significantly higher in the near term for continuation.
Given the state of Bitcoin fundamentals, and the incredibly well aligned macroeconomic environment today, we expect this shorter-term overheating will calm down over the next days and weeks.
However, the “Less Good things” will be key to monitor. Should they sustain, the picture could change drastically and quickly. Should supply start to flow back into Bitcoin while we have just rejected on all time highs this mostly bullish picture could change very quickly.
Provided the supply dynamic remains similar to today, and the leverage overheating subsides, November should be another great month. New all time highs are our base case which will likely trigger fresh retail and institutional demand driving Bitcoin considerably higher again (reflexivity).
Important Reminder: we only write this newsletter once a month. But Bitcoin’s outlook changes day-to-day. Please keep that in mind and make a plan for yourself accordingly. We do our best to highlight considerations we find useful, but they are relevant as of writing only. Our view changes often throughout the month depending on market conditions.
New Article and Open-source Metric
This week we published a short article detailing a new metric “Supply Delta” to help identify Bitcoin tops and risk regions. Guess what: It suggests we are nowhere near a macro top today.
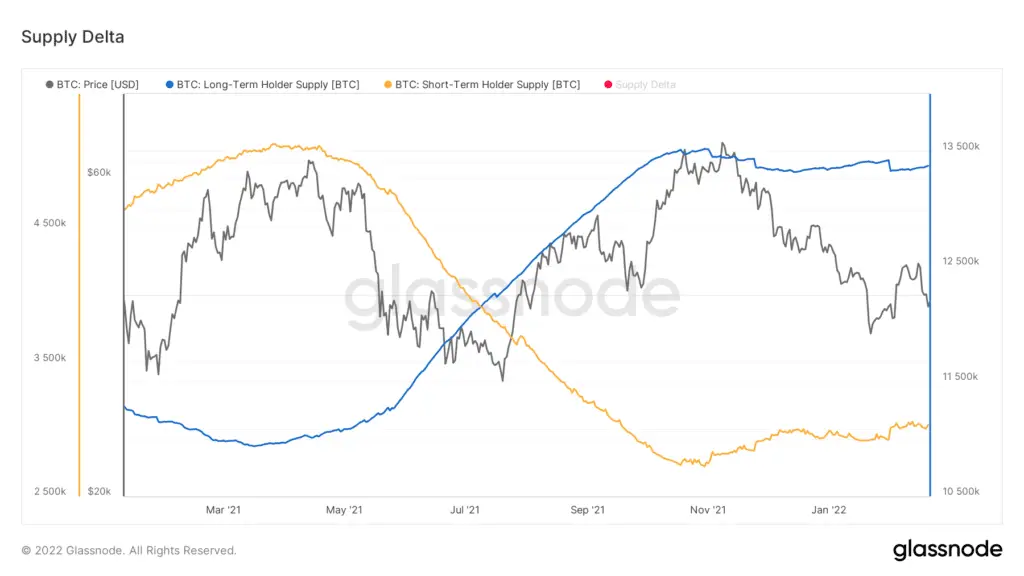
Supply Delta – Read more on Medium here
We are hiring!
Capriole is hiring! We are looking for traders, engineers and machine learning experts. If you are interested in what we do, check out our open positions at: www.capriole.com/join.


