Dips are for Buying
Welcome to the fourth edition of the Capriole Newsletter.
Every month we write a short update on the market. We try to time this around pivotal moments for Bitcoin. We wrote the last issue when Bitcoin was $23.5K. We expected the bull-run to continue, with a dip being a further buying opportunity.
That dip never came. Bitcoin surged to close the year at $29K with unprecedented holiday demand. The new year started as the old year left off, with another $13K increase in just 8 days before we found major resistance at $42K.
Today, at $32K, we are in Bitcoin’s largest drawdown since the March crash. Let’s see how things look now…
The News
- Cryptocurrency market cap surpasses $1T for the first time ever
- BlackRock gives two funds go-ahead to invest in Bitcoin Futures
- Sequoia to pay interested employees in Bitcoin
- Morgan Stanley buys 10% stake in MicroStrategy and Microstrategy buys $10M more Bitcoin
- Grayscale continues to take supply off the market, 40K BTC in the last 30 days
In line with previous months, institutional investors have sucked a lot of liquidity out of the market. BlackRock, the world’s largest asset manager with over 7 trillion USD under management, has filed documents with the SEC allowing them to trade Bitcoin futures. On Wall Street, Bitcoin has gone from “speculative” to “interesting” to “inflation hedge”. As more prominent asset managers enter the space, industry pressure mounts on other funds to follow suit or face difficult questions from investors.
Banks in the U.S. can now also get more involved, as the top bank regulator OCC has clarified that banks can custody bitcoin for their clients. This is a huge endorsement for Bitcoin and reduces the risk of unforeseen regulations or bans.
The Markets
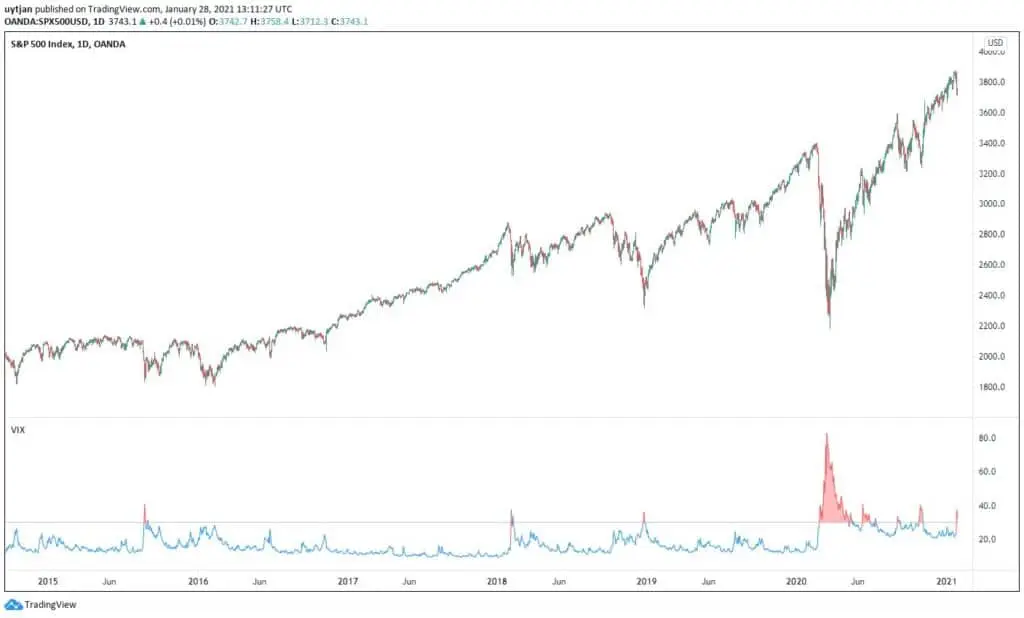
Stock markets have regularly set new all time highs in the past month. Continuous talks about stimulus packages drive prices higher. This week, however, US stock markets have dropped and CBOE Volatility Index (VIX) increased to over 35. Historically, when this has happened a steep rebound follows.
Higher VIX has also resulted in high correlations between stocks and Bitcoin in the past. When the stock markets dropped yesterday, Bitcoin dipped almost 10% to below $30K. Caution is advised as long as stock markets are volatile.
https://www.tradingview.com/x/FqI23Xnx/
The Fundamentals
Despite the correction, the underlying Bitcoin network has shown significant strength. While Bitcoin was dropping from $42K, several on-chain metrics showed all time highs, including the number of active addresses, the hash rate, the block size and the number of whales. The latter could indicate that coins were moving from weak hands to institutional-hands and long time bitcoin investors.
Typical Bull Market Corrections
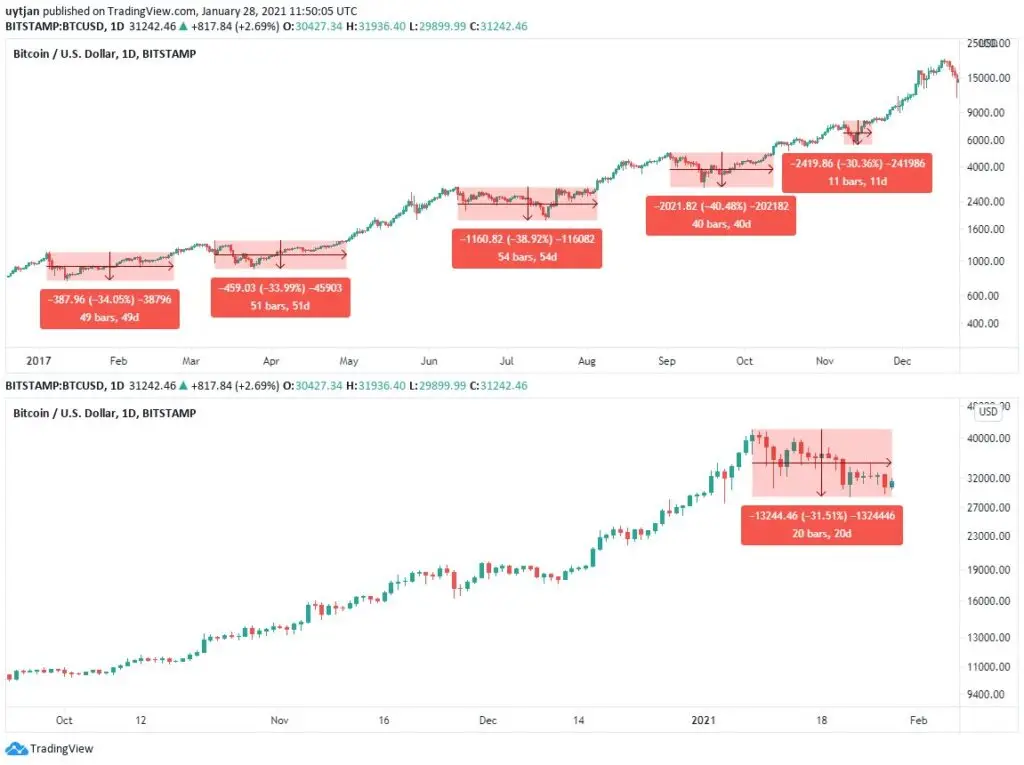
Let’s take a closer look at this bull market correction. After an end-of-year rally in December, and a new-year rally in early January, Bitcoin finally topped out at $42K. In less than 36 hours it dropped more than -26%, and later continued to as much as -31% below the top. History shows that corrections like this are not uncommon in a bull-market. In the previous 2017 bull market, the average correction was 35% and lasted 41 days until the next ATH was set.
https://www.tradingview.com/x/OdxVVElc/
HODL Waves
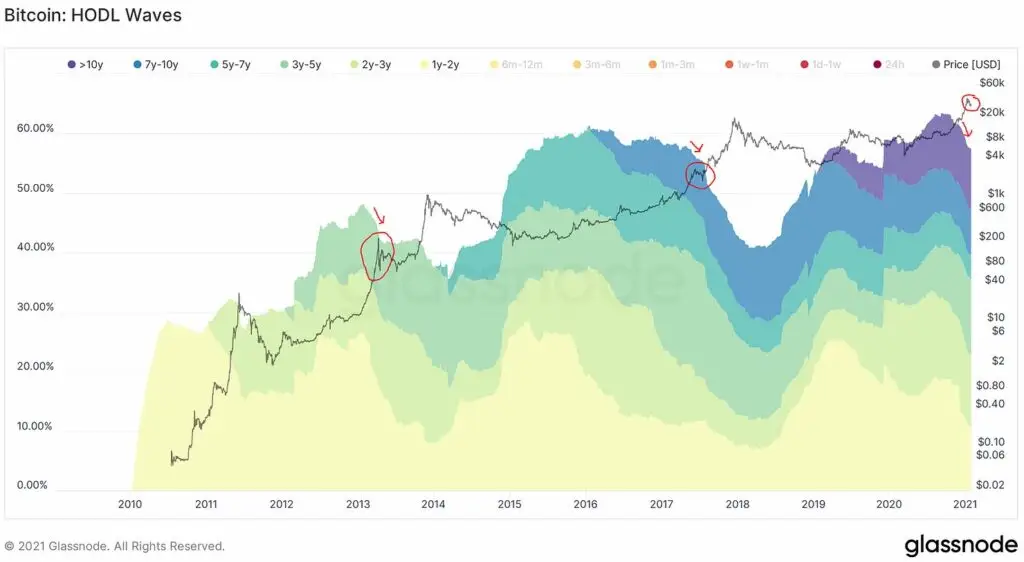
Historically, when Bitcoin breaks an all time high, hodlers that have been hodling for more than a year start selling their coins. At the same time, the rally usually continues due to the fresh interest in Bitcoin from newcomers and traders. Inevitably a correction follows. This dynamic and exchange of capital is shown nicely on the HODL Waves chart below.
Spent Output Profit Ratio (SOPR)
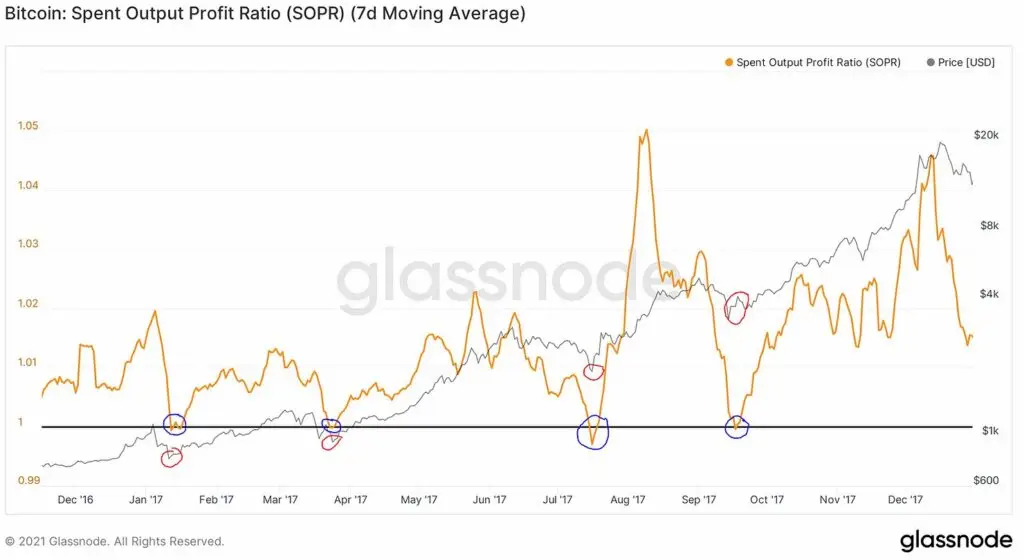
Dips like we are seeing now are common and expected in bull markets. Full resets pave the way for further growth. The Spent Output Profit Ratio illustrates this well. SOPR measures whether coins were on average sold at a profit (SOPR > 1) or at a loss (SOPR <1).
As shown above, when Bitcoin price increases a lot, longer term HODLers tend to sell some coins at a profit. The higher the price gets, the more they sell. This changing hands of coins increases SOPR and, critically, also increases selling pressure. The rising selling pressure continues until the average Bitcoin transaction is at a loss (SOPR<1). In the previous bull market, when this ratio hit 1, it was the best time to buy as it demonstrates a clean reset of speculative behaviour.
The Glassnode Spent Output Profit Ratio
In the past weeks, SOPR has dropped from a 3 year high to just above 1.001. While not a total reset, it is “near enough” and indicates we are in (or near) a bull market buy zone.
The Grayscale Premium
Another interesting metric to look at right now is the premium that is paid to invest in the Grayscale Bitcoin Fund (Ticker: GBTC). Each share represents a certain amount of satoshis, therefore you would expect the price of the share to be similar to the price of the underlying satoshis. The Grayscale Bitcoin Fund tends to attract institutional investors with longer time horizons.
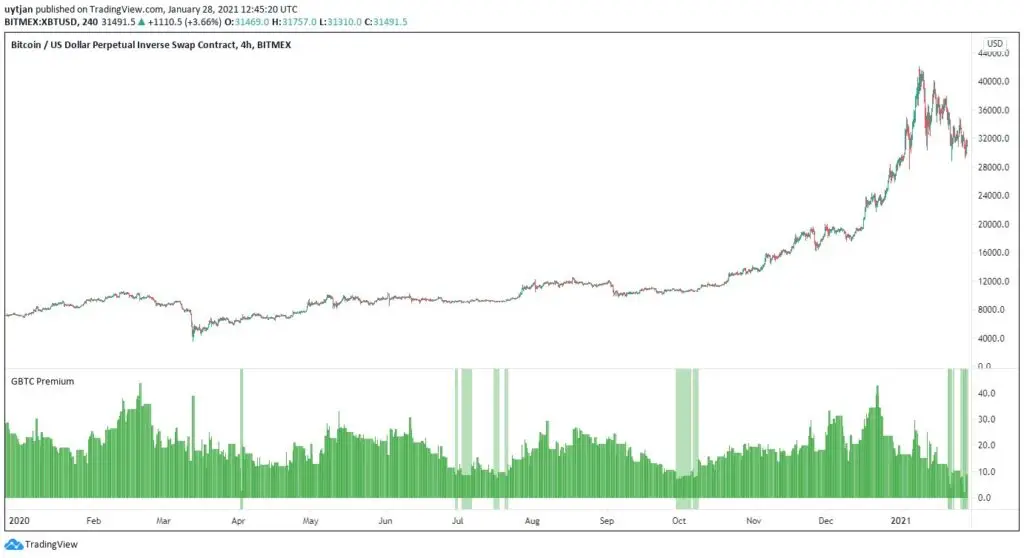
However, before the recent dip, GBTC shares were trading at a premium of more than 20%, sometimes even up to 40%. Investors without access to actual Bitcoin ,and in fear of missing the current bull run, rushed in through GBTC. The Fund grew to over 600K Bitcoin, worth over $20B. Today, shares in GBTC trade at a premium of less than 5%, which has only happened in 3 periods before in history, all of them being great buy opportunities.
Over the last 12 months, whenever the GBTC premium was low, it was a great time to buy.
https://www.tradingview.com/x/CWD0pTjN/
The Technicals
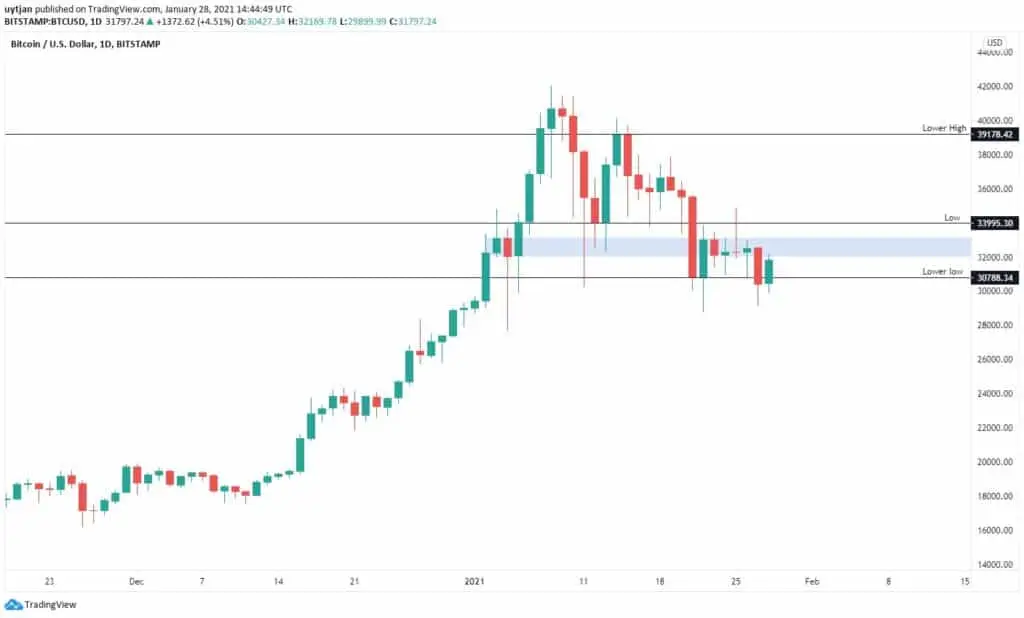
The recent dip was a full retest of the yearly open, a historically significant level for Bitcoin.
Initially, a daily order block at $33K provided support. Then Bitcoin proceeded to set a lower high, which can indicate normal consolidation. However, this bullish consolidation pattern was broken when Bitcoin set a lower low on the daily chart, indicating a possible trend reversal and the potential for further downside. Of all the data reviewed this issue, the price action data is the least convincing.
The first and most critical step for bulls is to reclaim the $33K order block. A close above this level would likely be a great long opportunity. Should a short term breakdown occur, the $27K region has a high degree of price action support and Fibonacci level confluence.
https://www.tradingview.com/x/T1hCEy2N/
The Bottom-Line
Today, Bitcoin’s fundamentals look great. Even though the short term price action is not certain, the medium- to long-term is bullish. Dips like the current one are common in Bitcoin bull markets, and usually present great buy opportunities. We are in such a dip right now.
A number of metrics today are at or very near typical bull market retracement levels. The current dip of 31%, is in the range of the prior 2017 bull run averages of 35%. SOPR dropped to within a whisker of a full reset. So while there may be a case for slightly further downside in this dip based on the Technicals above, the odds are definitely stacked in favour of longs from a fundamentals perspective and based on the historical statistics of Bitcoin bull runs.
If you believe in the 2021 bull case, you must ask yourself: would you rather wait for the chance to long a new dip a couple percent lower, or are you happy to accept that this dip meets 90% of the characteristics of prior bull run dips?
Oftentimes bargain hunters are left stranded on the side of the road in parabolic Bitcoin bull runs. We think the bottom is in.
Content we love
- Nic Carter’s article on the recent Bitcoin price resurgence
- For the traders – a great short video on momentum and beta
- Bitcoin Core 0.21.0 summary release notes


One Response
Hi Jan,
What is the order block your are referring to with respect to resistance levels?