


Introducing: Supply Delta
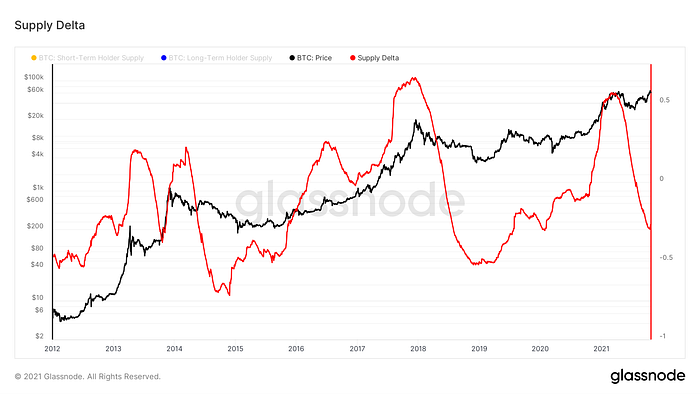
Identifying how strong and weak hands accumulate and distribute their Bitcoin provides a good leading indicator for identifying price tops and risk regions.
In this article we introduce a simple metric “Supply Delta” which helps highlight when risk of a price top is locally high and may warrant tighter risk management. Supply Delta is also useful at highlighting accumulation zones.
Short- and Long-Term Holder Supply
In 2020, Glassnode introduced an approach to classifying short- and long-term holders into two distinct categories based on coin movement age.
Rafael and the team found that once a coin was held for 155 days, it had a significantly higher probability of being held for the long-term, and therefore can be considered “long-term holder supply”. Conversely, Short-Term holder supply represents all other off exchange balances with coin age less than 155 days.
Plotting supply held by short- and long-term holders provides a good visual representation of how supply is accumulated and distributed as price cycles develop.
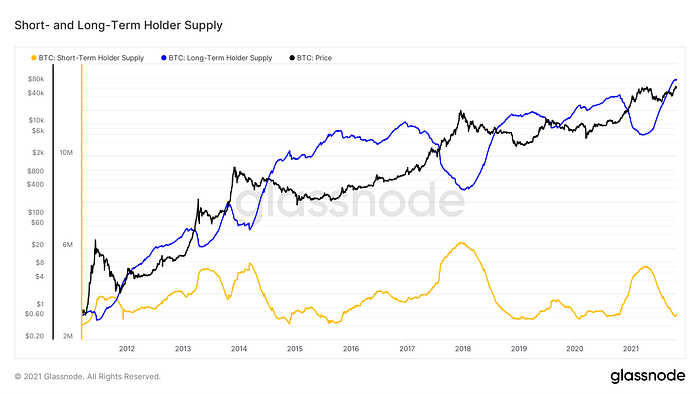
Long-term holders show greater investment sophistication — increasing their holdings during bear markets, and reducing their holdings as price makes new all-time highs. On the other hand, Short-Term holders are typically drawn in as price rallies and are quick to release their holdings on the first signs of price weakness.
Signal from Short- and Long-Term Holder Behavior
Long-Term holders typically distribute over long periods as price rises, which can make it somewhat difficult to identify when would be the best time to reduce long exposure from a potential cycle top, as this process can go on for months.
We can see visually that it might be a good idea to reduce risk exposure as short-term holdings peak, and start to decline, but the short-term holders tend to sell into (and after) this weakness, which can make it somewhat of a lagging indicator.
If we combine the two metrics on a normalized basis, we can better see when the best time to de-risk may be.
Supply Delta
Supply Delta is simply the difference between normalized Short-Term Holder Supply (STHS) and Long-Term Holder Supply (LTHS):
Supply Delta =STHS/sma(STHS) – LTHS/sma(LTHS)
Where sma() is a simple moving average taken over 2 years (720 days) to normalize the data and allow for equal comparison.
Supply Delta is more of a leading-indicator than Short-Term Holder Supply alone (it tops earlier) and provides clearer, more distinct signal than Long-Term Holder Supply.
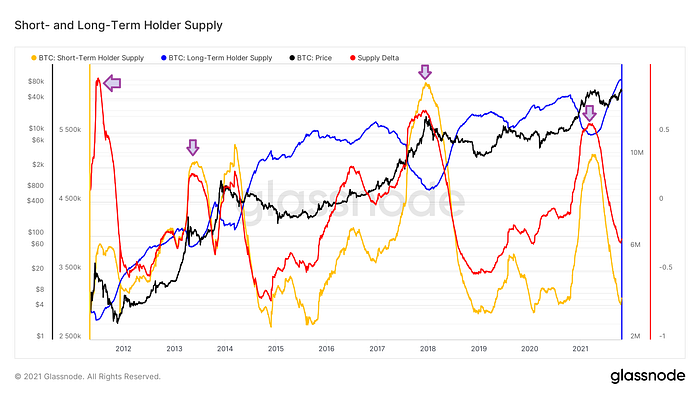
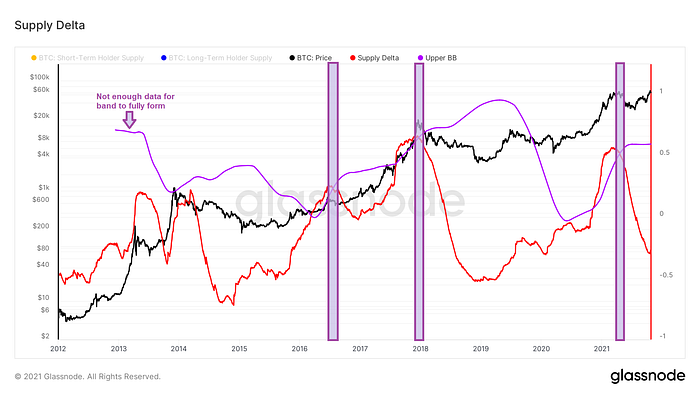
Zooming in on 2021, Supply Delta clearly topped before either either Short-Term or Long-Term holder supply alone, providing a good signal to de-risk in the $50–60K region before price declined over 50%.
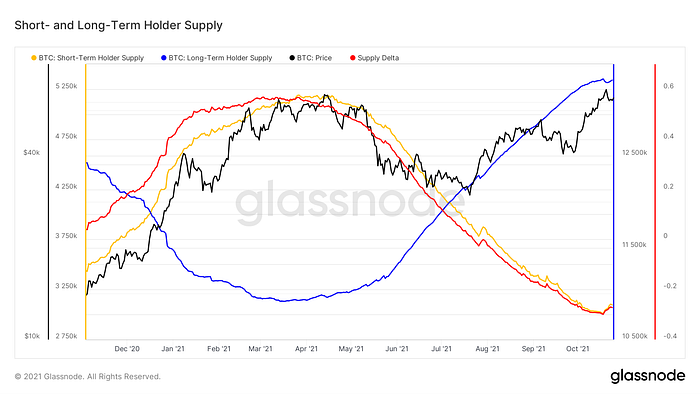
Any rapid spike and subsequent decline of Supply Delta appears to be a good region to de-risk. Another approach is to apply a 2 year Bollinger Band to the metric (similar to the Dynamic Range NVT metric), which helps to visualize higher risk regions, particularly as Supply Delta crosses down.
Limitations
Like all metrics, Supply Delta is not perfect.
In August 2016, Supply Delta provided a topping signal which would have been good risk management locally, but was by no means a cyclical top. Supply Delta should be considered together with other metrics and potentially be used to assist in position sizing risk management.
The components of Supply Delta also exclude Bitcoin balance on exchanges. If supply is further concentrated on exchanges, on the lightning network or ‘locked up’ in other protocols or layers, the signal of this metric will reduce with time.
Conclusion
Supply Delta is a simple on-chain oscillator which provides good signal to manage Bitcoin downside risk.
It provides clearer, leading signal over Short- and Long-Term Holder Supply.
—
Edit 23 February 2022:
This metric is now live and can be tracked on Glassnode: https://studio.glassnode.com/workbench/supply-delta
Disclaimer on Backtests
Any Backtest performance returns presented represent hypothetical returns and are meant to simulate how a strategy would have performed during the period shown had the strategy been implemented during that time. Backtested/simulated performance returns are hypothetical and do not reflect trading in actual accounts. Backtest returns are provided for informational purposes only to indicate historical performance had the strategy been implemented over the relevant time period. Backtested performance results have inherent limitations as to their relevance and use. One of the limitations of hypothetical performance results is that they are generally prepared with the benefit of hindsight. In addition, hypothetical trading does not involve financial risk, and no hypothetical trading record can completely account for the impact of financial risk in actual trading, such as the ability to withstand losses or to adhere to a particular trading program in spite of trading losses, all of which can also adversely affect actual trading results. There are numerous other factors related to the markets in general and to the implementation of any specific trading program which cannot be fully accounted for in the preparation of hypothetical performance results, all of which can adversely affect actual trading results. Any and all of these factors mean that no representation is being made that strategies presented here will achieve performance similar to that shown, and in any case, past performance is no guarantee of future performance.